information Article
A Feature Selection Method for Large-Scale Network Traffic Classification Based on Spark Yong Wang 1,2 , Wenlong Ke 3 and Xiaoling Tao 2,3, * 1 2 3
*
Guangxi Key Laboratory of Trusted Software, Guilin University of Electronic Technology, Guilin 541004, China;
[email protected] Guangxi Colleges and Universities Key Laboratory of Cloud Computing and Complex Systems, Guilin University of Electronic Technology, Guilin 541004, China Key Laboratory of Cognitive Radio and Information Processing, Guilin University of Electronic Technology, Guilin 541004, China;
[email protected] Correspondence:
[email protected]; Tel.: +86-0773-2291076
Academic Editors: Yong Yu and Yu Wang Received: 20 December 2015; Accepted: 29 January 2016; Published: 15 February 2016
Abstract: Currently, with the rapid increasing of data scales in network traffic classifications, how to select traffic features efficiently is becoming a big challenge. Although a number of traditional feature selection methods using the Hadoop-MapReduce framework have been proposed, the execution time was still unsatisfactory with numeral iterative computations during the processing. To address this issue, an efficient feature selection method for network traffic based on a new parallel computing framework called Spark is proposed in this paper. In our approach, the complete feature set is firstly preprocessed based on Fisher score, and a sequential forward search strategy is employed for subsets. The optimal feature subset is then selected using the continuous iterations of the Spark computing framework. The implementation demonstrates that, on the precondition of keeping the classification accuracy, our method reduces the time cost of modeling and classification, and improves the execution efficiency of feature selection significantly. Keywords: feature selection; Fisher score; sequential forward search; MapReduce; Spark
1. Introduction Network traffic classification [1] refers to the classification of the bidirectional TCP/UDP flows generated by network communications according to the application types such as WWW, P2P, FTP, and ATTACK. As an important preprocessing of traffic classification, the feature selection aims to select a feature subset that has the lowest dimension and also retains classification accuracy so as to optimize the specific evaluation criteria. Due to the significant effect on the performance network traffic selection in the current big data environment, the feature selection has become a key research area in such fields as machine learning, data mining and pattern recognition [2]. Current feature selection methods can be categorized into two groups, according to whether the subset evaluation criteria depend on the subsequent classification algorithm: filter and wrapper. The filter methods take the feature selection process and the subsequent machine learning method into consideration separately, and make a selection on the basis of the characteristics of the dataset itself. They have a fast operation, but lead to poor performance in selection. The wrapper methods take the subsequent classification algorithm as the evaluation index of the feature subset; they achieve higher classification accuracy, but result in low efficiency and a large amount of computation. Thus, how to integrate the two methods to bridge the gap between the accuracy and the executing efficiency is a challenge in the research of feature selection [3].
Information 2016, 7, 6; doi:10.3390/info7010006
www.mdpi.com/journal/information
Information 2016, 7, 6
2 of 11
With the network bandwidth and the number of users growing continuously, the size of network data has been increasing rapidly; thus, improving the efficiency of the feature selection method has become an urgent demand. Some researchers parallelized and improved the traditional feature selection methods using the Hadoop-MapReduce framework, which enabled it to deal with super large-scale data. However, computation complexity of such solutions cannot be ignored. Recently, more and more research shows that the MapReduce computational model is suitable for processing jobs with large amounts of data but uncomplicated computation. In terms of complex computation, like the wrapper methods with many iterations, the MapReduce framework has inferior execution efficiency. In order to solve the aforementioned problems, in this paper, we put forward a feature selection method based on Spark (FSMS). In our approach, a filter method called Fisher score is used to process the complete feature set, eliminating features with a low distinguishing degree and worse discrimination performance. We also adopt the concept of the wrapper method, in which the sequential forward search is used as the searching strategy, the classification accuracy is used as the evaluation criterion, and the feature combination with the strongest classification ability is continuously selected using the Spark computing framework. Finally, the optimal feature subset for traffic classification is acquired. 2. Related Work The evolution of Internet applications has made traditional methods for classifying network traffic progressively less effective [4]. Port-based methods can easily misclassify traffic flows, mostly because of new applications randomly selecting port numbers. Current research efforts have formed a new trend of using machine learning methods to classify network traffic based on flow statistical features [5]. The combination algorithms have been proved to allow a further improvement in terms of classification accuracy with multi-classification [6]. Thus, trying to use the combination algorithms to select the most significant and effective features is worthwhile. The filter feature selection methods measure features by analyzing their internal characteristics. The classic methods include information gain [7], Fisher score [8], Relief-F [9], etc. The wrapper methods adopt different strategies on the feature subset, but one evaluation criterion on the candidate subset. Rodrigues et al. [10] took the bat algorithm (BA) as the guidance and the optimum path forest classifier (OPF) as the evaluation function to select the optimal feature subset. Chuang et al. [11] proposed a better classification result by combining binary particle swarm optimization (BPSO) with a genetic algorithm (GA) and using k-Nearest Neighbors (k-NN) as the classifier to select the feature. Both filter and wrapper methods have their own advantages and disadvantages, which are complementary to each other. Peng et al. [12] integrated the two approaches into a sequential searching approach to improve the classification performance. The hybrid feature selection method generally filters out some of the unrelated or noisy features using the filter methods first, and subsequently selects the optimal feature subset using the wrapper methods. With the data scale increasing rapidly, how to carry out the feature selection for big data becomes a critical issue. Appropriate and novel designs for highly parallel low-cost architectures promise significant scalability improvements [13]. The feature selection and traffic classification systems must be redesigned to run on multicore hardware, targeting low-cost but highly parallel architectures [14]. At first, the Hadoop-MapReduce framework had become a research focus. Sun et al. [15] introduced the joint mutual information method into the feature selection. The high efficiency and expansibility of the method was tested by experiments. Based on the cloud model, Li et al. [16] proposed an improved method of SVM-BPSO feature selection, in which the wrapper evaluation strategy was adopted, and the local optimal solution was achieved with a faster convergence rate, and a better result was thus obtained. Long [17] parallelized and improved the feature selection method using the Hadoop-MapReduce framework to enable it to deal with large-scale data. However, Srirama et al. [18,19] pointed out that the MapReduce model was suitable for processing jobs with large amounts of data but uncomplicated computing. In order to deal with the complex iterative
Information 2016, 7, 6
3 of 11
computations, the MapReduce model had lower execution efficiency. Spark [20] is a new-generation parallel-computing framework based on memory, which performs better than MapReduce in the iterative computation. Currently, there are limited research outcomes on Spark in the field of feature selection of network traffic. This paper puts forward a feature selection method for network traffic based on Spark and investigates its performance and effect. 3. The Parallel Computing Framework 3.1. Hadoop-MapReduce Hadoop is a distributed open-source software framework for the clustered environment and large-scale dataset processing. It provides MapReduce as the core programming interface and Hadoop Distributed File System (HDFS), which can process as many as one million nodes and data with the magnitude of Zettabyte (ZB). Among them, MapReduce is a computing framework used for large-scale data processing, by which the parallel computing is abstracted in two stages, namely Map and Reduce, to deal with data by mapping and protocol. Having many advantages such as simple programming, ease of extension and good fault-tolerance, MapReduce became the most popular parallel processing strategy at present. However, much research proves that the MapReduce computing framework is suitable for processing the job with large amounts of data but uncomplicated core computing. Faced with many instances of complex iterative computations, the following problems arise: (1) It only provides two expressions for Map and Reduce, which are hard to fully describe the complex algorithm; (2) although the algorithm is the same for each iteration, the implementation of the MapReduce operation must be renewed at each iteration, which will incur unnecessary system overhead; (3) even though the input data is slightly varied at each iteration, MapReduce will read the complete data again from HDFS, which will take up enormous time, CPU resources, and network bandwidth. 3.2. Spark Spark is a parallel computing framework for big data based on memory computation. Its framework adopts the master-slave model in distributed computing. A master is a node containing the master process and slaves are nodes containing the worker process. Acting as the controller of whole clusters, the master node is responsible for the normal operation of the whole clusters. The worker node, which is equivalent to a computing node, receives commands from the master node and generates a status report. The executor is responsible for the task execution. As the user’s client, the client is responsible for submission and application. The driver is responsible for controlling the execution of an application. The advantages of Spark in iterative computations are mainly described as follows: Firstly, a Spark operation based on a resilient distributed dataset (RDD) not only realizes the operator map and reduces function in MapReduce, but also provides ten times as many operators, which can fully describe the iterative algorithm. Secondly, several rounds of iteration can be integrated into one Spark operation. At the beginning of the operation, the raw data will be read into the memory, from which the corresponding data is transferred directly at each iteration to perform multiple calls to the data after reading at one time. Thirdly, the intermediate result of computation is also stored in memory, but is not written to disk in order to avoid an I/O operation on disk with quite low efficiency, which improves the operation efficiency significantly. 4. FSMS 4.1. The Filter Methods for Feature Selection Based on Fisher Score The filter-based feature selection method takes the feature selection process and the subsequent machine learning method into consideration separately and selects the feature subset based on the
Information 2016, 7, 6
4 of 11
characteristics of data itself. The Fisher score, as a high-efficient filter-based supervised feature selection method, according to the feature selection criteria of the minimum intra-cluster distance and the maximum inter-cluster distance, evaluates and sorts the features by the internal properties of a single feature. The relevant definitions are defined as follows: ´ ¯2 k´x n x i k“1 k i ` k ˘2 řc k“1 nk σi
řc F piq “
(1)
where i is the number of features, k is the class, c is the total number of classes, nk is the number of samples in class k, xik is the mean value of the i-th feature in class k, xi is the mean value of the i-th feature in all samples, σik is the variance of the i-th feature in class k. The bigger F piq is, the better the discernibility of the feature is. Traditionally, there are at most hundreds of characteristics of network traffic data. The calculation is too large when the iterative discrimination is directly used for whole features. With the Fisher score, the features with low discernibility and poor identification performance are eliminated from the complete feature set, and the initial feature subset is then obtained. Thus, the amount of computation of subsequent wrapper methods is significantly reduced. Due to its simple and fast calculations, it can be applied to the dimension reduction of large-scale and high dimensional data. 4.2. The Wrapper Feature Selection Methods Base on the SFS Strategy The wrapper feature selection method consists of two parts: the selection strategy and the evaluation strategy, which are considered as the feature selection process and the follow up machine learning method respectively. In this paper, the sequential forward search (SFS) of heuristic searching is used as the selection strategy, and the classification accuracy is used as the evaluation index. The selection process is described as follows: The initial feature subset can be defined as X = { f 1 , f 2 , ¨ ¨ ¨ , f m }, the optimal subset of features Y is null, and the classification model is M. 1. 2. 3. 4. 5.
The classification accuracy of each feature in X is obtained separately by the classification model M. The feature achieving the highest accuracy is added into Y and eliminated from X. Each feature in X is combined with all the features in Y separately, and then obtains their own classification accuracy by the classification model M. The corresponding feature of the highest accuracy in X is added into Y and eliminated from X. Steps 3 and 4 are repeated until the stopping criterion is reached.
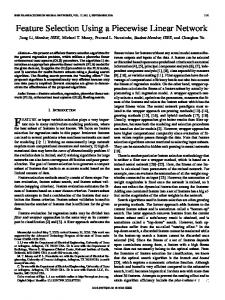
Note the threshold α for the stopping criterion adopted in this paper. If the obtained accuracy begins to decrease compared with the previous round, and the decrease amplitude is larger than α, then the feature selection process stops. In this case, the selected features are the optimal subset of features available for later classification operations. 4.3. The Realization of FSMS FSMS is a feature selection method based on the Spark, a parallel programming framework. This method preprocesses the complete feature set by the Fisher score to obtain the initial feature subset. After that, the sequential forward search, which is used as the searching strategy and the classification accuracy, is used as the evaluation criterion to continuously select the feature combination with the strongest classification ability, which is implemented by Spark. The process of FSMS is shown in Figure 1.
Information 2016, 7, 6 Information 2016, 7, 6
5 of 11
5 of 11
Figure Figure1.1.FSMS FSMS flowchart. flowchart.
The Algorithm of FSMS: input: complete feature set = { , , ⋯ , }; The Algorithm of FSMS: output: optimal feature set Z; input: complete feature set X “ t f 1 , f 2 , ¨ ¨ ¨ , f l u; //-------------------------------------------Phase 1: Filter Process-------------------------------------------output: optimal feature set Z; formula (1) from maximum to minimum; 1: Sort all features ∈ by ( ) in 1: //——————————————-Phase Filter Process——————————————– 2: Find the first features in to be added to initial data set ; 1: Sort all features f i P X by F p f i q in formula (1) from maximum to minimum; //-------------------------------------------Phase 2: Wrapper Process-----------------------------------------2: Find the first m features in X to be added to initial data set Y; 1: Calculate the classification accuracy by per feature and find out the optimal feature , = − //——————————————-Phase 2: Wrapper Process—————————————— , = + ; 1: 2:Calculate thenext classification accuracy per feature and findfor out optimalfeatures feature f i ,∪ ( ∈ To find the optimal feature to bebyadded to Z, calculate allthe candidate Y “ Y ´ f i ,Z “ Z ` f i ; = + ; 2: To),find=the − next, optimal feature to be added to Z, calculate for all candidate features 3:ZRepeat 2 until a termination is met. Y p f j Pstep Yq, Y “Y´ f j ,Z “ Z ` criterion fj; 3: Repeat step 2 until a termination criterion is met. A threshold α = 0.002 is set. When the obtained accuracy begins to decrease compared with the previous round of iteration, and the decrease amplitude is larger than α, the feature selection A threshold α this “ 0.002 set.remaining When the obtained begins to decrease process stops. In case,isthe features areaccuracy the optimal feature subset. compared with the previous round of iteration, and the decrease amplitude is larger than α, the feature selection process 5. The Experiment and features the Result stops. In this case, theDesign remaining areAnalysis the optimal feature subset. As an important preprocessing step in traffic classification, the feature selection method aims to 5. The Experiment Design and the Result Analysis select from the complete feature set, and thus to reduce the modeling time and the classification time under theimportant prerequisite condition of having effect on the accuracy of network trafficmethod classification. As an preprocessing step in little traffic classification, the feature selection aims to In order to prove the performance of FSMS, the designs of the experiment included two aspects: select from the complete feature set, and thus to reduce the modeling time and the classificationthe time effectiveness of feature selectionofand the efficiency of on feature selection.of network traffic classification. under the prerequisite condition having little effect the accuracy
Information 2016, 7, 6
6 of 11
In order to prove the performance of FSMS, the designs of the experiment included two aspects: the effectiveness of feature selection and the efficiency of feature selection. 5.1. The Setup of Experimental Environment and Dataset The experimental platform cluster consisted of a control node and four computational nodes. All of the nodes had the same configuration, including dual-core CPU (frequency: 3.2 GHz), 4 G Memory and 500 G Hard Disk Drive. The control node and the computational nodes were interconnected by a Gigabit Ethernet switch. Hadoop-2.5.0 and Spark-1.2.1 was installed in the cluster. The data set used in the experiment was the Moore data set [21], which consists of eight kinds of traffic classes, and each flow included 249 feature attributes. The Moore data set is a classic network traffic trace, which has been used widely in the discussions and experiments. It has a structure similar to the newest trace and the most extensive representation. Table 1. The detail of Moore data set. Class
Application Type
Count
WWW MAIL BULK SERVICES DATABASE P2P ATTACK MUITIMEDIA
http, https imap, pop2/3, smtp ftp-Control, ftp-Pasv, ftp-Data X11, dns, ident, ldap, ntp postgres, sqlnet oracle, ingres KaZaA, BitTorrent, GnuTella worm, virus Windows Media Player, Real
328,091 28,567 11,539 2099 2648 2094 1793 1152
In order to deal with different experimental tests, the data sets with different scales are set up in the experiments, as shown in the tale below. Table 2. The data set scales used in the experiments. Dataset
Data1
Data2
Data3
Data4
Data5
Data6
Instances count
24,000
192,000
288,000
384,000
480,000
576,000
Among them, Data1 is the raw data set as shown in Table 1. scaling-up edition.
Table 2 shows the other
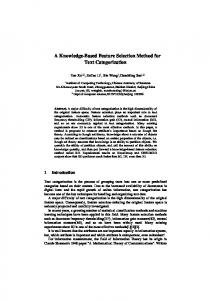
5.2. The Feature Selection Effectiveness 5.2.1. The Classification Accuracy In this experiment, firstly, all 249 features from the complete feature set were directly used for the traffic classification. Secondly, the optimal feature subset obtained by FSMS was used for the traffic classification. Throughout the comparison between the two sets, the effect of FSMS on the classification accuracy was verified. Note that Data1 and RandomTree Algorithm were used in the experiment. As shown in Figure 2, if the optimal feature subset including 16 features was selected by FSMS, then the optimal accuracy was basically achieved. With the selected features increasing, the accuracy remained mostly unchanged and inclined to the one obtained by the complete feature set. It can be seen that FSMS can also guarantee its classification accuracy when fewer features are selected. The validity of this method is thus proved.
Information 2016, 7, 6 Information 2016, 2016, 7, 7, 66 Information
7 of 11
of 11 11 77 of
Figure 2. Accuracy comparison. Figure 2. 2. Accuracy Accuracy comparison. comparison. Figure
5.2.2. The Amount ofofClassification 5.2.2. The Amount ClassificationComputation Computation 5.2.2. The Amount of Classification Computation The comparison of the time consumed by the network traffic classifications of complete The comparison of the the time time consumed byrespective the respective respective network traffic classifications classifications of The comparison of consumed by the network traffic of feature set and optimal feature set was made. The compared items including the time parameters complete feature feature set set and and optimal optimal feature feature set set was was made. made. The The compared compared items items including including the the time time complete were acquiredwere by the Sparkby algorithm algorithm in the modeling and classification process. parameters were acquired byRandomTree the Spark Spark RandomTree RandomTree algorithm in the the modeling modeling and classification classification parameters acquired the in and process. This experiment used Data 6. This experiment used Data 6. process. This experiment used Data 6. The completefeature feature set set was was the the raw data that hashas notnot yet yet processed by FSMS, FSMS, including 249 The complete was theraw rawdata datathat that processed by FSMS, including The complete feature set has not yet processed by including 249 features inintotal. total. The optimal feature subset was sixteen-dimensional feature setset filtered by by FSMS. 249features featuresin total.The The optimal feature subset was a sixteen-dimensional feature filtered FSMS. optimal feature subset was aa sixteen-dimensional feature set filtered by FSMS. The parameterswere wereexpressed expressed this this way, total: time forfor modeling; findSplitsBins: to partition partition the raw rawthe The parameters thisway, way,total: total:time time modeling; findSplitsBins: to partition The parameters were expressed for modeling; findSplitsBins: to the data into buckets according to the the feature dimension; findBestSplits: to determine determine the best bestthe split point data into buckets according to dimension; findBestSplits: to the split point raw data into buckets according to feature the feature dimension; findBestSplits: to determine best split quickly for each node during the training period in each layer of the decision tree; chooseSplits: time quickly for each nodenode during the training period in each the decision tree; chooseSplits: time point quickly for each during the training period inlayer eachof layer of the decision tree; chooseSplits: forfor classification. for classification. time classification. As shown shown in Figure Figure 3, 3, when when the the feature feature set set processed processed by by FSMS FSMS was classified, classified, the consumed consumed AsAs shown ininFigure 3, when the feature set processed by FSMSwas was classified,the the consumed time for for each each indicator indicator was was much much less less than than that that for for adopting adopting the the complete complete feature feature set set directly. directly. The The time time for each indicator was much less than that for adopting the complete feature set directly. experiment proves that, as an important preprocessing step in traffic classification, FSMS can experiment proves that, as as ananimportant preprocessing step in in traffic FSMS can The experiment proves that, important preprocessing step trafficclassification, classification, FSMS can significantly reduce the amount of computation of network traffic classification. significantly reduce theamount amountofofcomputation computation of of network network traffic significantly reduce the traffic classification. classification. 16 16 14 14
time(s) time(s)
12 12 10 10 88 66 44 22 00 total total
findSplitsBins findBestSplits findBestSplits chooseSplits chooseSplits findSplitsBins
complete feature feature set set complete
optimal feature feature set set optimal
Figure for modeling modelingand andclassification. classification. Figure3.3. 3.The Thecomparison comparison of of the the time time for for Figure The comparison of the time modeling and classification.
Information 2016, 7, 67, 6 Information 2016, Information 2016, 7, 6
8 of 8 of 11 11 8 of 11
5.3. The Efficiency of Feature Selection Efficiency FeatureSelection Selection 5.3.5.3. TheThe Efficiency of of Feature 5.3.1. The Velocity of Feature Selection 5.3.1. The Velocity FeatureSelection Selection 5.3.1. The Velocity ofof Feature In order to demonstrate the performance of FSMS in the aspect of feature selection velocity, the ordertotodemonstrate demonstrate the the performance ofofFSMS in in thethe aspect of feature selection velocity, the In In order performance FSMS aspect of feature selection velocity, velocity of FSMS was compared with that of FSMM (feature selection method based on MapReduce). velocity of FSMS was compared with that of FSMM (feature selection method based on MapReduce). theFSMM velocity of FSMS was compared that of FSMM (feature selection Both method basedhave on MapReduce). was implemented by the with MapReduce computing framework. of them the same FSMM was implemented by the MapReduce computing framework. Both of them have the same FSMM was implemented by the MapReduce computing framework. Both of them have the the same computing procedure and adopt the same classification algorithm. Figures 4 and 5 show computing procedure and adopt the same classification algorithm. Figures 4 and 5 show the computing procedure and adopt classification Figures 5 DATA1 show the comparison of time that both FSMSthe andsame FSMM take to selectalgorithm. the features from 1 to416and when comparison of time that both FSMS and FSMM take to select the features from 1 to 16 when DATA1 and DATA6 used. comparison of are time that both FSMS and FSMM take to select the features from 1 to 16 when DATA1 and DATA6 are used. and DATA6 are used.
Figure4.4.The The single node node processes Figure processesDatal. Datal. Figure 4. Thesingle single node processes Datal.
Figure process Data6. Data6. Figure5.5.Four Four nodes nodes process Figure 5. Four nodes process Data6.
According Figures 4 and 5, under same computing node, the feature selection for According to to Figures 4 and 5 under the the same computing node, the feature selection timetime for FSMS According to Figures 4 and 5, under the same computing node, the feature selection time for FSMS is obviously less than that for FSMM. Moreover, with the selected feature increasing, FSMS has is obviously less than that for FSMM. Moreover, with the selected feature increasing, FSMS has more FSMS is obviously less than that for FSMM. Moreover, with the selected feature increasing, FSMS has more remarkable advantages. Thereason main reason thatSpark the Spark computing framework used FSMS remarkable advantages. The main is thatis computing framework used byby FSMS can more remarkable advantages. The main reason isthe that the Spark computing framework used by FSMS can data cacheinto data into memory. Atiteration, each iteration, data is directly transferred from memory, which cache memory. At each data is directly transferred from memory, which avoids can cache data into memory. At each iteration, data is directly transferred from memory, which avoidsdisk frequent I/O operations and greatly improves the iteration efficiency. frequent I/O disk operations and greatly improves the iteration efficiency. avoids frequent disk I/O operations and greatly improves the iteration efficiency. 5.3.2. The Parallel ComputingEffectiveness Effectiveness 5.3.2. The Parallel Computing 5.3.2. The Parallel Computing Effectiveness Figure 6 shows thetime time consumedby by the selection selection of 10 the case of of different Figure 6 shows the 10 features featuresby byFSMS FSMSin the case different Figure 6 shows the timeconsumed consumed bythe the selection of of 10 features by FSMS ininthe case of different computing nodes when Data1 to Data6 are used respectively. When Data1 is used, the consumed computing nodes when Data1 to Data6 areare used respectively. When Data1 is used, thethe consumed time computing nodes when Data1 to Data6 used respectively. When Data1 is used, consumed time is shown as: single node < dual nodes < four nodes.The Thereason reasonisis that, that, when the amount ofof data is shown as: single node < dual nodes < four nodes. when the amount data time is shown as: single node < dual nodes < four nodes. The reason is that, when the amount of data is small, the computing advantages offered by the increasingly number of nodes are not enough to is small, thethe computing numberofofnodes nodesare arenot notenough enough is small, computingadvantages advantagesoffered offered by by the the increasingly increasingly number to to compensate the time consumed by the multiple node task schedules. However, with the constant
Information 2016, 7, 6 Information 2016, 7, 6 Information 2016, 7, 6
9 of 11
9 of 11 9 of 11
compensatethe thetime timeconsumed consumed by by the the multiple multiple node node task However, with the constant compensate task schedules. schedules. However, with thecomputing constant increase of data scale, the computing advantages of multiple nodes are shown. The more increase of data scale, the computing advantages of multiple nodes are shown. The more computing increase of data the computing advantages of multiple are shown. TheThe more computing nodes there are, scale, the gentler the increased amplitude of thenodes consumed time is. running time nodes there are, the gentler the increased amplitude of the consumed time is. The running time for nodes there are, the gentler the increased amplitude of the consumed time is. The running time for forsingle singlenode nodeincreases increases evidently when Data6 is used. is to due thethat factthe thatsingle the single node evidently when Data6 is used. ThisThis is due thetofact node has single node increases evidently when Data6 is used. This is due to the fact that the single node has haslimited limitedmemory. memory.When When the amount data toolarge, large,the theintermediate intermediate results data and the amount of of data is is too results of of allall data and limited memory. When the in amount of by data is tooThe large, the intermediate results of be alltransferred data and operations cannot be cached memory Spark. data, not being cacheable, will operations cannot be cached in memory by Spark. The data, not being cacheable, will be transferred operations cannot be cached in memory by Spark.and Thedata data, not being cacheable, will be transferred into local storage. storage call increases substantially. into local storage.Thus, Thus,the thetime time for for data data storage and data call increases substantially. into local storage. Thus, the time for data storage and data call increases substantially.
Figure effectiveness. Figure6.6.The Theparallel parallel computing computing effectiveness. Figure 6. The parallel computing effectiveness.
order to measure the effectiveness of FSMS parallel computation more accurately, the In In order to measure the effectiveness of FSMS parallel computation more accurately, the speedup speedup can be an indicator introduced into this paper. The speedup means that the running time isby to measure theinto effectiveness of FSMS parallel moretime accurately, can beInanorder indicator introduced this paper. The speedup meanscomputation that the running is reducedthe reduced by the parallel computation to improve the performance obtained. The computing formula speedup be an indicator introduced into this paper. The speedup means that the running isp , the parallelcan computation to improve the performance obtained. The computing formula is: S “time Ts {T ⁄ is: = , where is the time consumed by the single node computation, is the time reduced by the parallel computation to improve the performance obtained. The computing formula where Ts is the time consumed by the single node computation, Tp is the time consumed by computing, the number of nodes . The thetime speedup is, the by less the time ⁄ by, computing, is:consumed =number where time consumed byisthe single computation, isthe the time and the of nodes isisand p.the The higher the speedup is, thehigher lessnode the consumed parallel consumed by the parallel computation is, and the more highly the parallel efficiency and the consumed byis,computing, andhighly the number of nodes is . The higher the speedup improve. is, the lessThe the given time computation and the more the parallel efficiency and the performance performance improve. The given data sets are from Data1 to Data6, and the number of computing consumed theData1 parallel computation is, and the more highly theincludes parallelone efficiency andnodes the data sets are by from to Data6, and the number of computing nodes node, two nodes includes one node, two nodes and are fourfrom nodes. Figure 7 describes thenumber performance of the performance improve. The given data sets Data1 to Data6, and the of computing and four nodes. Figure 7 describes the performance of the speedup of FSMS based on Spark under speedup of FSMS on Spark under different data scales. When the amount data is small, the nodes includes onebased node, nodes and four is nodes. 7 describes the of performance the1, different data scales. Whentwo the amount of data small,Figure the speedup of multi-nodes is less of than speedup of multi-nodes is less than 1, and the cluster computing does not show any advantage. speedup of FSMS based on Spark under different data scales. When the amount of data is small, the and the cluster computing does not show any advantage. However, as the amount of data increases, However, as the amount of data increases, the speedup of multi-nodes increases steadily, and the speedup of multi-nodes is less than 1, and the cluster computing does not show any advantage. thehigher speedup multi-nodes increases the higher the number of nodes is, the the of number of nodes is, the steadily, faster theand amplitude increases. The result shows that,faster whenthe However, as the amount of data increases, the speedup of multi-nodes increases steadily, and the amplitude increases. shows that, when processing data with different quantity degree, processing the dataThe withresult different quantity degree, FSMS canthe enhance the processing efficiency by higher the number of nodes is, the faster the amplitude increases. The result shows that, when FSMS can enhance the processing increasing decreasing theextended. size of clusters, which has increasing or decreasing the size efficiency of clusters,by which has theorcapability to be processing the with different quantity degree, FSMS can enhance the processing efficiency by the capability todata be extended. increasing or decreasing the size of clusters, which has the capability to be extended.
Figure 7. Speedup.
Figure Speedup. Figure 7. 7. Speedup.
Information 2016, 7, 6
10 of 11
6. Conclusions In this paper, we proposed a feature selection method for network traffic based on Spark (FSMS). In our proposal, the data is preprocessed firstly by the Fisher score, and the feature set with the best classification ability is then selected by the Spark computing framework along with continuous iterations. The implementation shows that this method serving as an important preprocessing step in traffic classification can greatly reduce the modeling and classification time for the classifier under the prerequisite condition of having no effect on the accuracy of traffic classification. In addition, due to the combination with the advantages of the Spark computing framework in the complicated iterative calculation, compared to the traditional feature selection method base on MapReduce, FSMS achieves a great performance improvement in the velocity of feature selection. Based on the Spark platform, future research will ideally discover a parallel network traffic classification method that can be combined with the feature selection method mentioned in this paper to implement highly effective and fast classification of network traffic. Acknowledgements: This work was supported by the National Natural Science Foundation of China (61163058 and 61363006), Key Laboratory of Cognitive Radio and Information Processing, Guangxi Key Laboratory of Trusted Software (No. KX201306), and Guangxi Colleges and Universities Key Laboratory of Cloud Computing and Complex Systems (No. 14104). Author Contributions: The work presented here was a collaboration between all of the authors. All authors contributed to designing the methods and experiments. Wenlong Ke performed the experiments. Yong Wang and Xiaoling Tao analyzed the data and interpreted the results. Yong Wang and Xiaoling Tao wrote the paper. All authors have read and approved the final manuscript. Conflicts of Interest: The authors declare no conflict of interest.
References 1. 2. 3. 4. 5.
6.
7.
8. 9. 10.
11.
Soysal, M.; Schmidt, E.G. Machine learning algorithms for accurate flow-based network traffic classification: Evaluation and comparison. Perform. Eval. 2010, 67, 451–467. [CrossRef] Fahad, A.; Tari, Z.; Khalil, I.; Habib, I.; Alnuweiri, H. Toward an efficient and scalable feature selection approach for internet traffic classification. Comput. Netw. 2013, 57, 2040–2057. [CrossRef] Crone, S.F.; Kourentzes, N. Feature selection for time series prediction—A combined filter and wrapper approach for neural networks. Neurocomputing 2010, 73, 1923–1936. [CrossRef] De Donato, W.; Pescapé, A.; Dainotti, A. Traffic Identification Engine: An Open Platform for Traffic Classification. IEEE Netw. 2014, 28, 56–64. Xu, M.; Zhu, W.; Xu, J.; Zheng, N. Towards Selecting Optimal Features for Flow Statistical Based Network Traffic Classification. In Proceedings of the 17th Asia-Pacific Network Operations and Management Symposium (APNOMS), Busan, Korea, 19–21 August 2015; pp. 479–482. Dainotti, A.; Pescapé, A.; Sansone, C. Early Classification of Network Traffic through Multi-classification. In Traffic Monitoring and Analysis; Domingo-Pascual, J., Shavitt, Y., Eds.; Springer: Berlin/Heidelberg, Germany, 2011; pp. 122–135. Jing, R.; Zhang, C. A Novel Feature Selection Method for the Conditional Information Entropy Model. In Proceedings of the 3rd International Conference on Artificial Intelligence and Computational Intelligence(AICI 2011), Taiyuan, China, 24–25 September 2011; pp. 598–605. Wang, Y. Fisher scoring: An interpolation family and its Monte Carlo implementations. Computational Stat. Data Anal. 2010, 54, 1744–1755. [CrossRef] Wang, P.; Sanin, C.; Szczerbicki, E. Prediction based on Integration of Decisional DNA and a Feature Selection Algorithm relief-F. Cybern. Syst. 2013, 44, 173–183. [CrossRef] Rodrigues, D.; Pereira, L.A.M.; Nakamura, R.Y.M.; Costa, K.A.P.; Yang, X.S.; Souza, A.N.; Papa, J.P. A wrapper approach for feature selection based on bat algorithm and optimum-path forest. Expert Syst. Appl. 2014, 41, 2250–2258. [CrossRef] Chuang, L.-Y.; Yang, C.-H.; Li, J.C.; Yang, C.-H. A hybrid BPSO-CGA approach for gene selection and classification of microarray data. J. Comput. Biol. 2012, 19, 68–82. [CrossRef] [PubMed]
Information 2016, 7, 6
12. 13. 14.
15. 16. 17. 18. 19. 20. 21.
11 of 11
Peng, Y.H.; Wu, Z.Q.; Jiang, J.M. A novel feature selection approach for biomedical data classification. J. Biomed. Inform. 2010, 43, 15–23. [CrossRef] [PubMed] Dainotti, A.; Pescapé, A.; Claffy, K.C. Issues and Future Directions in Traffic Classification. IEEE J. Mag. 2012, 25, 35–40. [CrossRef] Szabó, G.; Veres, A.; Malomsoky, S.; Gódor, I.; Molnár, S. Traffic Classification over Gbit Speed with Commodity Hardware. IEEE J. Commun. Softw. Syst. 2010, 5. Available online: http://hsnlab.tmit.bme.hu/ molnar/files/jcss2010.pdf (accessed on 15 February 2016). Sun, Z.Q.; Li, Z. Data intensive parallel feature selection method study. In Proceedings of 2014 International Joint Conference on Neural Networks (IJCNN), Beijing, China, 6–11 July 2014; pp. 2256–2262. Li, J.Z.; Meng, X.R.; Wen, J. An improved method of SVM-BPSO feature selection based on cloud model. IAES Telkomnika Indones. J. Electr. Eng. 2014, 12, 3979–3986. [CrossRef] Long, Y. Network Traffic Classification Method Research Based on Cloud Computing and Ensemble Learning. Ph.D. Thesis, Guilin University of Electronic Technology, Guilin, China, June 2015. Srirama, S.N.; Batrashev, O.; Jakovits, P.; Vainikko, E. Scalability of parallel scientific applications on the cloud. Sci. Program. 2011, 19, 91–105. [CrossRef] Srirama, S.N.; Jakovits, P.; Vainikko, E. Adapting scientific computing problems to clouds using MapReduce. Future Gener. Comput. Syst. 2012, 28, 184–192. [CrossRef] Apache Spark. Available online: http://spark.apache.org (accessed on 14 February 2016). Moore, A.; Zuev, D. Discriminators for Use in Flow-based Classification; Queen Mary and Westfield College: London, UK, 2005; pp. 1–13. © 2016 by the authors; licensee MDPI, Basel, Switzerland. This article is an open access article distributed under the terms and conditions of the Creative Commons by Attribution (CC-BY) license (http://creativecommons.org/licenses/by/4.0/).