SEVENTEENTH NA 1IONAL RADIO SCIENCE CONFERENCE
Feb. 22-24, 2000, Migrrfya Uiriversity ,Egypt.
A FINGERPRINT CLASSIFICATION TECHNIQUE USING MULTILAYER SOM Wafaa M. Swash* and Fatma Abou-Chadi** Department of Electronics and CommunicationsEngineering Faculty of Engineering, Mansoura University
ABSTRACT This paper presents an automatic fingerprint classification technique similar to that reported in [l] but, an inverse filtering technique was introduced to restore the distorted parts of the images priortothefeature extraction stage. The results have shown that introducing the inverse filtering stage has improved the percentage of correct classification. Typical classification accuracy reaches 91% with no rejects, 98% with 8.1% rejects compared to the "687 with no rejects, 95% with 9.4% rejects obtained using the previously reported technique.
KEY WORDS Fingerprint classification, Image processing, Neural networks classifiers,Biometrics.
I. INTRODUCTION ingerprints have been used for personal identification for a long time. Each fingerprint is a map of ridges and valleys in the epidermis layer of the slun, which forms unique geometric patterns. The ridge endings and bifurcation are called minutiae and these minutiae have a unique and permanent pattern for each person even
F
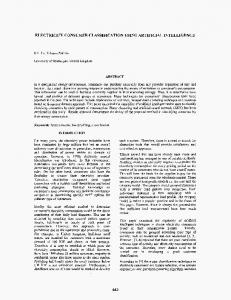
twins [2]. Henry [3] examined the global structure of fingerprints and devised a classificationmethod for partitioning the large fingerprint database into five basic classes. These five classes are right loop, left loop, whorl, arch and tented arch. Examples of these classes are shown in Figure 1. Even today, most identification applications perform initial partitioning according to Henry classification prior to obtain an exact matching.
In accordance with the U. S Federal Bureau of Investigation (FBI) representation of fingerprints ridge endmgs and bifurcation (Figure 2) are taken as the distinctive feature of the fingerprints, whereas the coordinates and the angle of the features are used to represent the fingerprint in the matching process. In addition to these minutiae, fingerprints contain two special kinds of feature called core and delta points (Figure 3). These points are often referenced to as sin-ty points of fingerprint. The core point is generally used as a reference point for coding minutiae and is defined as topmost point on the inner most recurving ridge [lo]. In many cases there is a need to idenm a person through his fingerprint, a clear example of this case arises in police agencies when it has to iden@ a person through a latent fingerprint found on a crime scene. As the size of fingerprint databases increase, it becomes very difficult or impossible to doclassification manually and the use of an automatic fingerprint identificationsystem (AFIS)becomes necessary. Most M I S today have the basic structure shown in Figure 4. Recently, Halaci and Ongun [11 have reported a fingerprint classification using a multilayer self-organizing feature map (SOM). However, it has been found that the *Scholarship student, Dept. of Electronics and CommunicationsEngineering, Faculty of Engineering, Mansoura University, Egypt, (e-mail:
[email protected]). **Professor, Dept. of Electronics and CommunicationsEngineering, Faculty of Engineering, Mansoura University. Egypt, (e-mail:
[email protected]).
SEVENTEENTII NATIONAL RADIO SCIENCE CONFERENCE
Feb. 22-24, 2000, Miiiirfi3,a University , Egypt. proposed system classification accuracy reaches ?4&7 with no rejects and 95% with 9.4% rejects. This is due to the. fact that fingerprint images may have distorted regions. In thls paper, a pre-processing stage (section 11) has been adopted to enhance the image prior to the feature extraction and reduction stage (section III). The effect on the performance of the classifier was studied (section IV) and the results were compared with those obtained from the mulhlayer SOM classifier without pre-processing (section V).
II. FINGERPRINT IMAGE PRE-PROCESSING (INVERSE FILTERING) Assume that the degraded picture isg(x,y) and the original picture is f(x,y) then, the Fourier transforms (if csist) of g(x,y),f(x..v), and the PSF (point spread function of degradation) h(x,y) satisfy G(u,v) = H(u,v) F(u,v) (1) or equivalently, F(u,V ) =G (u,v)/H(u,v) (2)
This implies that if H(u,v) is known, we can restore F(x,y) by multiplying the Fourier transform G(x,yj of the degraded image by I/H(u,v) and then inversing Fourier transforms. In other words, the filter transfer function 1s
There is considerable arbitrariness in thc selection of M(u,v), a rectangular scanning aperture was chosen as in [51
x v
h ( x , y ) = rect (-, 2) a P
(4)
H(u,v) =a@Sinc(au) Sinc(pV)
(3 1
or.
where, a ,p are chosen constants. In many cases the magtutude of H(u,v) drops rapidly with Qslance from the origin in the uv-plane. To avoid very high or infinite values Eq.(3) can be rewritten as:
M (u,v) =
{
1 /H(u,v)
i f H ( i c , v)
1 ifireshold
$H(u,v)
‘fireshold < Threshold
2
(6)
wherc, Threshold IS a chosen threshold. One way to avoid arbitrariness in inverse filter is to find a restorahon
f(X, y ) of the picture,fix,y) mmimizing
some &fference between f ( x, y ) and f(x,v). l k s can be done by applying least square filtering [6], which minimizes the least Square error between the onginal picture and the degraded one. This is attained by using [6]. r51
SE VENTE'ENTII N A T'IONAI: RAD1
CE CONfiEItENCE
Feb. 22-24, 2000, Mirtiifiya University , Egypt.
Where the noise to signal power density ratio and it is apprcjximatedby a suitable constapt. The value of this constant evidently reflects some a prior knowledge about the relative magnitudes of signal and noise power in the picture. Figure 5 shows the results obtained from the application of least square filter to a fingerprint image.
IU. FEATURE VECTOR GENERATION FOR CLASSIFICATION ' I b s step is a very important step when neural networks are used for classification.The block directional image as a feature vector was chosen in 171 and a comparison between three methods used in block dxectional feature vector generation was reported, The three methods are the Fast Fourier Transform (FFT), Gabor filter and ridgevalley filter. It was found that FFT and Gabor features take longer computationtime and produce inferior results than the ridge-valley filter method so, the ridge-vallcy filter method was chosen.
Ridge-Valley Filter The mask shown in Figure 6 was applied to each pixel on the image. There are eight slits on the mask, each of which is shown in figure with dfferent slit numbers assigned to gnds. A slit sum s, for i =1,2,. . .,8 is defined as the summation of the intensity values of the pixels having the same slit number i while S is the intensity value of center point C. M e r computingthese parameters, the pixel C is assigned a direction according to the follovring:
3 x
direction(s,,)
if 4S+ s,, + s,,, > - c s r
(direction(s,,,)
otherwise
direction(C) =
8
1-1
A direction image is obtained by moving the mask and applymg the algorithm. Thus every image pixel has a direction quantized to one of the eight angles, which varies from zero to 180" with 22.5" steps. This process produces 256 x 256 element as the input image. To obtain much smaller grid of directions, spaced every 16 pixel. the pixel drrections are averaged over 16 X 16 pixel squares. Averaginghas a smoothmg effect and produces a finer quantization of directions. The averaging process doesn't produced by s m m g pixels direction over each grid and divide the sum by 16 x 16, instead as we have ridge angel 8 and pixel direction vector (cos20, sin 28)then, this vector direction is averaged over each grid. Figure 7 shows an example of ridge-valley filter. The last remaimg step is to do core point exarachon to find the singularity point and align the resulting directional feature vector according it. An algorithm that uses block directional map to find the core by comparing the slopes of block directions is provided in [71.[ 1J. The raw fingerprint image is assumed to contain 256 x 256 %bit pmel of data.After directional image and feature vector generation this number reduced to 16x 16 feature Ths number is still hgh for classrt?cation. There are many problems which anses in attempt to perform pattem recogrubon in hgh dmensional spaces and there IS a potentd improvements which can be achieved by first niappmg the data intoaspaceoflower dimensionality This can be done by using Karhunen-Loeve transformationor principal component analysis. This procedure re11 enhrely on the mput data itsclf without reference to the correspondmgtarget data.
The Karhunen-Lowe (K-L) transform r i d s the representauonof the input vector in terms of the eigenvectors of their covariance matrix It has an excellent energy compaction property, therefore it is frequently used in statistical pattern recognition 181
I
j
SEVENTEENTH NATIONAL RADIO SCIENCE CONFERENCE
Feb. 22-24, 2000, Miiirrfyu University ,Egypt.
IV. FINGERPRINTS CLASSIFICATIONUSING MULTILAYER (SOM) NEURAL NET Using the SOM as a classification method in computer vision is a promising approach, because the learning is unsupervised; no preclassified image data are needed at all [9].
IV.l Network Topology and Operation of Original SOM The SOM is a special neural network that accepts ndmensional input vectors andmapsthemtoalower dimensional, usually 2-D, output plane. The topology for a typical SOM network is shown in Figure 8. It has n input nodes and m by m output nodes. Each output node] in the SOM network has a connection from each input node I , where w!,being the connection weight between them [lo], [ll], [12]. There are two phases of operation in SOM the training phase and the classfication phase. Classification is fairly simple after the training phase has been completed successfully. The network finds an output node such that the Euclidean distance between the current input vector and the weight set connecting the input nodes to this output node is the minimum. This node is called the winner and weights of the neighboring output nodes of the winner are updated so that the new weight set is closer to the current input vector. This procedure is applied repeatedly for all input vectors until weights are stabilized. The choice of the neighborhood function, the learning rate and the termination criteria are all problem dependent. The training steps of the origrnal SOM are as follows: 1) assign small random values to weights w!, ; 2) chose a vector x from the sample space and apply it as input; 3) find the winning output nocle d,, by the following criterion:
d,, = min I
n-1
CC(x, ( t )-
W,(t))’
I
(9)
1=0
where wi, ( t ) is the weight from input node i to the output nodej at time t; 4) adjust the weight vectors according to the following update formula:
where w!, is the ith component of the weight vector w, ,~(2)is the learning rate and N(i, t) is the neighborhood b c t i o n (selection criteria); 5 ) repeat steps 2)-4) until no sigruficant changes occur in the weights.
IV.2 MULTILAYER SOM Due to the self-organizing characteristics of the SOM network, the classes represented by some of the neurons may become more crowded with fingerphts as compared to other classes. Increasing the number of classes by enlarpg the SOM network solves the problem to some degree, but after a certain network size the number of nonempty classes become empty while some others are still too crowded. Instead of enlarging the SOM size within the layer, adding one more level for those crowded classes (Figure 9), will help further divide those crowded classes[ 11. Each additional SOM network in the second SOM layer is tcained only by those samples in the class represented by the related SOM neuron in the previous layer. If some classes in the second layer are still too crowded, the process can be repeated for several layers in the same manner. Once the system is trained, a new entry to be classified is applied as input to the first layer and the winner is determined. If the winner of the first layer is attached a second layer SOM network, then it triggers the related network in the second layer while the same input vector is applied and the winner within the related second layer network is determined. If this winner is still connected another layer of network, the classification process continues in the same manner until the winner is no longer connected to a further 1ayer.Eachfingerprint in the database is assigned a hierarchical class number including the related neuron at each layer.
SEVENTEENTII NA TIONAL RADIO SCIENCE CONFERENCE
Feb. 22-24, 2000, Miiiirfiya University ,Egj’yt. I”
V. EXPERIMENTAL RESULTS The fingerprint database used in the experiments was obtained from the U.S National Institute of Staqdardsand Technology [131. Twenty-three images were used for training. These are representing the basic five classes. To increase the database, Werent types of noise were added at different levels of signal-to-noise ratios. These types of noise are: Gaussian and salt & pepper noise [SI. Different levels of noise were added to the origmal fingerprint images to obtain signal-to-noise ratios that vary from 4 to 2 dB. Fm-one different images were obtained by this procedure. The fiffy-one images were used in classification Two layers SOM was utilized. The fust layer separates the input images into four classes. These classes are: 1) whorl loop, 2) left loop, 3) right loop and 4) arch and tented arch are considered as on class. The second layer is used for personal identification. The results obtained show that the percentage of correct classrfication has been improved. Typical correct classification accuracy reaches 91% with no rejects, 98% with 8.1% rejects compared to those obtained by Halaci and Ongun [11. They report a typical correct classification accuracy of %87 with no rejects, 95% with 9.4%rejects without the preprocessing procedure.
VI. CONCLUSION Automatic fingerprints identificationand classification systems are the most widely and accepted identification technique. Using an inverse filtering technique to restore the distorted areas in the fingerprint images combined with a multilayer selfdrganized feature map neural network. Typical correct classification accuracy is 91% with no rejects, 98% with 8.1% rejects. This results in a better recognition percentage compared to those obtained using the technique reported in [l] without a preprocessing procedure. The technique shows promise and the finding can be considered as a guide for further studies.
REFERENCES [l] G. Ongun and U. Halici, “Fingerprint classification through self-organizing Feature map modified to treat uncertainty”, Proc.Ofthe IEEE vo1.84, no lO,pp.1497-1512,0ct. 1996. [2] F. Galton, “FingerPnnts”, New York: Macmillan, 1892, quoted from G. Ongun and U. Halici, “Fingerprint classification through self-organizing Feature map modified to treat uncertainty”, Proc.Ofthe BEE vo1.84, no 10,pp.1497-1512,Oct. 19%. [3] E. R. Henrry,”Classificationand use of finger prints”, London: Routledge, 1900, quoted from G. Ongun and U. Halici, “Fingerprint classification through self-organizing Feature map modified to treat uncertainty”, Proc. Ofthe IEEE vo1.84, no lO,pp.1497-1512,0ct. 1996. [4] V.S Sinvasan and N. N. Murthy, “Detection of singulanty points in fingerprint images”, Pattern Recognition, vol. 25,pp 139-153,1992. [5]Anil K. Jain, Fundamentalsof digital image processing: Prentice Hall Inc, 1989, chapter 8. [6] h e 1 Rosenfeld, Avinash C.Kak, Digital picture processing: Academic press 1982, chapter 7. [7] G. L. Wilson, ”Massively parallel neural network fingerprint classificationsystem”, NIST Tech. Rep. Image Processing Group 1993. [SI Christopher M. Bishop, Neural network for pattern recognition: Clarendon press-oxford, 1995, chapter 8. [9]Teuvo Kohonen, Erikk Oja, Olli Simula, Ari Visa and Jari Kangas ,“Engineering applications of the selforganizing map”, Proc.Ofthe IEEE vo1.84, no lO,pp.l358-1384,Oct. 1996. [lo] Teuvo Kohonen, “Self-organization and associative memory”, 3d ed.Berlin:Springer series in Inform. Sci., 1989. (111 Teuvo Kohonen, “The self-organizing map”, Proc. IEEE, vo1.78, no.9, Sept. 1990. [121 Richard P. Lippmann, “An introduction to computing with neural nets”, IEEE ASSP Magazine, April 1987. [ 13J National Institute of standards and Technology, http://www.nist.gov/srd/fing_img.htm.
SEVENl'EENTiI NAlIONAL RADIO SCIENCE CONFERENCE
Feb. 22-24, 2000, Miniifiyu University , Egjyit.
Fig.1. The five basic classes of fingerprint: a) Arch, b) Whorl, c) Tented arch, d) Left loop'and e>Right loop.
Fig.2. a) Ridge ending. B) Ridge bifurcation.
Fig.3. Singularity points on a fingerprint.
*--I
=al
FeWe
'
cbsdlicatlmEk@w
Lkrd-
Fig. 4 Block diagram of basic AFIS components
S E V E I W E E N I I I N.4 TIONAL RADIO SCIENCE CONFERENCE
Feb. 22-24, 2000, Minirjiya Uiiiversity ,Egypt.
b) Filtered image.
a) Original image. Fig. 5. Inverse filter output.
Fig.6. Ridge-Valley filtering mask.
Fig. 7. Ridge-Valley filter output a) The original input image, b) After the ridge valley filter, c) Ridge direction matrix.
SEVENIEENTII NAIIONAL RAVIO SCIENCE CONFERENCE
Feb. 22-24, 2000, MiririJiya Uitiversity ,Egypt. ;,*.
xl..
,;
,
..
wli
x2
xni d(m-1) X m+l d(m-1) X m+l
:
i dm
..................
j d2m
..................
Fig.8. Network topology of the SOM.
d(m-1) X m+l