Article
Evaluating Factors for Controlling Sediment Connectivity of Landslide Materials: A Flume Experiment Hefryan Sukma Kharismalatri 1,*, Yoshiharu Ishikawa 2, Takashi Gomi 1,3, Roy C. Sidle 1,4,5 and Katsushige Shiraki 3 Institute of Global Innovation Research, Tokyo University of Agriculture and Technology, Fuchu, Tokyo 183-8538, Japan;
[email protected] (T.G.);
[email protected] (R.C.S.) 2 Toa Grout Kogyo Co. Ltd., Yotsuya, Shinjuku-ku, Tokyo 160-0004, Japan;
[email protected] 3 Graduate School of Agriculture, Tokyo University of Agriculture and Technology, Fuchu, Tokyo 183-8509, Japan;
[email protected] 4 Sustainability Research Centre, University of the Sunshine Coast, Sippy Downs, Queensland 4556, Australia 5 Mountain Societies Research Institute, University of Central Asia, Bishkek 720001, Kyrgyzstan * Correspondence:
[email protected]; Tel.: +81-42-367-5646 1
Received: 06 November 2018; Accepted: 19 December 2018; Published: 21 December 2018
Abstract: Connectivity of landslide sediment to and within fluvial systems is a key factor affecting the extent of mobilization of hillslope material. In particular, the formation of landslide dams and the transformation into landslide-induced debris flows represent “end members” of landslide sediment mobility. To quantify sediment connectivity, we developed a two-segment flume representing tributary inflow and the main channel. Mobility of sediment was examined by combinations of various topographic factors, such as tributary inflow angle (0 to 90° in 30° increments) and main channel gradient (10° and 15°), as well as water content of sediment (0 to 100% in 20% increments). We also examined differences of mobility among sediments derived from various lithologies (sand and shale, pyroclastic sediment, weathered granite, and weathered sedimentary rock). Mobility of sediment differed, depending on the water content of sediment, particularly less than saturation or greater than saturation. When all types of unsaturated landslide sediments entered the channel at inflow angles of 60° and 90°, substantial deposition occurred, suggesting the formation of landslide dams. At low inflow angles (0° and 30°) in a steep channel (15°), >50% of landslide sediment was transported downstream, indicating the occurrence of a debris flow. The amount of sediment deposited at the junction angle was greater for pyroclastic sediment followed by weathered granite, weathered sedimentary rock, and finally, sand and shale. Our connectivity index suggests that a threshold exists between landslide dam formation and debris flow occurrence associated with topographic conditions, water content, and types of sediment. Keywords: debris flow; landslide dam; flume experiment; hydrogeomorphic conditions; connectivity
1. Introduction Sediment connectivity is defined as the linkage and transfer of sediment from sources to deposits within a catchment system, via sediment detachment and transport [1]. Sediment connectivity implies how sediment can mobilize from one zone to another [2–4], which depends on the morphological characteristics of the system and the hydrological process [5]. The concept of connectivity has been applied to catchment hydrology, sediment transport, and soil erosion by water to understand the spatial and temporal variability of sediment dynamics [6,7]. For instance, Gomi et Water 2019, 11, 17; doi:10.3390/w11010017
www.mdpi.com/journal/water
Water 2019, 11, 17
2 of 20
al. [8] showed that sediment from hillslopes was directly transported to channels as bedload and suspended sediment due to its high mobility in headwater catchments affected by recent landslides. In contrast, Hiraoka et al. [9] observed a disconnection of sediment in the continuum from hillslopes to the catchment outlet due to temporary deposition within the channel bed. In general, when sediment remains near its source, there is a disconnection between sources and downstream reaches, while high connectivity between sources and downstream reaches occurs when sediment is highly mobilized. Mobility of landslide sediments varies, depending on topography, availability of water, and other factors, such as engineering properties and material weathering [10]. When the landslide sediments are less mobilized and poorly connected to downstream, most of the sediments remain at the foot of hillslopes or within the channel bed [11]. In this case, landslide dams are often formed when transported sediments are sufficient to block the channel, resulting in the inundation of the dam reservoir [12]. When landslide sediments closely connect to downstream, they often transform into debris flows that impact downstream environments due to the highly liquefied nature of these sediments [13]. Nevertheless, both landslide dams and landslide-induced debris flows are considered to be major sediment disasters around the world [14]. Various factors affect the mobility of debris flows and landslide dams, which alters the sediment connectivity of landslide sediments. In general, topographic factors such as volume of collapsed material, valley topography, inflow tributary junction angle, and channel gradient affect the mobility [10,15]. For instance, a study of 55 landslides in China showed that the mobility of landslide sediments increased with increases in landslide volume [16]. Landslide sediments tend to be less mobilized in narrow and V-shaped valleys in the Kansai, Kanto, Chubu, and Tohoku regions of Japan [17]. Benda and Cundy [15] revealed that the mobility of sediment increased when the inflow angle between landslides and receiving channels was 9°. Furthermore, sediment porosity, permeability, and grain size distribution control the mobility of landslide sediments based on investigations in Oregon and Colorado, USA [19]. Despite previous evidence of the differential mobility of landslide sediments, most of these studies only examined individual factors related to hydrogeomorphic conditions. To better understand sediment connectivity related to the mobility of landslide sediments, interactions among multiple factors need to be considered. For instance, a GIS investigation of deep-seated landslides in Kii Peninsula in 2011 revealed that the formation of landslide dams and occurrence of debris flows could be classified based on two criteria: a 60° inflow angle and 10° channel gradient [20]. Similarly, an investigation of 62 landslides in British Columbia, Canada, found that landslides with inflow angles 27° resulted in debris flows; additional factors influencing debris flow occurrence were initial failure volume and sediment stored within the channel prior to the occurrence of landslides [21]. Hence, quantitatively evaluating multiple factors and their possible combinations on landslide dam formation and debris flow occurrence is typically difficult in fieldbased investigations. Flume experiments can be effective to consider ranges in various factors influencing the movement of landslide sediments in simplified configurations [22]. Indeed, previous studies mentioned the effectiveness of flume experiments for sediment movement because they demonstrate the fluidization process of debris flows [23,24] and indicate blockage patterns [25]. Therefore, the objective of this study is to identify the key factors that control the mobility of sediment and the resultant sediment connectivity, such as landslide dam formation and the occurrence of debris flows, by a flume experiment. Findings of this study can be applied to assess the on-site and off-site risk of sediment disasters by landslides, landslide dam formation, and debris flows.
Water 2019, 11, 17
3 of 20
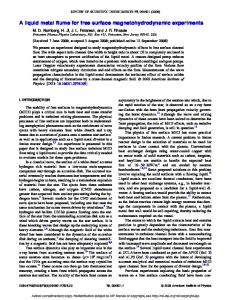
2. Methodology 2.1. Flume Experiment We constructed a flume (10 cm wide and 15 cm high) using 1-cm thick acrylic material, consisting of an inflow segment and main channel segment (Figure 1). The inflow segment represents the hillslope where the landslide occurs, while the main channel segment represents the channel in which the mobilized landslide sediment is conveyed (Figure 1a and 1b). The inflow segment was 50 cm long with a 45° gradient; on a 45° hillslope gradient, the resisting and driving forces of the weight of the sediment-water complex are equal. The main channel segment was 150 cm in length. A bucket was placed at the outlet of the main channel to capture transported sediment. We applied various channel gradients and inflow angles. Best [26,27] showed that inflow angles of 15-105° reflect the most common landslide entry conditions into channels; thus, we examined the mobility of sediment of four categories of inflow angles (0°, 30°, 60°, and 90°) to encompass a wide range of potential inflow angles. For the gradient of the main channel, we used 10° and 15° to examine the 10° channel gradient threshold between landslide dam formation and debris flow initiation based on a previous study of deep-seated landslides [20].
Figure 1. Experimental flume characteristics. a) flume diagram; b) flume apparatus; c) flume sections for inflow angle 0°; d) flume sections for inflow angle 30°, 60°, and 90°.
In addition to the topographic factors, we mixed different amounts of water with input sediments since hydrologic factors alter their mobility [28]. Gravimetric water contents from 0% to 100% in 20% increments were applied to the dry sediment mass (Figure 2). Zero percentages of water content imply that no additional water was added to the dry sediment sample. When water content is less than saturation (wsat), we assumed that the additional water was provided to the landslides mass via the mixture with channel water. In the field, landslide materials enter flowing water in the main channel. However, controlling water flow in the main channel of the flume introduces complexity related to testing the mobility of the materials. Similar experimental methods were used by other studies to examine the mobility of landslide material [29,30].
Water 2019, 11, 17
4 of 20
A total of 400 cm3 of sediment and six gravimetric water contents were applied in all experiments. The total weight of sediment plus water became 440 to 1360 g, differing based on water content and sediment density. Volume of sediment samples (400 cm3) within the 10 cm width of the flume was determined by scaling down the actual volume of sediment moved by deep-seated landslides and the respective river channel width ([20]; 3.3106 m3 for a mean channel width of 199 m). Therefore, we assumed that our flume experiment was approximately 1/2000 of an actual deep-seated landslide scenario. Dry sediment and water were mixed and placed at the end of section A, which was blocked by a plastic gate. Then, the gate was opened manually to allow sediment and water to flow downstream via the junction. Because our primary objective was to examine the formation of landslide dams and the mobility of debris flows, we released the sediment by opening the gate abruptly to minimize the variability of initial mobility. Such abrupt gate opening was also used in large-scale debris flow experiments [31]. After all transported sediment stopped, sediment deposited within the five sections (A to E, Figure 1c and 1d) was collected. All collected sediment was ovendried for 24 h at 105° C and weighed. Percentage of deposits in each section was calculated using the sediment within a given section divided by the initial sediment mass.
Figure 2. Weight-based water content for the experiment. Below saturation, sediment in the flume is assumed to be sediment and water on hillslope. Above saturation, sediment in the flume is assumed to be sediment and water on hillslope with additional water from the channel.
2.2. Sediment Mobility Sediment collected from the five sections (A to E) represents the topographic continuity from the hillslope to channel. For instance, section A represents the hillslope, while section B is the junction between the hillslope and the main channel. Further downstream, sections C (50 cm downstream from the junction), D (70 cm downstream from section C), and E (below the outlet) represent inchannel transport zones. The thickness of sediment deposited in each channel section is an important parameter for examining mobility and the potential for the formation of landslide dams. Therefore, we estimated the thickness of material (hn) in the nth section by using the following equation:
hn
Wn d An
(1)
where Wn is weight of sediment deposition in nth section, ρd is the sediment bulk density, and An is the area of nth section. For this estimation, we excluded section E, because this was outside of the flume channel (Figure 1). We assumed that the thickness in section B becomes the depth of the landslide dam. To evaluate the mobility of sediment, we developed a sediment connectivity index (SCI). The sediment connectivity index (SCI) was initially proposed by Borselli et al. [32], which was defined as the potential connection between up to downstream parts of a catchment. Bracken et al. [1] also defined sediment connectivity between hillslopes and deposition areas for various landscape units including channels, lakes, and flat terrain. Because our study focused on the formation of landslide
Water 2019, 11, 17
5 of 20
dams and landslide-induced debris flows, our SCI is expressed based on the amount of sediment in sections B and E using the following equation:
SCI
WE WB WE WB
(2)
where WB and WE are the dry weights of sediment in sections B and E, respectively. Negative values of SCI indicate that the sediment source is poorly connected with downstream reaches, i.e., landslide material formed landslide dams, while positive SCI values are associated with landslide material transformation into debris flows because sediment sources and downstream reaches are closely connected. We assumed the sediment deposition at the junction (section B) and the outlet (section E) for differentiating between landslide dam formation and transformation into debris flows. Landslide dams form when landslide sediments move downslope, collide with the opposite valley wall, and then accumulate within the channel near the junction [33]. In contrast, sediment movement associated with debris flows initiates on steep slopes, transports sediment downstream in steep channels, and finally deposits in gentle and wide channels or valleys [34]. We adapted the SCI concept of Borselli et al. [1], which calculates a sediment delivery ratio by comparing the upstream and downstream components of sediment movements. Nevertheless, our SCI is a representative value for combined factors of topography, soil types, and water availability. 2.3. Characteristics of Sediment Movement We used four types of sediment originating from different geology. Sediment derived from sand and shale (SS) was obtained from Nigoridani, Nara Prefecture (34°7'35"N, 135°46'30"E), where a deepseated landslide occurred in September 2011 due to Typhoon Talas [20]. This sample was collected from a 3.3106 m3 landslide deposit [20] consisting of a highly fractured muddy alternation of sand and shale of the Cretaceous Miyama Formation [35]. The pyroclastic sediment (PS) was collected in the area affected by the 2013 debris flow in Motomachi District, Izu Oshima Island, Tokyo Prefecture (34°44'50"N, 139°22'5"E). The weathered granite (WG) and weathered sedimentary rock (WS) sediments were collected in areas affected by 2014 landslides and debris flows in Asaminami Wards, Hiroshima City (34°28'55"N, 132°29'15"E). The geology of this area is dominated by late Cretaceous granite (weathered granite) on the east side and a mélange matrix of a middle to late Jurassic accretionary complex (weathered sedimentary rock) on the west side [36]. For all types of sediment, samples were collected using a 400 cm3 metal cylinder (diameter 11.3 cm, height 4.0 cm). Samples were oven-dried for 24 h at 105° C and dry weight was then measured. Sediment bulk density (ρd) was calculated based on dry weight divided by the volume. The void ratio (e) was then estimated using bulk density, particle density (ρp = 2.65 g/cm3), and water density (ρw = 1.0 g/cm3) [37]. Porosity (n) was derived from the void ratio [38]. Saturated water content (wsat) is defined as the maximum water content that fundamentally equals sediment porosity [39]. Particle size distribution was also analyzed based on the standard method of the American Society for Testing and Materials (ASTM) C136-01 [40,41]; sieve sizes: 45 mm, 19 mm, 9.5 mm, 4.75 mm, 2 mm, 850 μm, 425 μm, 250 μm, 106 μm, and 75 μm. Dry sediment samples were placed into sieves and then shaken using a mechanical sieve shaker (FRITSCH vibratory sieve shakers) for 10 min. The amount of sediment retained on each sieve was weighed. Sediment classification was analyzed based on ASTM D2487-06 [42,43]. Based on the cumulative percentages of particle size distribution, median particle size (D50), coefficient of curvature (Cc), and coefficient of uniformity (Cu) were estimated. The coefficient of curvature was estimated as: Cc
D 30 2 D 10 D 60
(3)
where D10, D30, and D60 represent the diameter of particles finer than 10%, 30%, and 60% of the total mass, respectively [38]. The coefficient of uniformity was estimated as:
Water 2019, 11, 17
6 of 20
Cu
D60 D10
(4)
Coefficients of curvature and uniformity are both indicators of particle size distribution. Because the ratio of saturated water content of sediment to its liquid limit (Approximate Mobility Index, AMI) is an important parameter for determining the potential for the transformation landslides into debris flows [44], we also conducted liquid limit tests based on ASTM D4318-05 for the fraction of sediment samples 1), which suggests that sediments had high potential for fluidization. This indicates that the fluidization process is affected by saturated water content rather than by liquid limit for sediments with low clay contents [47]. Sediment particle size was highly variable among sediment types. The median diameter of the particle size distribution (D50) ranged from 0.2 to 7.5 mm, with the lowest in PS and highest for SS. Since more than 50% of sediment was retained on the 75 μm sieve, sediments were classified as coarse-grained based on the ASTM D2487-06 [42]. All sediment types were categorized as sands, while SS was categorized as gravels because more than 50% of the sediment was retained on the 4.75 mm sieve. All sediment types except PS were well-graded with a wide range of sizes; Cc ranged from 1.2 to 2.3 and Cu ranged from 6.1 to 42.2. PS was classified as poorly-graded, with Cc