A Form-based Web Service Composition for Domain Experts INGO WEBER, NICTA, Sydney / School of Computer Science & Engineering, Univ. of New South Wales HYE-YOUNG PAIK, School of Computer Science and Engineering, Univ. of New South Wales BOUALEM BENATALLAH, School of Computer Science and Engineering, Univ. of New South Wales
In many cases, it is not cost effective to automate business processes which affect a small number of people and/or change frequently. We present a novel approach for enabling domain experts to model and deploy such processes from their respective domain as Web service compositions. The approach builds on user-editable service naming and representing Web services as forms. On this basis, the approach provides a visual composition language with a targeted restriction of control flow expressivity, process simulation, automated process verification mechanisms, and code generation for executing orchestrations. A Web-based service composition prototype implements this approach, including a WS-BPEL code generator. A small lab user study with 14 participants showed promising results for the usability of the system, even for non-technical domain experts. Categories and Subject Descriptors: D.1.7 [Software]: Visual Programming General Terms: Design, Algorithms, Programming Additional Key Words and Phrases: Web service composition, end-user programming, automatic code generation, business process modelling, SaaS
1. INTRODUCTION
Business process management (BPM) refers to a management discipline and software suites for automating, improving, and optimizing business processes to enhance productivity [Richardson et al. 2009]. Re-design and automation of business processes are the main focus of enterprises when employing BPM [Wolf and Harmon 2006], to enhance their business productivity and agility [Bahandur et al. 2005]. Realizing business processes as compositions of Web services is a widely used approach for rapid adaptation to changes, which is a key requirement to support productivity and agility [Daryl C. Plummer 2009; Pettey and Goasduff 2010]. This trend is fueled by modern enterprise applications exposing most (if not all) of their functionality as Web services. Despite the success of BPM technologies, currently a large percentage of processes are not automated [Wolf and Harmon 2006; Oracle White Paper 2008]. First, although main stream BPM technologies have produced promising results that are certainly useful, they do not cater for the requirements of ad-hoc processes [Schurter 2009]. Second, there are costs and high skills involved in implementing automated processes. This affects primarily the “long tail of processes” [Oracle White Paper 2008], i.e. processes that are less structured, that do not affect many people uniformly, or that are not part of the critical core business of an organization. For instance, [Wolf and Harmon This work is supported by the Service Delivery and Aggregation project under the Smart Services CRC, Australia 2010-2011. NICTA is funded by the Australian Government as represented by the Department of Broadband, Communications and the Digital Economy and the Australian Research Council through the ICT Centre of Excellence program. Permission to make digital or hard copies of part or all of this work for personal or classroom use is granted without fee provided that copies are not made or distributed for profit or commercial advantage and that copies show this notice on the first page or initial screen of a display along with the full citation. Copyrights for components of this work owned by others than ACM must be honored. Abstracting with credit is permitted. To copy otherwise, to republish, to post on servers, to redistribute to lists, or to use any component of this work in other works requires prior specific permission and/or a fee. Permissions may be requested from Publications Dept., ACM, Inc., 2 Penn Plaza, Suite 701, New York, NY 10121-0701 USA, fax +1 (212) 869-0481, or
[email protected]. c YYYY ACM 1559-1131/YYYY/01-ARTA $10.00
DOI 10.1145/0000000.0000000 http://doi.acm.org/10.1145/0000000.0000000 ACM Transactions on the Web, Vol. V, No. N, Article A, Publication date: January YYYY.
A:2
2006] found that among the organizations using BPM technologies, only 12% choose to use BPM for business process automation Recent studies [Pettey and Goasduff 2010; Reijers et al. 2010; Patig et al. 2010] confirm the limitation of current BPM technologies to effectively support long-tail processes automation. The studies provide recommendations on increasing the relevance of BPM for end-users, allowing process changes by non-technical personnel, and reducing the complexity of BPM technology. [Patig et al. 2010] found in particular that the most important requirement for organizations world-wide considering BPM tools is usability. Motivated by the need for user-friendly BPM technology, the goal of this work is to devise an approach and system to support domain experts in automating long-tail processes. We believe that BPM solutions should enable users (including non-experts) to easily define and manage processes over heterogeneous IT systems. The ubiquity of process and services technologies will have little value if users cannot use, share and reuse them simply. We focus on processes that can be implemented as Web service compositions. As a user group, we target domain experts – i.e., non-IT professionals, such as scientists, business analysts, or administrators, who have a need to compose data sources and computational applications to automate some activities of their processes. These domain experts then become a subclass of end-user programmers. We believe that these often have a good understanding of the processes they participate in; and that they are able to abstract from single process instances to higher level process model abstractions including simple control flow and data flow constructs. An example is hiring a new employee, where HR recruiters have a good understanding of the default process and under which circumstances they may deviate from it. Another example are scientists, who perform computational experiments to identify disease patterns or what-if analyses, and simulations to, e.g., estimate the influence of exercising on bone growth. The scientists use various tools (e.g, data import and cleaning, data processing, visualization and export). They often need to access, configure, analyze, and integrate data, as well as configure and apply computation services. Main stream BPM languages and tools for process automation target professional developers, often requiring that users have an understanding of low-level programming constructs and techniques. For instance, developers need to use variables, specify complex control flow such as ordering constraints, specify complex data transformation rules, and customize service invocation parameters. End users and skilled knowledge workers often need to access, analyze, and integrate information from various sources to perform their routine tasks. Ideally end users should be able to benefit from the power of service-oriented architectures and the process-centric integration of heterogeneous systems, like traditional enterprise business processes. The pressure is now on for businesses to evolve their systems so that they meet the needs of workers to provide services of immediate, personalized and explicit value to customers in addition to the traditional focus on business process monitoring and management. The following lists the problems and requirements that are relevant to our goal: — Programming tasks require writing code as abstract (symbolic, textual, or visual) artifacts [Harel 2008]. This makes it hard for untrained users to match their tasks to the abstractions. — Users also struggle with the so-called selection barrier [Ko et al. 2004], which refers to the fact that frequently users know what they want the computer to do, but not how to express that. ACM Transactions on the Web, Vol. V, No. N, Article A, Publication date: January YYYY.
A:3
— Immediate verification of the programs is required, to provide instantaneous warnings to the programmer if any problems arise [Harel 2008]. — Debugging features are important, even for non-expert programmers [Jones et al. 2010]. — High-level instructions of the programmer need to be understood by the system, so as to be translated to a formal representation [Harel 2008]. Our work proposes a new language and system for forms-based service composition, to allow domain experts to address their idiosyncratic, long-tail process automation needs themselves. We consider this a special class of End-User Programming (EUP) [Cypher et al. 2010], integrating business process automation and EUP paradigms. The two dominant paradigms in EUP are scripting languages – usually simplified programming languages – and programming by demonstration (PbD) – the user demonstrates to the programming tool what she wants accomplished, and the tool interprets and generalizes the intention to formulate a program. Since we want to include processes where parts are executed conditionally, we propose a scripting approach to design process models. More specifically, our approach relies on integrating forms and visual representation of process models. In the approach, services can be described using names that are meaningful to the user, and independent of the services’ technical names. We use these names during service discovery and in the process design. Our work aims at keeping the complexity of process modeling low, so as to make the approach applicable to domain experts. Therefore, we include features present in traditional integrated development environments (IDEs), as follows. Our design time environment can simulate the process execution, to explore its behavior before deployment and debug it early. We provide automated verification techniques to check for correct combination of the modeled control and data flow during the modeling process. The approach further includes a code generator, which can automatically translate the models to an executable language. The complexity is further limited through a targeted restriction of control flow expressivity: modeling constructs are restricted to representing with sequences of activities, conditions when to execute or skip activities, and the data flow between them. However, to enable fast execution, our code generation includes the automatic parallelization of activities, where possible. We argue in Section 8.3 that these restrictions still allow for many practical processes to be captured. The prototype’s implementation can be accessed as Software-as-a-Service (SaaS) application from domain experts’ browsers, and allows them to compose processes in a drag-and-drop fashion. Further, more complex compositions can be developed by professional programmers and reused by domain experts as sub-processes; and inversely, compositions by domain experts can be refined by professional programmers. We note that the approach outlined above is ¨ very different from other service composition or workflow tools (e.g., Kepler [Ludascher et al. 2006] or Taverna [Oinn et al. 2004]) which tend to support highly complex modeling and programming capacity, and demand higher level of assumed knowledge from their users. We evaluated our approach with regard to two aspects. First, we conducted a case study with use cases from the financial domain: data analysis processes such as finding a correlation between news and stock price changes. The use cases are taken from our industry partner, Sirca1 . Second, we conducted a user study, to measure: (i) the usability of the tool for technical and non-technical users with varying levels of domain expertise; and (ii) the efficiency of the tool for users with a technical background. Our lab user study with 14 participants showed that some of the domain experts with a 1 http://www.sirca.org.au
ACM Transactions on the Web, Vol. V, No. N, Article A, Publication date: January YYYY.
A:4
limited level of technical understanding were capable of easily composing processes using our tool. In summary, the contributions of this paper are the following2 : — User-editable forms as a representation of Web services. — A generic forms-based composition method, where processes can be modeled in a simple, visual language; while restricted in its expressivity, the language is powerful enough to support many scenarios. — Process simulation is used to simulate process execution during the design phase. — Immediate automated process verification for reducing the burden on the user to build a correct composition. — Automatic code generation with parallelization, to generate executable orchestrations from the forms-based composition language. — A user study to evaluate the usability of the tool. We also present a Web-based prototype and show how the approach can be enacted.3 The remainder of the paper is structured as follows. Section 2 gives a motivating example and an overview of our approach. Section 3 describes how services are represented, and how users can edit these representations. The control and data flow modeling, the simulation and the verification are discussed in Section 4, the code generation and runtime aspects in Section 5. The architecture and implementation are explained in Section 6. The user study experiment and results are presented in Section 7, followed by discussion (Section 8). Related work is described in Section 9 and Section 10 concludes the paper. 2. OVERVIEW: FORMS-BASED SERVICE COMPOSITION
After introducing a running example, we give a summary of the approach below. 2.1. Use Case: News and Financial Data Analysis Process
Research and development within Sirca on the utilization of available datasets led to the implementation of numerous Web services [Robertson et al. 2011]. The types of Web services range from query/search, data cleaning, to complex statistical analysis. Currently, each Web service is invoked individually by a simple user interface based on Web forms. For example, ‘Find news data’ service can search published news articles. It takes dates (i.e., from/to dates for the search) and a keyword. The keyword can, e.g., be a company code (such as BHP for BHP Billiton Limited). ‘Find performance data’ service can return trading data summaries for a company code. The user can specify exact time and date ranges and a company code. Most services operate on socalled time series, i.e., comma-separated values (CSV) files where every line marks an event at some point in time. For instance, news data contains news messages, along with meta-data like the time of publication, the headline, etc. The services mentioned below can manipulate these files automatically; e.g., the merge service can merge two time series, based on time stamps. Most analysis processes are performed by regularly resorting to low efficiency manual methods to draw information from certain services and use it elsewhere to support analysis tasks. Moreover, this problem worsens as the variety of available services and the flexibility of available tools increase. One such example is described in Fig. 1, where each step represents a Web service. 2 An
earlier version of this work has been presented as a short paper at ICSOC’11 [Weber et al. 2011] and demonstrated (without paper) at BPM’11. Specifically, this did not include the user study, process simulation, or user-editability of the forms; for all other aspects, only an overview was provided in the previous publications. 3 A demonstration video of the prototype can be found at http://www.cse.unsw.edu.au/ FormSys/FormSys/. ~ ACM Transactions on the Web, Vol. V, No. N, Article A, Publication date: January YYYY.
A:5
(1) (2) (3) (4) (5)
Find news data: e.g., search for news data on the company ‘BHP’ in the last 6 months Find performance data: e.g., return hourly stock price for ‘BHP’ in the last 6 months Merge dataset: e.g., merge the result data sets from the first two steps Perform statistical analysis: e.g., identify which news were influential on the price Visualize dataset: e.g., visualize influential news and the prices together Fig. 1. Financial data analysis from Sirca, for an Australian mining company ‘BHP’
In the above analysis scenario, the user first collects news articles published in the last 6 months in which BHP is mentioned. Then, using ‘Find performance data’ service, he obtains hourly stock price summary for the same company for the same period. Next, the two data sets from each service are merged into one using the ‘Merge dataset’ service. The result of the merge is used as input to ‘Perform statistical analysis’ service to identify news articles that might have influenced the stock prices. Finally, the visualization service renders the identified events (i.e., news article publication and stock prices) into a graph. Repeating the process in Fig. 1, filling Web forms and invoking underlying Web services, involves around 30 mouse clicks, as well as entering the same information (e.g., ‘BHP’, the date range of interest, etc.) repeatedly at multiple steps. Once the processing is complete, the exact parameters that resulted in a given graph are lost. The set of changing parameters and the details of which service to use with which parameters differs from one analysis process to another. Therefore, while being repetitive, the processes are required to be flexibly executable or adaptable by the analyst. Automating such processes is of interest to (i) reduce the required amount of user interaction for running a process instance, and (ii) store the exact parameter values that led to a particular graph. The latter is important, because comparable graphs are often required periodically. For instance, after a company announced earnings, or a quarterly report is issued, it may be required to re-run a process that created a certain visualization. 2.2. Approach Overview
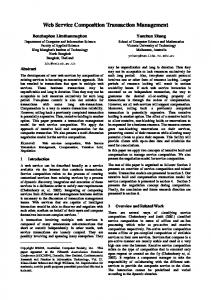
The overview of the targeted system components and the involved users is depicted in Fig. 2 and explained below.
Process owner
FormSys Process Designer
Service Repository
Process user
Process Execution
Web Service Web Service Web Service Runtime Runtime Runtime
Service owner
Fig. 2. Overview of the involved components and user roles
— Service owners can register Web services in the service repository, where they can edit the representation of their services; this representation and how to edit it is explained in the next section. ACM Transactions on the Web, Vol. V, No. N, Article A, Publication date: January YYYY.
A:6
— Process owners can create process models as Web service compositions over the services in the repository using FormSys Process Designer. This is where the service representations from the repository are used. Devising this process modeling environment in a domain expert-friendly way is the main focus of our work (see Section 4). — When a process design is completed, the process can be deployed to a process execution environment. This follows a common design principle in BPM: the process design phase and the execution phase are separated. Due to widespread availability of suitable execution environments, we use a third-party tool for this purpose. However, that requires FormSys Process Designer to generate code that can be executed by this environment4 ; this code generation is described in Section 5. Process users can then execute deployed processes through this execution environment, which in turn invokes the actual Web services. A more detailed explanation of the architecture and implementation is given in Section 6. We now proceed with a detailed description of the major concepts and components. 3. SERVICE REPRESENTATION
In this section, we explain how services are represented as forms, and how the representation in the service repository can be changed. 3.1. Forms as Service Interface Representations
In the service repository, every service is collectively represented by a WSDL document, a user-editable name, an icon, and forms as visual representations of input and output messages. While WSDL needs to be present in the repository, and is used by our tool for generating an executable process, it is completely hidden from the domain expert designing processes. 3.1.1. Forms. The service is a computational entity that performs some activity, which is represented with an icon. For example, Figure 3 shows the icon for the “Find News Data” service. A service in our approach corresponds to a WSDL operation. An invocable WSDL operation has an input and an optional output message5 . The input and output messages for a service are represented as forms – reflecting the service’s running user interface. Fig. 4 shows an example of an input message as a form. Each data field from the corresponding WSDL message has a box associated to it, somewhere in the form. For instance, in Fig. 4, the blue box around the field for “Key words” corresponds to the XML schema element at the XPath expression “/keywords” within the respective WSDL message; and the “Start date” field corresponds to the element at “/date/start”. The correspondence between boxes and data fields in the messages has to be marked up manually, to enable automatic execution of designed processes. By default, the form could be rendered from the XML Schema type that belongs to the respective message. However, given our focus on domain experts, we believe that the form representation should be something the user is already familiar with. Hence, a screenshot of the UI through which the user commonly accesses this service lends itself as a good representation. The form representation is used by the tool to allow domain experts to specify data mappings between messages. 4 The
code generation thus is specific to the chosen execution environment; replacing the execution environment therefore only requires adaptation of the code generation. 5 For simplicity, the system currently does not support fault messages and modeler-defined exception handling, as well as certain XML Schema constructs and certain WSDL features – see Section 8.4 for details.
ACM Transactions on the Web, Vol. V, No. N, Article A, Publication date: January YYYY.
A:7
Fig. 3. Find News Data service as icon
Fig. 4. Visual representation of Input Message for Find News Data
3.1.2. Annotation. Besides the technical information from WSDL and the visual representations, the services in our repository and their fields are also given non-technical names. The names of form fields, corresponding to the service’s input/output parameters, as well as the names of services themselves are editable and can be tagged with names that are meaningful to the users, which are used during search and discovery of services. These names are created by users, at the time when entering a service into the repository. In the process modeling tool, the user can assign the service and its parameters names that they prefer to use for its process. For instance, while some user called a service “Find News Data”, another user may refer to it as “Import News Data”. 3.2. Editing Service Representations
The representation described above is user-editable: users can change the service representation stored in the repository. This functionality is available through a Web front-end – a screenshot is shown in Figure 5. Updates to the repository are conducted by a user playing the role “service owner” – cf. the approach overview, Figure 2. Service owners are expected to have a reasonable understanding of Web services technology; the role thus assumes a stronger technical skill set than the roles of process owners or process users. A given person can of course play multiple roles. When entering a new service into the repository, the service owner starts by specifying the URL where a WSDL document can be found. The tool parses this URL to retrieve information about the available operations, their message structures, etc., and to evaluate if the restrictions of the tool (see Footnote 5) apply to the given WSDL document. Then the user selects an operation6 , gives the service a human-friendly name and uploads a suitable icon to represent the service. 6 Recall
that the notion of a service herein corresponds to a single operation of a SOAP/WSDL Web service.
ACM Transactions on the Web, Vol. V, No. N, Article A, Publication date: January YYYY.
A:8
Fig. 5. Process Repository UI
The service representation requires form images for the input and (optionally) the output message of the service. After these images have been uploaded, the user can mark-up form fields on these images, as shown on the lower half of Figure 5 for the input message of the “Aggregate Performance Data” service. Here, the “Event Set ID” field is currently being edited: besides the human-friendly field name, a default value and an XPath expression can be specified. For the example field in Figure 5, the selected box for field “Event Set ID” corresponds to the XML schema element at “/eventSetId” – that is, one level below the root element of the input message of the operation “Timeseries”. 4. MODELLING PROCESSES
Modeling an executable process in our approach builds on the rich service descriptions outlined in the previous section. Following a conventional split in BPM, we treat control flow and data flow as two separate, but not independent, layers. The control flow serves as an abstract process description: which services should be executed, under which conditions and in which order? The data flow adds more detail, by specifying how the input and output message fields of the various services interact. ACM Transactions on the Web, Vol. V, No. N, Article A, Publication date: January YYYY.
A:9
Fig. 6. Visual Process Modeling of the Running Example
4.1. Forms Control Flow
In order to retain the focus on domain experts, the control flow modeling is restricted: services are arranged into sequences or conditional sequences. If the condition evaluates to true in a process instance, the associated services are executed; if it evaluates to false, they are skipped in this instance. The conditions are free text, and are turned into questions to the user starting a process instance, as well as conditional execution of the respective services – see Section 5. The above restriction has an impact on the expressiveness – which we discuss in detail with regards to workflow patterns coverage in Section 8.3. However, anecdotal evidence from experience with industry contacts suggests that forcing the occasional user of our system to understand the particularities of the semantics of an expressive language alienates most targeted domain experts. Therefore, we try to keep the control flow modeling as simple as possible. As shown in Fig. 6, in terms of explicitly modeling the control flow, the user arranges the services sequentially in the process editor – indicating the execution order of services. A condition for one or more given service invocation is indicated by surrounding the service with a labeled rectangle. It is possible to link a service’s output to one or more services’ input. However, this is expressed separately through the data flow model, which is explained in the following section. While the control flow modeling allows users to express only sequences and trees (i.e., conditional sequences), the actual execution of services at run-time is by no means restricted to sequences. The execution can in fact be parallelized automatically. We formally discuss how we extend the control flow sequence to parallelized execution in Section 5.1. 4.2. Forms Data Flow
This section outlines which classes of data we encounter in our approach, the modeling of data flow, and how data flow relates to control flow. The data flow modeling works roughly as follows in our approach. Each service has an input and possibly an output message. A message consists of a set of fields, and has a form as visual representation – c.f. Fig. 4. Data fields from one message can be mapped to data fields of another message in our approach. For instance, in our running example, the outputs of the two import services can be mapped to the merge service’s input; the date range (i.e., from/to dates) in one data import service can be mapped to the date range of the other import service in our example process; etc. Besides mapping fields from one message to another, static values can be assigned to fields. 4.2.1. Input Data Field Classification and Handling. Data fields of input messages fall into one of three categories, with respect to processes: user-static, process-static, and process-instance-specific data.
— user-static: this is the type of information that rarely changes between process instances for the same person. For example, in a travel approval and reimbursement ACM Transactions on the Web, Vol. V, No. N, Article A, Publication date: January YYYY.
A:10
process, the name, title and address of ‘John Smith’, the traveler, are not likely to change from one trip (i.e., an instance) to the next. In the example process, this type of data plays no role. — process-static: this class of data rarely changes between instances of the process, regardless of person executing them. In the example process, this includes parameters like the requested statistical measures. This is supported by allowing the process designer to assign static values to data fields. — process-instance-specific: this is the type of information that changes from one instance of a process to another, even for the same user. In the example process, this includes the parameters for querying the data sources (e.g., from when to when). In our approach, this information is usually entered at the beginning of the process by the user. From the data flow and static assignments, our system determines which fields do need to be filled in, and those are presented to the user when starting a process instance. A specific subtype of information is process-step-specific, i.e., information which is only required in a single step of a process. However, we currently do not treat this sub-type differently. 4.2.2. Data Flow Model. In our method, the user can define mappings between fields of messages of different Web services. Depending on the kind of messages and the user’s actions, the following can be the case:
— specifying that an output field of one service corresponds to the input field of another (output-input mapping); — specifying that two (or more) input fields of separate services will get the same value from the process-specific user input (input-input mapping); or — specifying a static value for an input field, which can be null (static assignment). Output-output mappings are currently undefined and hence disallowed. When creating mappings, a user specifies the data flow explicitly, albeit not as a data flow graph. Data flow graphs can get much more complicated than we want the user to create. An example from our tool is given in Fig. 7, showing the input messages of “Find news data” and “Find performance data” – i.e., here input-input mappings are modeled. The message fields are shown as colored boxes: blue boxes refer to unmapped fields, other colors represent data mappings and static assignments. The list of declared mappings and assignments is shown as rectangles on the top of the mapping area, where rectangles with values inside are static assignments. Data field boxes belonging to a mapping/assignment are colored in the same way. For instance, the value “100” is assigned to the field “Rows per page”; or the purple color indicates that the fields “RIC” (left) and “RICs to process” (right) are linked by an input-input mapping. The list of declared mappings remains stable when replacing one or both of the forms in the mapping workspace. Hence, the user can specify mappings across fields of more than two messages. 4.3. Design-time Process Simulation
A main challenge when creating executable process models is to anticipate at design time how the process will behave at runtime. To ease this challenge for process designers in our approach, we devised a process simulation mode in the design time environment, where the modeller can “play through” the process before transitioning to runtime. This feature is inspired by the debugging modes of common IDEs, such as Eclipse or MS Visual Studio. The aspects that need to be simulated are: — entering input data to be used in Web service invocations; — applying static assignments and input-input mappings before service invocations; — invoking Web services; ACM Transactions on the Web, Vol. V, No. N, Article A, Publication date: January YYYY.
A:11
Fig. 7. Data Flow Modeling
— displaying output data; and — applying output-input mappings when the results of service invocations become available. Below we explain these steps in more detail. It should be noted that the simulation essentially executes the designed service orchestration out of the GUI, i.e., the user’s browser. In particular, while one could simulate the Web service invocation (e.g., by always returning static values), we chose to invoke the underlying Web services instead. Therefore, the simulation here shows how the process would execute in the execution environment, and makes intermediate results visible. We argue that static return values would likely be less useful for debugging – e.g., when a set of input parameters would trigger an error, which the simulated Web service suppresses. Calling the actual Web services does not pose a problem in domains like financial data analysis – however, it can be an issue when the effects of an invocation are more critical, like procuring goods, reserving resources, or communicating with business partners. In such cases, common testbed solutions might be applied – e.g., the simulation feature could invoke Web services deployed in a test environment, instead of the one in production. Figure 8 shows an example process during execution, as implemented in the tool. 4.3.1. Handling Inputs, Output and Data Mappings. When running a simulation, the user gets a view of all input and output forms in a row, with all active form fields highlighted. Input values can be entered directly into a given field. In Figure 8, for instance, the value “BHP.AX” has been entered into the “RIC” field. Similarly, the output data is directly displayed in the respective output form field. All fields that are the target of a static assignment or mapping are read-only in simulation mode. The values of static assignments are displayed in the respective target fields. If the value for a mapping is available, it is displayed in the same way; otherwise the mapping relation is indicated. Whenever the source of a mapping becomes available – either as user input for input-input mappings, or as the result of a Web ACM Transactions on the Web, Vol. V, No. N, Article A, Publication date: January YYYY.
A:12
Fig. 8. The Process Designer in simulation mode
service invocation for output-input mappings – the value of all target fields is updated accordingly. 4.3.2. Web Service Invocation. Calling Web services poses a particular challenge, since the invocations cannot be made out of client-side JavaScript code: modern browsers enforce the same origin policy to prevent cross-site scripting attacks, etc. – meaning that client-side code can communicate exclusively with the site from which it originated, but no other sites. That prevents SOAP-over-HTTP calls to Web services running elsewhere. To circumvent this restriction, our simulation approach is split between the client-side control and orchestration mechanism and a server-side Web service invocation proxy. The client-side code can then invoke arbitrary Web services through AJAXstyle communication with the server-side invocation proxy. There are two modes of simulation offered: step-through and play-all – see the music player-like symbols in the top right corner of Fig. 8. In step-through mode, only one service is invoked at a time. Thus, the user can observe at her own pace how the service reacts to the given input. When she is satisfied with the previous invocation and the input data, she can select to invoke the next service in the chain. In contrast, in play-all mode all input data needs to be provided upfront. When starting this mode, the services in the chain are executed one after the other, as long as no errors occur. Between service invocations, a short break is made to allow the user to understand how the simulation is progressing. At any time in step-through, the user can choose to execute the remaining services in play-all mode. Each service can be in a single state, where the current state is shown with a colored overlay and a symbol over the service icon: (i) not started (normal, no overlay), (ii) ACM Transactions on the Web, Vol. V, No. N, Article A, Publication date: January YYYY.
A:13
currently executing (gray, loading), (iii) executed successfully (green, check mark), or (iv) invocation terminated with an error (red, cross). This can be observed in Figure 8: the service “Find Performance Data” has been executed, and the service “Aggregate Performance Data” is currently executing. Finally, if conditions are present in the process, the user selects if these are taken to be true or false before the first service is executed. Accordingly, services will be executed or skipped in the simulation. 4.4. Service Data Flow Graphs
When specifying data mappings, implicitly a data flow graph is created as follows. A directed edge represents the transfer of data from the edge’s source activity to its target activity. An input activity (not shown in the process model) for the process user denotes the start of a process. It has a data flow edge to every regular activity in the process. An output-input mapping creates a new edge; a static assignment or an input-input mapping does not. An edge resembles a strict dependency: without the completion of the source node of the edge, the target node cannot execute. Therefore we require that the graph is acyclic for the obvious reason: circular dependencies are unsatisfiable. While edges stem from individual fields, nodes in the graph represent services; at most one edge is added from a given source to a given target. There can be contradictions between the data flow and control flow of a process, as follows. Any execution of the process has to respect every edge in the data flow graph, i.e., the target can only be executed once the source’s execution completed. A data flow graph constructed as explained above has potentially very few edges between the nodes, other than the edges from the start node. For such a graph, a set of possible valid execution paths exists, i.e., possible orders in which the graph’s nodes can be visited without violating the dependencies. The control flow of the process is, however, primarily sequential as outlined in the previous section. Still, different execution paths for the control flow may exist: depending on the truth of conditions, the nodes of the sequence may be executed or skipped. In particular, the control flow may allow execution paths which are not allowed in the data flow graph. One of two different viewpoints of the relation between the control flow and data flow and their execution paths can be taken.7 (1) The user specified the control flow, and the data flow cannot violate it. In other words, every execution path of the control flow has to be an execution path of the data flow as well; the control flow is the dominant element. (2) Alternatively, the control flow is seen as more of a guideline, but if the data flow requires another ordering, this is taken to be more important; the data flow is dominant. Where there is a contradiction between the data flow and the control flow, the control flow is changed so as to fit the data flow. We believe the second alternative is more intuitive within the proposed system: the user can design a more coarse-grained control flow and then add the more fine-grained data flow. If the user changes either of them in a way that creates a contradiction between the two, the system asks the user if the control flow should be corrected to fit the data flow; if not, the problematic change is rolled back.
7A
third alternative would be to abandon the control flow altogether, and rather maintain a “bag of services” relevant to the process, with their execution conditions. For scenarios where this interpretation is the best fit, the user interface should be designed to reflect this fact.
ACM Transactions on the Web, Vol. V, No. N, Article A, Publication date: January YYYY.
A:14 4.5. Verification
Various problems in control and data flow modeling may arise, as motivated above. In order to adequately deal with these, we provide a formal model to reason about process graph properties. Based on this model, we specify properties describing “correct” process models. Generally we keep the formal discussion herein minimal, and focus on solving the problems encountered with standard graph algorithms for which textbook solutions exist – see, e.g., chapters 22-26 in [Cormen et al. 2001]. Definition 4.1. A Process Graph (PG) is a tuple P G := (N, E, F, C), where — N is a finite set of nodes n0 , n1 , n2 , . . . representing the start node (n0 ) and Web services (n1 , n2 , . . .). — E is a finite set of directed data flow edges e1 , e2 , . . . where ei = (nj , nk ) leading from nj to nk (nj 6= nk ) is used to express data dependencies. The edge ei = (nj , nk ) reads as “nj provides data for nk ”. — F is a finite set of directed control flow edges f1 , f2 , . . . where fi = (nj , nk ) leading from nj to nk (nj 6= nk ) is a control dependency. The edge fi = (nj , nk ) reads as “nj should be executed before nk ”. Each node can only be the source / target of at most one control flow edge: ∀f = (ni , nj ) ∈ F : ∀f 0 = (nk , nl ) ∈ F \ {f } : nk 6= ni and nl 6= nj . — C is a finite set of conditions c1 , c2 , . . . with ci = (, Nci ) being associated to a set of nodes Nci ⊆ N , and having some textual description. Each node can have at most one condition, i.e., the Nci are disjunct: ∀ci , cj ∈ C : Nci ∩ Ncj ≡ ∅. A data dependency path, denoted as →d , from ni →d nj exists iff ∃ek ∈ E : ek = (ni , nj ) or ∃nl ∈ N, ek ∈ E : ek = (ni , nl ) and nl →d nj . An execution path over the nodes in the process is an ordered permutation of a subset of the nodes in the graph and starts with the start node n0 : [n0 , ne1 , ne2 , ...] where {n0 , ne1 , ne2 , ..} := Ne ⊆ N . nei is said to come before nej in some execution path [n0 , ne1 , ne2 , ...], denoted as nei →e nej , iff i < j. An execution path [n0 , ne1 , ne2 , ...] is said to be compliant with the data flow iff ∀e = (ni , nj ) ∈ E : ni →e nj or ni ∈ / Ne or nj ∈ / Ne ; and analogously the execution path is compliant with the control flow iff ∀f = (ni , nj ) ∈ F : ni →e nj or ni ∈ / Ne or nj ∈ / Ne . Furthermore, we restrict data dependency paths such that ni cannot depend on nj (i.e., nj →d ni ) with nj ∈ Nck for some condition ck , unless ni ∈ Nck – we refer to this property the conditional execution rule. A P G consists essentially of two directed acyclic graphs (DAGs), one for the control flow (N, F ) and one for the data flow (N, E), extended with the notion of conditions. The two graphs share the set of nodes and conditions, but have separate sets of edges. Definition 4.2. A P G = (N, E, F, C) is called correct iff the following properties hold: — There are no violations of the conditional execution rule in P G. — The data flow graph (N, E) is cycle-free. — The data flow graph (N, E) is not contradictory to the control flow graph (N, F ), i.e., every control flow-compliant execution path is also data flow-compliant in P G. The verification problems arising from the need to ensure correctness in a P G are the following: (1) Would adding a new data dependency introduce a violation of the conditional execution rule? (2) Would adding a new data dependency introduce a data flow cycle? ACM Transactions on the Web, Vol. V, No. N, Article A, Publication date: January YYYY.
A:15
(3) Would adding a new data dependency make the data flow graph contradictory to the control flow? (4) How to re-order the control flow to resolve a contradiction with the data flow graph? (5) Does an existing process violate the conditional execution rule? (6) Does an existing process contain a data flow cycle? Problems 1 - 4 arise during editing, Problems 5 and 6 arise when loading or saving a process. Since all problems arise during interactions with the modeler, their respective solutions should be efficient. We now discuss each problem in more detail, and give a solution with polynomial runtime (over the P G size). While vast literature on process verification exists, due to the restrictions in our approach we can solve the problems with standard graph algorithms. Problem 1 arises when the user wants to add a new data dependency, say from ni to nj . The question is, will adding this dependency violate the conditional execution rule, assuming it has not been violated as yet? This question can be answered easily by checking if ∃ck ∈ C : ni ∈ Nck and nj ∈ / Nck . This is a simple look-up, which can be done in O(1). Problem 2 arises also when the user wants to add a new data dependency, say from ni to nj . The question is, will adding this dependency introduce a cycle, assuming none exists as yet? This can be answered by checking if a dependency path exists from nj →d ni . If so, adding this new dependency will close a loop. Path existence can be checked with breadth-first search, running in O(|N | + |E|). Problem 3 relates to verifying if every control flow-compliant execution path is also data flow-compliant. If there are no conditions, the control flow has exactly one execution path. If, however, there are conditions, and assuming the conditional execution rule has not been violated, for every ci any n ∈ Nci is either a leaf node in the data flow graph in P G (has no outgoing data edges) or only has outgoing data edges to other n0 ∈ Nci . This follows directly from the conditional execution rule: a node n0 cannot depend on another node n that is subject to a condition, unless n0 is also subject to that condition. Therefore, the nodes that are subject to one condition have no influence on any other nodes in the data flow graph. Contradictions between control and data flow can hence only arise between nodes that have the same condition, or nodes that have no condition, or nodes with a condition which depend on nodes with no condition; they cannot arise from interactions of nodes with different conditions. Therefore, all contradictions that may arise in some execution path, will also arise when all conditions are true. Hence it is sufficient to check whether the single execution path given by the control flow with all conditions being true, is a data flow-compliant execution path in P G. This can be done as follows: initially all nodes are unmarked, except for the start node; then we iterate through the nodes, in the order given by the execution path from the control flow with all conditions true, where we check if all incoming edges of the current node are satisfied, i.e., if the source of each incoming edge of the current node is marked. If not, we have a contradiction and end the procedure; if yes, we mark the current node. If no contradiction is found when reaching the end of the execution path, then none exists. This check can be done in O(|N | + |E|), as every node and edge is visited exactly once. Problem 4 concerns the re-ordering of the control flow in the case of a contradiction with the data flow, and can be solved using topological sort over the graph. See section 22.4 in [Cormen et al. 2001] for an algorithm that runs in O(|N | + |E|). Problem 5 poses the question if any edge in a given process violates the conditional execution rule. This can be answered by checking if ∃e = (ni , nj ) ∈ E ∃ck ∈ C : ni ∈ Nck and nj ∈ / Nck , in O(|E|). ACM Transactions on the Web, Vol. V, No. N, Article A, Publication date: January YYYY.
A:16
Problem 6 can be analyzed by computing the transitive closure of the graph, e.g., with an adjacency-matrix. A loop exists if any edge can be reached from itself. The runtime is around O(|N |3 ); see chapter 25 in [Cormen et al. 2001] for details. 5. CODE GENERATION FOR PROCESS EXECUTION
The domain expert having to do a set of tasks repetitively over and over again can create a process for this set of tasks, given there is a Web service for all of the required functionality.8 The process can then be executed instead of triggering the tasks individually. The process model created by the user can be turned into an executable process by automatically generating WS-BPEL9 code. Before the code is generated, the process is parallelized, as described next. 5.1. Data Flow-based Parallelization
When desired by the user, our approach can parallelize steps in the process based on the data flow, by ignoring additional constraints from the control flow. In terms of the graph formalization from Section 4.5, the problem is how to generate a nonredundant data flow graph – i.e. without direct dependency links where transitive links exist. Formally, the aim is to remove any redundant edge in the graph, i.e., create P G0 := (N, E 0 , F, C) from P G = (N, E, F, C), such that (i) for any pair ni , nj ∈ N we have (ni →d nj ) ⇔ (ni →d0 nj ), where →d0 refers to a data dependency path in P G0 ; and (ii) E 0 is minimal, i.e., removing any edge from E 0 would violate (i). This problem can be solved by computing the so-called transitive reduction of P G [Aho et al. 1972], which can be done in O(|N |3 ) [Aho et al. 1972; Cormen et al. 2001]. In the running example from Fig. 1, the steps “Find news data” and “Find performance data” are not linked by a data dependency, and hence can be done in parallel. 5.2. WS-BPEL Generation
While compositions in our approach could be translated to any execution language, we choose to use the mature standard WS-BPEL, due to publicly available tooling such as Intalio|BPMS10 . Our tool generates both the WS-BPEL code and the Web forms that are displayed to the process user. The generation of the latter are explained below; Web forms are created in a format proprietary to the Intalio|BPMS Server environment. The parallelized data flow graph is translated to WS-BPEL as follows. Each node of the graph translates to a sequence element, containing two assign activities for the input and output data mapping, and in between, one invoke activity that calls the respective Web service. A flow in WS-BPEL enables parallel execution of all its contents, which can be partially ordered by link elements. Thus, all the sequences from the nodes are added to one flow element, and each data flow edge from the respective graph creates a link within the flow from and to the sequences corresponding to the respective nodes of the graph. Since a link is only introduced for each data flow dependency, and because the graph is non-redundant with respect to them, the resulting WS-BPEL process allows for parallel execution wherever no dependencies exist. If multiple links have the same target, the execution engine will wait for all of them to complete before executing the target element, which is the implicit join behavior in WS-BPEL. 8 Where
the required functionality is not available as a Web service but a Web site, a service wrapper can be built [Huy et al. 2005] – this is not within the scope of our approach, and may require involving programmers. 9 Web Services Business Process Execution Language (WS-BPEL), http://www.oasis-open.org/ committees/wsbpel/ 10 http://www.intalio.com/bpms
ACM Transactions on the Web, Vol. V, No. N, Article A, Publication date: January YYYY.
A:17
As a root of the process structure, there is a sequence element with a receive as the initial activity, where a message with the consolidated input data is expected (from the generated Web form). After the receive, an assign activity initializes all message variables. This is followed by the above-explained flow element. The flow is followed by a response activity, which sends the consolidated output to the respective Web form in Intalio. 5.3. Process Input and Output
The goal of modeling a process in our approach is to automate the execution of repetitive tasks. All process-static data can be statically assigned in the process model. All process-instance-specific data should be entered only once per instance, even if used by multiple services. In our example process, instead of manually triggering all steps individually, once all instance-specific data is entered, the process can complete without further user interaction. In order to determine the necessary input for the process, our solution combines all inputs for all services, and removes any field which is the target of a mapping or static assignment. The result forms a message with the consolidated input data format to start the process. For this message, we generate a Web form, where the user can enter the information and trigger an instance of the process. Analogously, the outputs of all services are consolidated to one output message of the process, for which again a Web form is created. In the running example, the input to the analysis process will e.g., only have fields for the date range once, due to the input-input mapping; and no field for parameters of the statistical analysis, as they are assigned statically. The output Web form in the example contains a link to a Web page with the visualization. Conditions from the control flow are in free text, and are included in the input message and input form of the process. For instance, the condition “If index data should be compared” is included as the question “Index data should be compared?” in the form, and an according Boolean data field in the message. The value of this field decides if the respective Web services are called or skipped. 6. ARCHITECTURE AND IMPLEMENTATION
Before explaining the prototype’s implementation, we give a more detailed explanation of the architecture. 6.1. Architecture
In order to allow domain experts to use the system without any upfront installation, FormSys Process Designer is implemented entirely as a Web application. The architecture – depicted in Fig. 9, a more detailed view of Fig. 2 – comprises the following components: — The process design environment for domain experts: — The front-end, through which the user controls the tool. — A back-end, which handles most interactions with other components, including Web service calls during simulation. — A database for persisting the process models. — Services for process verification and code generation. Note that the front-end interacts with the verification service directly. — A repository containing meta-data about services: — A front-end through which users can register new services and search for, edit, and delete existing ones. ACM Transactions on the Web, Vol. V, No. N, Article A, Publication date: January YYYY.
A:18 FormSys Process Designer Process owner
Service Repository
Process Management Front-end
Process Management Back-end
Code Generation Service
Process Verification Service
Service owner
Repository Front-end
Repository Service Process Model Database Repository Database
Process Execution Process user
Runtime Front-end
Runtime Execution Engine
Web Service Web Service Web Service Runtime Runtime Runtime
Legend Data exchange
Logical association
Component
Database
User type
Fig. 9. Architecture of FormSys Process Designer and related components.
— A repository service, which offers the repository’s functionalities to other components. In particular, the process management back-end uses the service for listing, searching, and retrieving information about available services. — A database for storing the service meta-data, including the additional data required by our approach (icons, forms, etc.). — A runtime process execution environment with a front-end through which process users can start new instances and retrieve notifications about completed instances; and an execution engine for enacting the service orchestrations.11 — A number of external Web services, which are represented in the repository and invoked from the runtime. 6.2. Implementation
The implementation builds on our previous tool, FormSys Process Designer [Weber et al. 2010b], but is a significant extension of it. In fact, the lines of code more than doubled from the previous version, and so has the number of database tables. FormSys Process Designer is coded in PHP, using the Symfony framework12 and JavaScript with various libraries. A screencast video of the tool in action is available (see Footnote 3). In contrast, the Service Repository is implemented as an extensive extension of FormSys Forms Manager (previously called FormSys, [Weber et al. 2010a]) and coded in Java, JSP and JavaScript. The remainder of the paper, including the evaluation, focuses on FormSys Process Designer. Our tool has several UI screens, i.e., interactive Web pages, the most important of which is the process modeling part. The top of that page (shown in Fig. 10) contains fields for standard header information for a process – name, owner, description – fol11 Currently,
the Intalio|BPMS suite serves this purpose, including the front-end. This choice requires FSPD to produce two Web forms in a proprietary format: one for process input and one for process output. 12 http://www.symfony-project.org
ACM Transactions on the Web, Vol. V, No. N, Article A, Publication date: January YYYY.
A:19
Fig. 10. The Process Designer, upper part: header fields and content flow
lowed by buttons for saving and deploying the process. Below that is a content flow area, inspired by popular music player programs, which shows the icons and names for all services in the repository. Above the content flow, there is a search button for the respective dialog, where services can be searched by name. When a service is selected in the search, the content flow jumps to the respective icon. The lower part of the modeling page contains areas for modeling control flow, labeled “Process Steps” and shown in Fig. 6, and data flow, labeled “Data Mappings” and shown in Fig. 7. Services are added by drag-and-dropping icons from the content flow into the control flow area. The icons can be re-arranged once placed in the control flow and conditions can be added. When dragging a service icon into the “Data Mapping” area, the modeler is asked whether she wants to map the input or output message of the respective service – given both exist. The form of the chosen message is then loaded and displayed, where the fields in the message are highlighted as an overlay of HTML boxes, and mappings can be specified as described in Section 4.2. The verification described in Section 4.5 is enforced in the tool. To achieve this for Problems 1 - 4, JavaScript code transforms the mappings and sequence into data and control flow graph structures, respectively, and runs the algorithms, e.g., for detecting when a user would model a circular dependency. The data flow parallelization from Section 5.1 has been implemented in a similar way. ACM Transactions on the Web, Vol. V, No. N, Article A, Publication date: January YYYY.
A:20 7. EVALUATION 7.1. Evaluation Objectives
To test our approach and tool, we conducted a user study. With this study experiment we wanted to evaluate the truth of the following hypotheses:13 (1) FormSys Process Designer (FSPD) is usable with little training effort, to: (a) enable domain experts to model executable processes (b) increase the efficiency of technical personnel in designing Web service compositions, in comparison to traditional tools (2) The features offered in FSPD are useful and comprehensible: (a) forms-based modeling of control flow (b) forms-based modeling of data flow (c) conditional execution (d) code generation for execution with parallelization (e) automatic verification The experiment was conducted in a controlled environment (in vitro), to study the artifact (the approach via its implementation) with respect to certain qualities [Hevner et al. 2004]. This type of experiment is also called Synthetic Environment Experiments in software engineering research [Zelkowitz and Wallace 1998]. The potential weakness of such an experiment is that it may abstract too much from the real environment in order to fit into a small time window [Zelkowitz and Wallace 1998]. However, in contrast to long development cycles in software engineering, our case targets settings where the processes are small enough to be modeled in minutes or hours. Other threats to the validity of our experiment are discussed in Section 8.1. 7.2. Experiment Setup
Participants were recruited from different backgrounds, with a focus on our approach and the domain (financial data analysis) being tested. Thus, some participants had a stronger technical expertise in computing, some had finance domain expertise, and some both. 7.2.1. Experiment Sessions. In a separate session for each participant, the participant was instructed in the usage of the tool through a presentation of a fixed set of slides. Also, an overview of the use case services was given. To complete the training, the participant was asked to model a small process for familiarizing himself/herself with the tool – here he/she could ask questions to be answered by the conductor of the study. Then the participant received two evaluation tasks which had to be completed using the tool, without support about the tool from the conductor of the study14 . During the evaluation tasks, support about FormSys Process Designer was only available through a user manual and help pages within the tool. While the training task was essentially a “click-through instruction”, the two evaluation tasks were described in much more compact form, on a conceptual goal level. This was done to simulate the situation where a user wants to achieve a certain analysis, so the participants had to find the way to the solution by themselves.
13 Below,
we will refer to those hypotheses and sub-hypotheses as HXy, e.g., H1a for the enablement of domain experts. 14 Due to the unfamiliarity of some of the participants with the services used in the tasks, questions about the finance domain or the services were answered. Questions about FormSys Process Designer were not answered.
ACM Transactions on the Web, Vol. V, No. N, Article A, Publication date: January YYYY.
A:21
Whilst the two evaluation tasks were completed, the voice track was recorded15 and the researchers took notes of their observations in a semi-structured form. The time for solving each task was recorded as well. The two evaluation tasks were given to participants in alternating order, such as to control for any learning effect from one task to the next. If the participant was unable to solve a task, the experiment was aborted. Finally, each participant was asked to fill in a questionnaire. 7.2.2. Questionnaire. The questionnaire was split into four areas: background, user interface, functionality, and improvements. Most questions asked the user for a rating on a 5-point scale, ranging from very poor (1) to excellent (5). The three background questions asked for (i) technical expertise and training (classroom or learning-by-doing), specifically with regard to computing and programming; (ii) service composition expertise (classroom or learning-by-doing); and (iii) familiarity with the domain of financial data analysis (in general, as well as with regards to the particular services used ). The user interface part asked participants for their rating of the following properties16 of the tool: consistency, ease of site navigation, access to help functionality, intuitiveness, visibility of system status, aesthetic and minimalist design, user control and freedom, error handling, recognition rather than recall, flexibility and efficiency of use, overall look and feel. Each property was explained with an additional sentence. The functionality part started with three questions to determine how easy it was to complete the various tasks (training task and evaluation tasks 1 and 2)? Then, for each tested feature, there were two questions: “How well did you understand what [feature X] does?” and “How useful was [feature X] when you encountered it?” For features not encountered by the participant, he/she was asked to skip these two questions. As a last functionality question, the user was asked “Would you use the system if it was publicly available?”, with yes/no as possible answers. Finally there were two open improvements questions, to be answered in text fields: “How would you improve the system?” and “Any other comments?”. 7.2.3. Post-experiment. After the session, the researchers checked the process models and instances created by the participant, to see if the tasks were indeed solved correctly. Task 1 asked for retrieving stock data from a database, aggregating it into a compact format, computing the daily volatility of the stock prices, and visualizing the volatility. As a final step, a condition had to be annotated to the visualization: only if true, the visualization would be shown. A correct solution was a sequence of four services with appropriate data mappings. For Task 2, news and stock price data had to be retrieved, the stock prices aggregated into a compact format, the two data sets had to be merged and the result visualized. A correct solution here consisted of five tasks. These tasks did not form a strict sequence, since the merge operation requires data from two other services (comparable to an AND join in other process modeling languages). Since all tasks involved retrieving some raw data, processing and visualizing it, a task was taken to be solved if the composition was valid, and an instance of the process returned a visualization that was a reasonable match to the problem as described in the task explanation.
15 The
participants were asked to “think aloud”, but this was not enforced and yielded little information over the observations by the researchers. 16 These questions were inspired by the “usability heuristics” from [Nielsen 1994].
ACM Transactions on the Web, Vol. V, No. N, Article A, Publication date: January YYYY.
A:22 7.2.4. Comparison with a Third-party Tool. As argued in the introduction, when using common BPMSs for process automation, they are comparable with IDEs in terms of the assumed knowledge – BPMSs offer a specialized type of programming. In this sense, FSPD offers a specialized type of EUP. Much as one would not expect a domain expert to be able to use a common IDE, we did not expect many of our participants to be knowledgeable in using a traditional BPMS. Therefore, we asked the participants if they (i) had expertise with a third-party Web service composition tool, and (ii) if they could spare the time (usually more than 3 hours) to complete the evaluation tasks in the tool of their choice. Due to the previous expertise in using Intalio|BPMS Designer10 of the people willing to complete the comparison experiment, this is the tool with which we compare FormSys Process Designer in this part of the study. According to Intalio itself, “Intalio|BPMS is the world’s most widely deployed Business Process Management System (BPMS).”17 This matches the comparison sought after in H1b, i.e., FSPD vs. a traditional BPMS tool. Using Intalio here offered two more advantages: first, the results are directly comparable (since FSPD uses Intalio’s runtime component for process execution); and second, the services could be used as is, i.e., with the same interface – this would not have been possible in e.g., Yahoo! Pipes, since that tool has no native support for SOAP/WSDL Web services. Finally, Intalio uses Business Process Model and Notation (BPMN, [OMG 2011]) as a model representation – arguably a business user-friendly notation – but enriches the notation with proprietary mechanisms to obtain executable service compositions. 7.2.5. Participant Groups. The study was conducted with a total of 14 participants, all residing in Sydney, Australia. Based on their answers to the background questions – see Fig. 11 – we split the participants into groups:
5.0 4.5 4.0 3.5 3.0 2.5 2.0 1.5 1.0
Technical expertise Service composition expertise Familiarity with the domain Tech.
Gen.
Fin.
Fig. 11. Survey expertise answers, by expertise groups.
— Technical experts (4 participants): users with a self-rating of 4 or 5 in technical or service composition expertise, and a rating of at least two points less in finance (abbreviated as Tech.) — Finance experts (6 participants): users with a self-rating of 4 or 5 in financial expertise, but at least two points less in technical or service composition (abbreviated as Fin.) — Generalists (4 participants): all other participants (abbreviated as Gen.); all of them self-rated their skills between 3 and 5 in each background question, and can thus be seen as technical and finance experts. 17 From
http://www.intalio.com/bpms, accessed 9/5/2012.
ACM Transactions on the Web, Vol. V, No. N, Article A, Publication date: January YYYY.
A:23 7.3. Experiment Results
Based on the data collected during the experiment, we try to prove or disprove the hypotheses from Section 7.1 below. H1 is evaluated via quality of the solution artifacts (H1a, were the tasks solved?) and the time taken (H1b, FormSys Process Designer vs. a third-party tool). Hypothesis 2 is evaluated from respective questions in the questionnaire – “Did you encounter [feature X]? How well did you understand what [feature X] does? How useful was [feature X] when you encountered it?” – as well as from the observations and participants’ comments. 7.3.1. Evaluation of Hypothesis H1a. H1a assumes that domain experts can solve tasks in our experiment design. Fig. 12 shows the percentage of solved, unsolved and, for the sake of completeness, unattempted18 tasks, split by expertise group. 100% 90% 80% 70% 60% 50% 40% 30% 20% 10% 0%
Solved
Not solved Not attempted
Tech.
Gen.
Fin.
Fig. 12. Percentage of tasks solved, by expertise.
As can be seen from the figure, a greater portion of tasks attempted by the groups of technical experts and generalists were solved correctly (7 out of 8, or 87.5%) than those attempted by financial domain experts (7 out of 10, 70%). (Note that the number of observations here is too low to obtain statistically significant results.) However, most of the domain experts were indeed able to solve tasks: 2 out of 6 finance experts did not solve any task (attempting only the first), 1 finance expert completed 1 task, and 3 finance experts completed both tasks successfully. Adding technical knowledge to the domain expertise, the generalists were indeed able to solve most tasks: 3 out of 4 completed both tasks, 1 generalist solved 1 task. The same distribution applies to the technical experts. Considering only the tasks that were completed successfully, the times taken are shown in Fig. 13. One outlier stands out, causing the upper limits (top horizontal bar) of “Task 1” and “Fin.” to end at 1h 16min. Besides that, Fig. 13(a) indicates that evaluation Task 1, volatility, (see Section 7.2.3) was on average solved faster (median: 23.5 min) than evaluation Task 2 (news & prices, median 32.7 min) – however, a twotailed t-test revealed no statistically significant difference. From Fig. 13(b) we observe that technical experts and generalists took comparable times: while technical experts achieved a lower mean, generalists had less “long” outliers. However, financial experts seem to have taken more time to solve the tasks than the other two groups. Therefore, using a probability threshold of 5%, we conducted a t-test assuming equal variance – see Table I. Given our observations, the likelihood of equal mean modeling time for the sets of (financial experts) vs. (generalists and technical experts) was around 1% – i.e., the result that financial experts took longer is statistically significant. 18 2
participants failed to solve the first evaluation task already and were out of time, so the second one was not attempted.
ACM Transactions on the Web, Vol. V, No. N, Article A, Publication date: January YYYY.
A:24 Evaluation task
Expertise Gen.
Task 2: News & Prices
1:26
1:26
1:12
1:12
Time (h:mm, success only)
Time (h:mm, success only)
Task 1: Volatiliy
0:57
0:43
0:28
Fin.
0:57
0:43
0:28
0:14
0:14
0:00
0:00
(a) Time grouped by task.
Tech.
(b) Time grouped by expertise.
Fig. 13. Distribution of time (hours : minutes) taken to successfully complete evaluation tasks. Table I. t-test for time difference based on expertise Mean Variance Observations
Fin. 0.70h 0.10 7
Gen. + Tech. 0.45h 0.017 14
df t Stat p(T 6= t) t Critical one-tail Reject alt. hypothesis
19 2.61 0.00861 1.73 Yes
Discussion, H1a. The results indicate that participants with a stronger technical background found it easier to use our tool and solved the tasks quicker. Nevertheless, most financial experts were able to solve tasks. Whilst chatting with the participants after the experiment, some of them gave us the feedback that once they overcame an initial barrier and “got the hang of it”, they were able to solve the tasks and felt confident about using the tool. 7.3.2. Evaluation of Hypothesis H1b. H1b states that technical personnel can design Web service compositions more efficiently when using FormSys Process Designer. Most participants of the general study chose not to take part in the comparative experiment, due to lack of time or expertise, and hence only completed the study with FormSys Process Designer. However, we were able to observe a total of 5 compositions from 3 different people.19 These 5 compositions were designed by generalists and technical experts using Intalio|BPMS Designer (see Section 7.2.4). The times taken using Intalio were for the compositions only: no process input/output forms were created. To account for this effect, we experimented ourselves how long it took to create the input/output forms, and found that we usually needed around 30 minutes. To be conservative, we added only 15 minutes to the times to complete compositions in Intalio. These amended times were compared against all times of successful creation by generalists and technical experts using FormSys. 19 The
experiment was stopped after these 5 observations: it was perceived to be a quite tedious exercise, and statistically significant evidence was collected already with these 5 observations.
ACM Transactions on the Web, Vol. V, No. N, Article A, Publication date: January YYYY.
A:25
For H1b, we want to show that building processes with FormSys is faster than with Intalio, for technical experts and generalists. In the chosen methodology, we formulate the null hypothesis as the opposite of what we want to show, and then disprove it. The null hypothesis, H1b0 , is therefore that composing processes in FormSys and Intalio takes a similar amount of time. As above, we conducted a t-test with a probability threshold of 5%, however now assuming unequal variance – see Table II. The result was that – given our observations – the likelihood of H1b0 (equal mean modeling time) was around 1%. Therefore, we could safely reject the null hypothesis, H1b0 , and showed the truth of H1b for the case of comparison with Intalio|BPMS Designer. Table II. t-test for Hypothesis H1b Mean Variance Observations
FormSys 0.45h 0.017 14
Intalio 1.77h 0.64 5
df t Stat p(T 6= t) t Critical one-tail Reject alt. hypothesis H1b0
4 -3.68 0.0106 2.13 Yes
Discussion, H1b. It should be noted that the times in Intalio benefited from a learning curve: the test using Intalio was done only after the same process had been composed in FormSys Process Designer already. Therefore, the control and data flow were known already in full detail. The comparative experiment focused on one third-party tool only, Intalio|BPMS Designer. Due to the very high number of existing Web service composition tools, as well as project-based constraints, a more exhaustive comparative experiment was out of scope for this work. However, given the stark differences in times (means of 0.45h (26.8 minutes) against 1.77h (106.1 minutes)), we postulate that it is unlikely to observe fundamental differences when comparing tools similar to Intalio with FormSys Process Designer. The gain in efficiency comes of course at the price of reduced expressivity, as mentioned above and discussed in detail in Section 8.3. 7.3.3. Evaluation of Hypothesis 2. H2 states that the main features offered by FormSys Process Designer are useful and comprehensible. We tested this hypothesis through asking respective questions in the survey participants filled in after addressing the tasks. In particular, we asked for each feature (given the participant encountered it) if the participant understood what it did, and how helpful it was in their opinion. This was done for the general composition method, the data mapping, the conditions, the translation, the search and the verification. Search was used only by few participants, and the number of responses was too low to report. For the other features, Fig. 14 shows the mean of the responses from all participants. The mean score for all questions in Fig. 14 is above the neutral value of 3. However, notably the data mapping feature scored lowest, relative to the other features. A detailed analysis of the textual comments indicated that, in terms of data mappings, participants primarily struggled with (i) the colors being used for mappings were perceived as becoming too similar at times; and (ii) it was hard to correct data mappings after creating them, as the tool offers no overview of the fields and forms that participate in a given mapping. Discussion, H2. We observed that most participants who failed to solve a task still managed to create the control flow and to deploy the process. The problems that kept these participants from solving tasks were usually to be found in the data mappings. The results from our study thus indicate that H2a, H2c, and H2d are true: forms-based control flow modeling, conditional execution, and code generation in FormSys Process Designer are useful and comprehensible. The forms-based modeling of data flow in FormSys Process Designer was where the users struggled most – a finding which is in ACM Transactions on the Web, Vol. V, No. N, Article A, Publication date: January YYYY.
A:26 5.0 4.5 4.0 3.5 3.0
Understandable
2.5
Helpful
2.0 1.5 1.0
Composition Data mapping method
Conditions
Translation
Verification
Fig. 14. Survey answers for the feature understandability and helpfulness – rated on a 5-point scale (1 being worst, 5 being best).
line with the findings of a recent study on common mistakes in Yahoo! Pipes [Stolee and Elbaum 2011]. 7.3.4. Usability and Miscellaneous Results. Fig. 15 shows questionnaire answers, grouped by the number of successfully solved tasks. Besides the actual values, the figure shows that completely unsuccessful participants gave much lower scores than the other participants. This is also the case for understandability / helpfulness questions (not shown here) – i.e., the scores given by at least partly successful participants were higher than the averages shown in Fig. 14. 5.0
Average Score
4.5 4.0 3.5
2 tasks solved 1 task solved 0 tasks solved
3.0 2.5
2.0 1.5 1.0
Question
Fig. 15. Survey answers, grouped by the number of correct compositions produced.
As for the usability questions, the average scores in all categories were above the neutral value of 3.20 By comparison, the score for “error handling” is the lowest, fol20 Note,
that the group solving 2 tasks correctly consisted of 9 participants, 3 participants solved 1 task each, and 2 participants solved 0 tasks.
ACM Transactions on the Web, Vol. V, No. N, Article A, Publication date: January YYYY.
A:27
lowed by “user control and freedom” and “recognition rather than recall”. This is consistent with the results discussed for H2 above. The average scores also show that Task 2 (news & prices) was perceived to be harder than Task 1 (volatility). This is in line with the times shown in Fig. 13(a) and the insession observations of the researchers. The last column in Fig. 15 shows the answers to the question “Would you use the system if it was publicly available?” For the purposes of comparison in the graph, “yes” answers were counted as value 5, and “no” as value 1 (the lowest possible value for all other questions). Most notably, all participants who solved at least one task answered “yes”. From the in-session observations we noted the following: — Terminology and language caused a number of issues. One participant (not a native speaker of English) actually struggled with the English vocabulary being used. Some non-technical participants were misled by the terms “input” and “output”: while the study material used these terms on the level of services, they can be understood on the process level, too – an import service can thus be seen as “input” to the process, a visualization as “output”. Three participants struggled with the setup of the user manual – which was written to be read as a text, not as a troubleshooting manual – but eventually managed to find the information they were looking for. A number of participants struggled with the task descriptions. For instance, one participant replicated the training task step-by-step, because the description of evaluation task 1 asked to create a variation of the training task. The participant only realized later that the result could have been obtained in a fraction of the time. Another participant misunderstood the task description and thought that merging data sets could be done in the data mapping, where a specialized service is needed. — Two participants were rather quick in solving the tasks (the fastest one needed 5 / 13 minutes for Tasks 1 / 2, respectively). After getting the compositions to work, they spend up to twice that amount of time to polish and perfect the compositions. — Debugging incorrect data mappings was the hardest task for the participants – to quote three participants’ comments: “hard to undo mistakes in data mapping”; “I reckon it would be great if we have a section that shows existing data mapping in the process.”; “I cannot see an overview of all the mappings I have done”. In 5 cases, participants felt the need to circumvent modeling difficulties by deleting all mappings or by discarding the model altogether and starting from scratch. In many cases, the participants achieved a correct control flow fairly quickly, but took quite a while longer to get the data mappings and all parameters right. The services required specific character strings as input to produce the right outputs – e.g., “ClsPrice” for closing price. Thus, typos or forgotten inputs in executing a composition often led to problems, which did not always trigger meaningful error messages. In two cases, participants tried to “fix” such errors by changing (and breaking) an already correct composition. — The training task was a click-through instruction, and thus very detailed. The evaluation tasks were described rather compactly, and participants struggled with applying their training there – to quote a participant: “I found it hard to get started with using the program, the training was not sufficient enough”. However, once the participants realized how everything was connected, they were able to use the tool efficiently – to quote a comment: “Overall, the system is quite user-friendly. I find it easy to use, once I have gained experience with it.” This learning effect often took place during the first evaluation task: after struggling but eventually succeeding with the evaluation task posed first, the task posed second was often completed in a smoother fashion. ACM Transactions on the Web, Vol. V, No. N, Article A, Publication date: January YYYY.
A:28
Finally, we want to quote a few of the comments given by users at the end of the questionnaire. One unsuccessful user stated that the tool “needs to be intuitive for domain people rather than IT people”. Another user found the tool “not directly intuitive for a non-technical person who has domain knowledge”. More positive comments included: “In general it was impressive”; “For a user familiar with the underlying services, the system does a fantastic job as it reduces the time and expertise it takes to build a process.” 8. DISCUSSION 8.1. Threats to Validity
In the following, we discuss internal, statistical, and external threats to the validity of our user study. We also clarify how we addressed the potential threats. — Internal validity concerns the degree of validity of statements about cause-effect inferences. — Maturation. Knowledge obtained by completing one task may improve participants’ performance on the next. In our experiment, this threat is minimized by alternating the order in which the participants were asked to complete Tasks 1 and 2, from participant to participant. For the comparison with Intalio’s modeling tool, alternation was not feasible: participants volunteering to also model processes in Intalio first completed the FSPD part of the study, so that the observation of them is comparable to the participants who did not do the Intalio part. Hence, any learning effect from FSPD helped in completing the respective tasks in Intalio – potentially leading to faster task completion in Intalio. However, the times taken in Intalio were still significantly longer than the times spent in FSPD. — Participant selection bias. Participation was entirely voluntary, but was incentivised with nominal financial reward and participation in the draw of a main prize. This likely resulted in rather curious and intrinsically motivated individuals participating. While the selection is not by random sampling from a pool of potentially interested users, the above-mentioned characteristics may also be found in early adopters of new tools. Finally, the complete voluntariness of participation also hints at participants’ willingness to use such a tool, or at least their curiosity towards the technology. — Participant skills. We did not assess skill levels independently, reporting only the answers to participants’ skill self rating. Further, the participants’ qualification to answer the questionnaire has been criticized after the study, specifically that the user interface part of the questionnaire is based on the usability heuristics from [Nielsen 1994]. The original purpose of these heuristics was to guide experts in detailed analyses. While participants may have found these questions overwhelming, we received no indication in this direction from them. In fact, the answers were diverse, as observable from Fig. 11. — Experimenter bias. The authors of this paper designed FSPD and conducted the sessions with the user study participants themselves. The study was, to a degree, designed to minimize the effects of this bias, by deliberately testing also the boundaries of the tool, by using third-party services and analysis processes, and by stating to the participants that not they were being tested, but the tool. However, the complete absence of an unconscious bias of the researchers cannot be ruled out. — Learning curve in experimenters. From one session to the next, the researchers saw which parts of the training were more effective than others, and with which parts of the tool participants struggled. The training and tasks were fixed beACM Transactions on the Web, Vol. V, No. N, Article A, Publication date: January YYYY.
A:29
forehand, and always conducted based on the same artifacts (i.e., the training slide deck, the task descriptions, and the questionnaire) to minimize influence on the sessions over time. As in the previous point, complete absence of unconscious learning effects cannot be guaranteed. — Time pressure. There was no fixed time limit for sessions. However, it cannot be ruled out that participants’ performance was impacted by the need to eventually complete and get back to their regular work. One participant had a time conflict with their babysitter, and thus was rather hurried towards the end of the session – yet managed to complete the tasks successfully. While time pressure is likely to be present in practical settings as well, this may have impacted the way in which the tasks were completed and the questionnaire was answered. — Statistical validity basically refers to the degree with which the statistical methods are interpreted and applied correctly (e.g., not violating assumptions of a statistical test). The main threat encountered in this experiment concerns the sample size. The study involved 14 participants, which we split into three different groups as explained in Section 7.2.5. The number of data points collected for each group is hence limited; a larger study was out of scope for our current project and the available time frame for the research. Hence, the results should not be taken as fully conclusive. In particular, Fig. 11 reports on answers grouped by the number of correctly solved tasks. Here, the sample basis is particularly small (e.g., only 2 participants solved 0 tasks). — External validity is the question if the results of the study will hold in practice. While this has not been the subject of our study, we took care to design the study to mimic realistic conditions (also referred to as ecological validity). As mentioned above, the services and to-be-composed analysis processes over the services were obtained from an industry partner. Whether the participants would behave differently outside the lab environment, and how so, is impossible to tell. Further, it is hard to assess if the tested composition problems generalize to other practical settings. 8.2. Discussion of User Study Results
There are a number of threats to validity as per above, and the results from our study can hence not be taken as fully conclusive. However, they point to a number of trends: — The observations from the study support the hypotheses H1a, H1b, H2a, H2c, H2d. In contrast, H2b, the understandability and usefulness of the forms-based data flow modeling, would benefit from further improvement. — The short time frame for training seemed to be sufficient for 12 out of 14 participants to successfully complete at least one of the tasks. Improving all portions of text shown to the user (training, descriptions of tasks, user manual, online help within the tool, confirmation / error messages) would likely increase the usability. At the current stage, these have all been produced by the developers of the tool – technical researchers by training. In our observations we found that participants with a nontechnical background struggled particularly in understanding these texts, which should therefore be improved. — Our participant recruitment strategy deliberately aimed to test the boundaries of expertise needed to successfully complete tasks: what is the minimal technical expertise required to successfully use the tool? (Interestingly, prior expertise in service composition directly seemed to be no indicator for success probability.) — From the observations we draw the preliminary conclusion that domain experts with some technical knowledge and interest are able to successfully use our tool; however, more technical expertise is useful for achieving results quicker and more reliably. On the flip side, technical experts who lack domain knowledge may still ACM Transactions on the Web, Vol. V, No. N, Article A, Publication date: January YYYY.
A:30
struggle (see also [Jeong et al. 2009]): while our tool may make understanding unknown services easier through human-legible naming, explanations, and default values for fields, this may not be enough for a modeler lacking basic domain knowledge. 8.3. Discussion of the Control Flow Expressiveness
As stated throughout the paper, the presented approach aims at end-user-friendliness by restriction of the modelling language expressivity: rather than a language that can cover any situation in a business process (but requires BPM expert knowledge), our approach provides a restricted language usable by domain experts. These restrictions are discussed below: first through analyzing which “workflow patterns” are supported; then by discussing the practical importance of the supported constructs. 8.3.1. Workflow Patterns Coverage. The expressive power of process modeling approaches is often investigated by analyzing to which degree the workflow patterns are supported in a given approach [van der Aalst et al. 2003]. Generally, stronger expressive power is regarded as a positive feature of a modeling approach. However, already in their seminal paper [van der Aalst et al. 2003], van der Aalst et al. discuss the issue of suitability, i.e., that the modeling approach needs to be well suited for the problem to which it is applied. The trade-off chosen here is the attempt to achieve this suitability: achieving the simplicity required for domain experts modeling processes, without sacrificing necessary expressive power. In the following we discuss which patterns are supported by our approach to which degree. The 20 patterns in [van der Aalst et al. 2003] are split into 6 groups: basic control flow patterns, advanced branching and synchronization, structural, multiple instances, state-based, and cancellation patterns. Out of the basic control flow patterns we obviously support activity sequences (pattern 1 in [van der Aalst et al. 2003], abbreviated as P1). Parallel split P2, the parallel execution of multiple branches, and synchronization P3, the respective synchronizing join of parallel branches, are supported indirectly, through the automated parallelization (Section 5.1). Exclusive-or (XOR) split P4 is supported to a large degree, in that process branches can be executed or skipped. That means that executing either A or B needs to be handled with two separate conditional branches. However, this construct is in our opinion more naturally suited to the use cases, and easier to understand. Simple merge P5, the join corresponding to XOR split, is supported implicitly. As for the advanced branching and synchronization patterns, the multi-choice pattern P6 – also called (inclusive) OR split, where multiple branches may be executed based on the truth of their conditions – can be implemented since the XOR conditions are by default interpreted as independent. The often corresponding synchronizing merge P7 is implicitly supported as well. The more complicated join patterns (P8 and P9) are even hard to understand at first for IT professionals, and are clearly out of scope for our purposes. Out of the structural patterns, our execution semantics assume implicit termination P11, i.e., once all activities are completed, the process instance terminates. Loops P10 or multiple instantiation P12 - P15 (comparable to multiple parallel instances of the same thread) are rarely needed in the use case scenarios we focus on: data processing services inherently compute results by iterating over entries, often in the hundreds of thousands or even millions – doing so via repeated Web service invocation with current technology would be prohibitively inefficient. Nevertheless, multiple instances without synchronization P12 and multiple instances with a priori design time knowledge P13 can be implemented, by adding the same activity multiple times to a model and having the code generator parallelize them. As for the state-based patterns, deferred choice P16 – basically an XOR split where the selection is based on environmental events – ACM Transactions on the Web, Vol. V, No. N, Article A, Publication date: January YYYY.
A:31
requires the modeling of events, which we see as too advanced for many domain experts in the first iteration of our approach. The case of milestones P18 is similar, where the execution of an activity is only enabled if a certain milestone has been reached (and did not expire yet). Interleaved parallel routing P17 – the execution of a set of activities in an arbitrary order – is similar to the result of the parallelization in our approach, together with WS-BPEL’s flow semantics; however, the requirement to only execute one activity at any time is not supported. Cancellation patterns on the level of activities P19 and process instances P20 may be handled by the underlying workflow system. In our implementation (cf. Section 6) we rely on Intalio’s process server, which supports process instance cancellation through an administration console. 8.3.2. Practical Usage of Modeling Constructs. [zur Muehlen and Recker 2008] investigated the usage of the BPMN modeling elements in 120 BPMN models. Among their analyses is the occurrence frequency of BPMN constructs in these models. In the ranking of occurrence frequency, the first construct that could be supported21 by our approach, but is not, is “intermediate timer” on rank 16; it is used in less than 25% of the models. In comparison, sequence flow is used in 100% of the models. However, there is one caveat to this comparison: XOR gateways in BPMN (ranked 6) can be combined to create loops, which are unsupported in our language. The inverse question is: which share of practical models contain only models that use elements that are supported in our language? While the cluster analysis of element cooccurrence in [zur Muehlen and Recker 2008] does not quantify the answer to this question, it indicates that the most commonly used constructs are also the most highly clustered: the top 16 clusters only contain constructs that are expressible or implicit in our language; cluster 17 contains the “intermediate timer” again. Although BPMN is used for many purposes, we see the fact that most of the commonly used constructs in general-purpose process modeling are supported in our approach as an indication that the expressive power is likely to be sufficient for our purposes. Finally, we note that the PICTURE approach [Becker et al. 2007b; Becker et al. 2007a], discussed in Section 9.5, has been successfully applied in practice, in a related setting with an expressive power slightly below ours. 8.4. Discussion of Implementation Limitations
The current prototype has a number of limitations. Before we discuss these, we remark that the artifact produced by FSPD – the executable process package – can be used as input to a more heavy-weight tool. Since the main output follows the BPEL standard, many modeling tools should be able to import process models generated by FSPD. Thus, in cases where FSPD’s functionality is insufficient, a technical process modeler can take over and refine the BPEL process in the desired way. This is primarily a oneway street: the refined process cannot be re-imported into FSPD for further editing. However, once a refined BPEL process is deployed, it becomes a WSDL Web service by itself – which can be added to the FSPD service repository, and henceforth be used as a subprocess in FSPD. The remaining main limitations of the tool are the following: — Limited support for exception handling and fault messages. The current implementation handles faults as follows: (i) application-level faults are shown to the user as responses from the services (e.g., “Selected date range returned no data”); (ii) BPEL faults resulting from missing data, etc., lead to terminating the process instance af21 Pools
and lanes are of limited use in the process models considered here, and message flow is implicit in our approach.
ACM Transactions on the Web, Vol. V, No. N, Article A, Publication date: January YYYY.
A:32
ter compiling an error message for the user; (iii) other kinds of faults are handled by the BPEL engine’s default error handling mechanisms, i.e., stopping the instances with the fault and waiting for administrator action. To give some control over error handling to the modeler in FSPD, fault messages could be added as a third type of message (besides input and output messages) in FSPD. In contrast, full-fledged exception handling in its current concepts in process modeling languages might be too heavy-weight for technical domain experts. Devising user-friendly forms of exception handling is interesting future work. Approaches may include automating the definition of compensation actions, similar to [Weber et al. 2012]. — Free-text conditions. FSPD currently allows conditions in free-text form only; logical expressions, relating to time or data values cannot be stated, e.g., to skip service 2 if service 1 returns a value x > 100. Changing this aspect would require altering the formalization and verification to some degree; however, this should be straightforward, by regarding the condition as a service with certain input dependencies. Less straight-forward is the question how to design an end-user-friendly logic language. — Service discovery and selection. The implementation shows services in a content slider (see Section 6.2), and offers a rudimentary search feature. If the number of services becomes large, this is likely to cause problems: (i) scrolling through all services would become inconvenient; (ii) the current search only considers exact string matches in service names; (iii) deciding on the right service might require more information than the name and the icon. Future improvements to FSPD may thus incorporate techniques like filtering the set of shown services through a more sophisticated search (see e.g., [Benatallah et al. 2005; Roy et al. 2010]), and showing additional information about services to allow an informed selection. — Services with many fields. Having a large number of fields in a single message might make it infeasible to display them all on one form. However, in a way this is a problem of the form / UI design in the first place. Complex paper forms have multiple pages, and complex screen forms are often paginated. This method can be used in FSPD as well, and has indeed already been prepared: the lowest line of Fig. 7 shows “(1/1)” as an indication that page 1 of 1 is shown, and left/right arrows to switch pages. While the services used in the user study all were represented with one form page only, we suspect that modeling data flow over paginated forms would not make things easier for beginners. — Sharing, understanding, and testing models. In the current implementation, all models are shared between all users, as are all service entries in the repository. Sophisticated sharing techniques exist in other tools (see Sections 9.2 and 9.5), and could be ported to FSPD, also to address privacy concerns. From the user study’s results, we speculate that it should be possible to understand the control flow of models authored by others – especially if the descriptive features in FSPD are utilized. However, seeing as modelers have problems understanding data flow they modeled themselves, it seems unlikely that others than the original modeler would be able to easily understand that part of a model. A different form of reuse might be practical as well: completed process models are deployed as BPEL processes, and hence become Web services themselves. Other modelers could then reuse deployed processes as sub-processes. In terms of testing and debugging models, we suspect that the simulation mode in FSPD (see Section 4.3) will be useful – but we did not test this hypothesis in the user study. 9. RELATED WORK
Section 1 discussed our work relative to works in traditional business processes, workflows, and Web service composition. Here we present other related work. ACM Transactions on the Web, Vol. V, No. N, Article A, Publication date: January YYYY.
A:33 9.1. End User Programming
End-user programming (EUP) is a field of research, recently gaining popularity and having a similar goals to ours, although in different domain. EUP is the umbrella term for approaches that “make limited forms of programming sufficiently understandable and pleasant that end users will be willing and able to program” [Cypher et al. 2010]. Good overviews of EUP are, e.g., [Myers et al. 2006; Cypher et al. 2010]. We have adopted several ideas from EUP in our work. For instance, the two dominant paradigms in EUP [Cypher et al. 2010] are scripting languages – usually simplified programming languages – and programming by demonstration (PbD) – the user demonstrates to the programming tool what she wants to be done, and the tool interprets and generalizes the intention to formulate a program. Our approach relies on the scripting paradigm. Among the limitations of EUP are the lack of security and the lack of testing [Harrison 2004]. In our system, these are addressed as follows: — Security is (mostly) built into our system – the limitation on service composition means that users cannot create uncontrolled code. However, security here is based on the assumption that the underlying components (orchestration engine, messaging mechanisms, services, etc.) have not been compromised. — The lack of testing motivated our work on enabling process simulation in the design environment. A PbD approach in EUP that we consider closely related work is CoScripter (formerly called Koala) [Leshed et al. 2008; Little et al. 2007], which primarily focuses on personal processes in the scope of browsing and using Web applications. The user can record, play and publish/share such browser processes on a public Wiki. The processes are stored in a simple end-user understandable language, using natural language keywords such as “go to ” and “click on ”. Personal user information is stored in a personal database on the user’s machine. In the scenarios covered by this approach, the usefulness has been demonstrated by real users in their day-to-day work lives [Leshed et al. 2008]. In contrast to our approach aiming at Web services, the scope of CoScripter is limited to the browser: all steps in a script need to be standard operations in a browser window. While closely related to our work in terms of the understandability of process steps and the user focus, it does not support Web services invocation, composition, and input-output message mappings. [Lau et al. 2010] reports on a clever extension of CoScripter: a natural-language command interface, where simple commands like “forward phone line to home phone” are understood and executed as CoScripter scripts. If the command needs further clarification, like input parameters (e.g., which phone line: work or mobile?), the tool asks the user about this. To realize this, the approach uses existing scripts and a browsing history, as well as a mechanism that extracts relevant sub-scripts from the history. The system offers various transport mechanisms, such as Twitter and SMS. Finally, [Grundy et al. 2004] presents an approach for defining data mappings between two systems based on the GUI forms used by the source and target systems. The approach is related to our forms-based data mapping, but focuses on data transformation and efficiency for skilled developers, not process modeling by domain users. 9.2. Mashups
Mashups have similar goals to our system. There have been many systems developed to facilitate mashup creation. Yahoo! Pipes22 , QEDWiki23 from IBM and JackBe 22 http://pipes.yahoo.com 23 http://services.alphaworks.ibm.com/qedwiki
ACM Transactions on the Web, Vol. V, No. N, Article A, Publication date: January YYYY.
A:34
Presto24 are some of the typical examples of the available tools. All of these systems aim to provide a data aggregation environment from pre-built components. The primary goal is to minimize the programming knowledge required from the users. Therefore, the tools emphasize on simple data flows only, which are codified by ‘connecting’ the components to merge, filter or order data [Yu et al. 2008; Di Lorenzo et al. 2009]. Topics such as data harvesting and visualization, composition of existing data and UIs, and custom views or UIs for existing services are common in mashups [Ogrinz 2009; Wong and Hong 2008]. To realize a richer mashup framework, one of the commonly accepted approaches is to cultivate two classes of users: professional developers and end users [Hoang et al. 2010], where professional developers would extend prebuilt components (e.g., custom development to access a new Web service or content) and end-users would learn how to utilize the components (e.g., Yahoo! Pipes and Yahoo Query Language [Cooper et al. 2008]). There has been some attempts to apply mashup notions to business process modeling and execution. For example, [Daniel et al. 2010] describes BPEL4UI / MarcoFlow: a language and tool for enabling BPEL designers to incorporate distributed UI composition in BPEL processes. Mashup-like UI components are synchronized between each other (for a single user), with UI components at other users, and the process. Gravity [Balko et al. 2010] is a real-time collaborative process modeling environment, embedded in Google Wave and SAP 12sprint. There is a high-level modeling perspective (in Business Process Model and Notation (BPMN) [OMG 2011]) and an executable view which uses proprietary notations similar to Yahoo Pipes. Our tool is closer to this category of mashup tools in that the predominant composition paradigm is control flow over process activities, rather than data flow between components. While there is some overlap between mashup approaches and ours, we see them as largely complementary. [Zang and Rosson 2010] describes a study on mashup developers: the vast majority of experienced mashup developers today has significant prior programming experience. “When the [user’s] knowledge state [about a new technology] is very low, perceptions of benefits or payoff may have greater influence on the user’s willingness to invest attention more than perceptions of cost [of learning the new skills].” In our tool, we believe the trade-off is potentially favorable for the user when the expected skills to learn the tool vs. the benefits from productivity gains are considered. The same source finds that working examples are important for documentation in Web APIs. In future versions of our tool, it might be useful to provide example processes for novice users to experiment with, to see how the tool works, and to understand which services do what. 9.3. Scientific Workflow Management
Scientific Workflow Management. Advances in scientific workflow management have enabled scientists to define, execute, and monitor scripts for experiments and data analysis through the acts of composition and orchestration. Many systems in the area employ Web service composition and orchestration techniques to implement the concepts. Examples of such systems include Galaxy [Goecks et al. 2010], VisTrails [Calla¨ han et al. 2006], Taverna [Oinn et al. 2004], Kepler [Ludascher et al. 2006], and Triana [Churches et al. 2006]. Some of these systems are domain-specific (e.g., Galaxy focuses on genomic processes). Other systems such as Kepler and Trianna can be used in various domains, but primarily target data flows. While these systems enable the definition of data flows at a higher level of abstraction than scripting languages such Perl and
24 http://www.jackbe.com
ACM Transactions on the Web, Vol. V, No. N, Article A, Publication date: January YYYY.
A:35
Python, they are still hard to use by end user programmers across domains, especially in the presence of large numbers of heterogeneous services. 9.4. Web Service Composition
Web services composition is a key component of process management technologies and service oriented architectures. Over the last decade, significant standardization efforts have produced widely accepted standard languages like WSDL for service description and BPEL for service orchestration [Alonso et al. 2003]. In BPEL, control flows are expressed explicitly using structured activities and data is passed from one service to another via variables. It may include exception handling and transaction support. Although BPEL is certainly a functional and widely adopted solution in Web service composition, it is primarily targeted at professional programmers, or used solely for the actual execution (as in our approach). With the popularity of RESTful services, variations of BPEL have been proposed to interact with non-WSDL based services [Pautasso 2009; van Lessen et al. 2008]. In [Curbera et al. 2007], a language called BITE is proposed which is a BPEL-like lightweight composition language specifically developed for orchestrating REST-based services. [Pautasso and Wilde 2011] propose an approach to expose a BPEL process itself as a REST service. [Xu et al. 2012] present an approach where compositions of REST services are split into process fragments, which then form sets of linked REST resources. Even with the lightweight approaches (e.g., using RESTful services), existing service composition languages are meant for highly trained IT professionals and are not adequate to be used by end-users directly. Take the learning curve that might be involved in understanding BPEL for instance. The reference documentation for BPEL runs over 260 pages [Jordan et al. 2007] and most BPEL authoring and execution tools are designed like conventional programming environments. One can hardly assume that domain experts can competently use those languages and tools. We argue that there is a need to advance the composition concepts and techniques to help transition the Web service composition solutions from the domain of IT professionals to end user environments. 9.5. End-user Process Modeling
[Stoitsev 2009] investigates using Task Management (Outlook plug-in) for “process modeling by example”: the system tracks how people split up larger tasks into subtasks, and delegate some subtasks to others; this can be used as input to a workflow design tool. [Mukherjee et al. 2010] describe a technique for constructing process models with formal execution semantics from informal models (e.g., Powerpoint drawings). The technique stops at producing BPMN. It may be extended to generate executable models. However, the missing aspects to enable that (e.g., service selection, data flow) are not explored. Microsoft InfoPath25 essentially is a code-free software engineering tool. However, it is still for users familiar with programming, e.g., who know how databases work or what Web services are. PICTURE is a domain-specific modeling method and notation for public administration [Becker et al. 2007a]. The approach is based on a fixed, domain-specific set of modeling constructs, the building blocks, and on using natural terms to the users, e.g., “receiving a document”, “consult with other party”. Building blocks are arranged in sequences to form local subprocesses, and different subprocesses can be linked via anchors. Interestingly, the argument for pure sequences in subprocesses is similar in our 25 http://office.microsoft.com/en-us/infopath/
ACM Transactions on the Web, Vol. V, No. N, Article A, Publication date: January YYYY.
A:36
work. In fact, the evaluation of the system indicates that the fixed level of abstractions and familiar terms increased efficiency in process discovery. We take similar approaches to PICTURE in that we use simple abstractions and natural terms. The key differences are: PICTURE targets capturing the processes, and does not support creating executable processes; and PICTURE is domain-specific, whereas our tool is generic. Recently, collaborative business process modeling has gained attention, e.g., [Balko et al. 2010; Sayer 2010; Decker et al. 2008]. Tools in this area aim to facilitate collaborative discovery and process re-engineering. These are related to our work in that the target audiences include non-IT professionals or non-BPM experts. For example, ARISalign26 [Sayer 2010] is a social network-based BPM tool whose focus is to involve stakeholders from within and outside an organization in designing executable processes. Blueprint27 allows users to collaboratively discover process models. The user, or group of users, starts by creating a “process map”, which resembles Porter’s value chains. The map consists of a sequence of high-level steps, where more detailed process steps can be added below each high-level step. The precise control flow can be designed in BPMN, and exported for further refinement to execution in Lombardi’s other BPM tool, Teamworks 7. A strong feature of Blueprint is Web 2.0 principles: users can share, comment, update, and be notified about changes in process models. The focus is, however, on BPM professionals discovering or improving critical processes in an organization. A recent startup, Signavio28 , offers a browser-based BPMN and value chain editing tool. The basis of this was the tool Oryx [Decker et al. 2008]. Again, a focus is on collaboration, commenting, and sharing process models with others. Another feature is a user-defined dictionary, to encourage similar naming of activities, documents, and other labels. The open-source project Activiti29 makes use of Signavio’s modeling tool, so that BPMN models can be executed in the Activiti environment. In relation to our solution, the Signavio Process Editor is quite similar to Lombardi’s Blueprint. 10. CONCLUSIONS
We have presented a forms-based service composition approach which allows domain experts with limited technical knowledge to encode idiosyncratic, repetitive business processes themselves – from design to execution. To realize this, we proposed a novel service composition method, where services have meaningful names and their input/output messages are represented as user-editable forms. Process models can be tested using a simulation feature. The approach also offers automatic process verification and supports code generation to translate process models to WS-BPEL. While we support limited modeling concepts for simplicity, executable processes can be optimized by automatic parallelization. The approach with all features listed above is implemented in a Web-based tool. Our user study indicates that FormSys Process Designer can be used with little training, enabling domain experts with some technical understanding to compose processes, and significantly increasing the efficiency of technically skilled users in creating compositions. The study further suggests that most features offered by FormSys Process Designer are indeed useful and understandable; however, the data mapping requires further attention. 26 Software
AG, http://www.arisalign.com/ http://www.lombardisoftware.com/ 28 http://www.signavio.com/ 29 http://www.activiti.org 27 Lombardi,
ACM Transactions on the Web, Vol. V, No. N, Article A, Publication date: January YYYY.
A:37
In ongoing work, an alternative approach to data mapping is being explored: a spreadsheet-based data-flow language for specifying mappings between Web services involved in a composition [Lagares Lemos et al. 2013]. The approach allows users to refer to fields from a form as “A2” or “B5”, and supports more complex mapping functions as well. The language has been integrated into the FormSys platform. ACKNOWLEDGMENTS We thank Maurice Peat, Fethi Rabhi, Kader Lattab, and Angel Lagares Lemos for their valuable feedback, Len Bass for proof-reading the paper, and all participants of our study for their time and effort. Further, we thank the anonymous reviewers for their many suggestions on improving this manuscript.
REFERENCES A HO, A., G AREY, M., AND U LLMAN, J. 1972. The transitive reduction of a directed graph. SIAM Journal on Computing 1, 2, 131–137. A LONSO, G., C ASATI , F., K UNO, H., AND M ACHIRAJU, V. 2003. Web services: concepts, architectures and applications. Springer. B AHANDUR , K., D ESMET, D., AND VAN B OMMEL , E. 2005. Smart IT spending: Insights from European banks. McKinsey on IT, Innovations in IT management 6, 23–27. B ALKO, S., D REILING, A., F LEISCHMANN, K., AND H ETTEL , T. 2010. Gravity – collaborative business process modelling and application development. SAP Community Network, http://tinyurl.com/y8mn9g6, accessed 2/6/2011. ¨ B ECKER , J., A LGERMISSEN, L., P FEIFFER , D., AND R ACKERS , M. 2007a. Bausteinbasierte Modellierung ¨ ¨ von Prozesslandschaften mit der PICTURE-Methode am Beispiel der Universitatsverwaltung Munster. Wirtschaftsinformatik 49, 267–279. ¨ B ECKER , J., P FEIFFER , D., AND R ACKERS , M. 2007b. PICTURE - a new approach for domain-specific process modelling. In CAiSE Forum. B ENATALLAH , B., H ACID, M.-S., L EGER , A., R EY, C., AND T OUMANI , F. 2005. On automating web services discovery. The VLDB Journal 14, 1, 84–96. C ALLAHAN, S., F REIRE , J., S ANTOS, E., S CHEIDEGGER , C., S ILVA , C., AND V O, H. 2006. Vistrails: visualization meets data management. In Proceedings of the 2006 ACM SIGMOD international conference on Management of data. ACM, 745–747. C HURCHES, D., G OMBAS, G., H ARRISON, A., M AASSEN, J., R OBINSON, C., S HIELDS, M., T AYLOR , I., AND WANG, I. 2006. Programming scientific and distributed workflow with triana services. Concurrency and Computation: Practice and Experience 18, 10, 1021–1037. C OOPER , B. F., R AMAKRISHNAN, R., S RIVASTAVA , U., S ILBERSTEIN, A., B OHANNON, P., J ACOBSEN, H.A., P UZ , N., W EAVER , D., AND Y ERNENI , R. 2008. Pnuts: Yahoo!’s hosted data serving platform. Proc. VLDB Endow. 1, 2, 1277–1288. C ORMEN, T., L EISERSON, C., R IVEST, R., AND S TEIN, C. 2001. Introduction to Algorithms, Second Edition. MIT Press. C URBERA , F., D UFTLER , M., K HALAF, R., AND L OVELL , D. 2007. Bite: Workflow composition for the web. In Proceedings of the 5th international conference on Service-Oriented Computing. ICSOC ’07. SpringerVerlag, Berlin, Heidelberg, 94–106. C YPHER , A., D ONTCHEVA , M., L AU, T., AND N ICHOLS, J., Eds. 2010. No Code Required - Giving Users Tools to Transform the Web. Morgan Kaufmann. D ANIEL , F., S OI , S., T RANQUILLINI , S., C ASATI , F., H ENG, C., AND YAN, L. 2010. From People to Services to UI: Distributed Orchestration of User Interfaces. In BPM’10. 310–326. D ARYL C. P LUMMER , J. B. H. 2009. Composition and BPM will change the game for business system design. Gartner Research Note number G00173105. D ECKER , G., O VERDICK , H., AND W ESKE , M. 2008. Oryx – an open modeling platform for the BPM community. In Demonstrations at BPM’08: 6th Int’l Conf. on Business Process Management. D I L ORENZO, G., H ACID, H., PAIK , H.-Y., AND B ENATALLAH , B. 2009. Data Iintegration in Mashups. SIGMOD Rec. 38, 1, 59–66. G OECKS, J., N EKRUTENKO, A., T AYLOR , J., AND T EAM , T. 2010. Galaxy: a comprehensive approach for supporting accessible, reproducible, and transparent computational research in the life sciences. Genome Biol 11, 8, R86.
ACM Transactions on the Web, Vol. V, No. N, Article A, Publication date: January YYYY.
A:38 G RUNDY, J., H OSKING, J., A MOR , R., M UGRIDGE , W., AND L I , Y. 2004. Domain-specific visual languages for specifying and generating data mapping systems. J. Vis. Lang. Comput. 15, 3-4, 243–263. H AREL , D. 2008. Can Programming Be Liberated, Period? Computer 41, 28–37. H ARRISON, W. 2004. From the editor: The dangers of end-user programming. IEEE Software 21, 5–7. H EVNER , A. R., M ARCH , S. T., PARK , J., AND R AM , S. 2004. Design science in information systems research. MIS Quarterly 28, 1, 75–105. H OANG, D., H., P., AND N GU, A. 2010. Spreadsheet as a generic purpose mashup development environment. In ICSOC. 273–287. H UY, H. P., K AWAMURA , T., AND H ASEGAWA , T. 2005. How to make web sites talk together: web service solution. In Special interest tracks and posters of the 14th international conference on World Wide Web. WWW ’05. ACM, New York, NY, USA, 850–855. J EONG, S. Y., X IE , Y., B EATON, J., M YERS, B. A., S TYLOS, J., E HRET, R., K ARSTENS, J., E FEOGLU, A., AND B USSE , D. K. 2009. Improving documentation for eSOA APIs through user studies. In Proceedings of the 2nd International Symposium on End-User Development. IS-EUD ’09. Springer-Verlag, Berlin, Heidelberg, 86–105. J ONES, M. C., C HURCHILL , E. F., AND N ELSON, L. 2010. Chapter 22: Mashed layers and muddled models: Debugging mashup applications. See Cypher et al. [2010]. J ORDAN, D., E VDEMON, J., A LVES, A., A RKIN, A., A SKARY, S., B ARRETO, C., B LOCH , B., C URBERA , F., F ORD, M., AND G OLAND, Y. 2007. Web services business process execution language version 2.0. OASIS Standard 11. K O, A. J., M YERS, B. A., AND AUNG, H. H. 2004. Six learning barriers in end-user programming systems. In VLHCC ’04. 199–206. L AGARES L EMOS, A., C HAI B ARUKH , M., AND B ENATALLAH , B. 2013. DataSheets: A spreadsheet-based data-flow language. In ICSOC’13: 11th International Conference on Service Oriented Computing. L AU, T., C ERRUTI , J., M ANZATO, G., B ENGUALID, M., B IGHAM , J. P., AND N ICHOLS, J. 2010. A conversational interface to web automation. In Proceedings of the 23nd annual ACM symposium on User interface software and technology. UIST ’10. ACM, New York, NY, USA, 229–238. L ESHED, G., H ABER , E., M ATTHEWS, T., AND L AU, T. 2008. CoScripter: Automating & Sharing How-To Knowledge in the Enterprise. CHI Letters: Human Factors in Computing Systems 10, 1, 1719–1728. L ITTLE , G., L AU, T., C YPHER , A., L IN, J., H ABER , E., AND K ANDOGAN, E. 2007. Koala: Capture, share, automate, personalize business processes on the web. CHI Letters: Human Factors in Computing Systems 9, 1, 943–946. ¨ L UD ASCHER , B., A LTINTAS, I., B ERKLEY, C., H IGGINS, D., J AEGER , E., J ONES, M., L EE , E., T AO, J., AND Z HAO, Y. 2006. Scientific workflow management and the kepler system. Concurrency and Computation: Practice and Experience 18, 10, 1039–1065. M UKHERJEE , D., D HOOLIA , P., S INHA , S., R EMBERT, A., AND N ANDA , M. 2010. From Informal Process Diagrams to Formal Process Models. In BPM’10. 145–161. M YERS, B. A., K O, A. J., AND B URNETT, M. M. 2006. Invited Research Overview: End-User Programming. In CHI ’06. 75–80. N IELSEN, J. 1994. Usability Inspection Methods. John Wiley & Sons, New York, NY, Chapter 2: Heuristic Evaluation. O GRINZ , M. 2009. Mashup Patterns: Designs and Examples for the Modern Enterprise. Addison-Wesley Professional. O INN, T., A DDIS, M., F ERRIS, J., M ARVIN, D., S ENGER , M., G REENWOOD, M., C ARVER , T., G LOVER , K., P OCOCK , M., W IPAT, A., ET AL . 2004. Taverna: a tool for the composition and enactment of bioinformatics workflows. Bioinformatics 20, 17, 3045–3054. OMG. 2011. Business Process Model and Notation, V2.0. http://www.omg.org/spec/BPMN/2.0. OMG Available Specification, Document Number: formal/2011-01-03. O RACLE W HITE PAPER. 2008. State of the Business Process Management Market 2008. http://tinyurl. com/3c4u436, accessed 20/11/2009. ¨ PATIG, S., C ASANOVA -B RITO, V., AND V OGELI , B. 2010. IT Requirements of Business Process Management in Practice. In BPM’10. 13–28. PAUTASSO, C. 2009. RESTful web service composition with BPEL for REST. Data Knowl. Eng. 68, 9, 851– 866. PAUTASSO, C. AND W ILDE , E. 2011. Push-enabling restful business processes. In ICSOC. 32–46.
ACM Transactions on the Web, Vol. V, No. N, Article A, Publication date: January YYYY.
A:39 P ETTEY, C. AND G OASDUFF , L. 2010. Gartner Reveals Five Business Process Management Predictions for 2010 and Beyond. Gartner Press Release, http://www.gartner.com/it/page.jsp?id=1278415, accessed 2/9/2010. R EIJERS, H., VAN W IJK , S., M UTSCHLER , B., AND L EURS, M. 2010. BPM in Practice: Who Is Doing What? In BPM’10. 45–60. R ICHARDSON, C., V OLLMER , K., C LAIR , C. L., M OORE , C., AND V ITTI , R. 2009. Business Process Management Suites, Q3 2009 – The Need For Increased Business Agility Drives BPM Adoption. Forrester TechRadar For BP&A Pros. R OBERTSON, C., R ABHI , F., AND P EAT, M. 2011. A Service-Oriented Approach towards Real Time Financial News Analysis. IGI Global, Chapter in Consumer Information Systems and Relationship Management: Design, Implementation and Use. R OY, M., S ULEIMAN, B., AND W EBER , I. 2010. Facilitating enterprise service discovery for non-technical business users. In WESOA’10: 6th International Workshop on Engineering Service-Oriented Applications at ICSOC’10. S AYER , P. 2010. Software AG Opens BPM Social Networking Beta Test. PCWorld Business Center, http: //tinyurl.com/yecoz2m, accessed 02/06/2011. S CHURTER , T. 2009. BPM State of the Nation 2009. bpm.com, http://www.bpm.com/ bpm-state-of-the-nation-2009.html, accessed 25/11/2009. S TOITSEV, T. 2009. End-user driven business process composition. Ph.D. thesis, TU Darmstadt, Fachbereich Informatik, Telekooperation. S TOLEE , K. T. AND E LBAUM , S. 2011. Refactoring pipe-like mashups for end-user programmers. In Proceedings of the 33rd International Conference on Software Engineering. ICSE ’11. ACM, New York, NY, USA, 81–90. VAN DER A ALST , W., TER H OFSTEDE , A. H. M., K IEPUSZEWSKI , B., AND B ARROS, A. P. 2003. Workflow Patterns. Distributed and Parallel Databases 14, 1, 5–51. VAN L ESSEN, T., N ITZSCHE , J., AND L EYMANN, F. 2008. Formalising message exchange patterns using bpel light. Services Computing, IEEE International Conference on 1, 353–360. W EBER , I., PAIK , H., B ENATALLAH , B., G ONG, Z., Z HENG, L., AND V ORWERK , C. 2010a. FormSys: Formprocessing Web Services. In WWW’10: Proceedings of the 19th International World Wide Web Conference, Demo Track. W EBER , I., PAIK , H., B ENATALLAH , B., V ORWERK , C., G ONG, Z., Z HENG, L., AND K IM , S. 2010b. Managing Long-tail Processes Using FormSys. In ICSOC’10: 8th International Conference on Service Oriented Computing, Demo Track. 702–703. W EBER , I., WADA , H., F EKETE , A., L IU, A., AND B ASS, L. 2012. Automatic undo for cloud management via AI planning. In HotDep’12: Proceedings of the Workshop on Hot Topics in System Dependability. W EBER , I., YOUNG PAIK , H., AND B ENATALLAH , B. 2011. Forms-based service composition. In ICSOC’11: 9th International Conference on Service Oriented Computing, short paper. Paphos, Cyprus. W OLF, C. AND H ARMON, P. 2006. The State of Business Process Management. Tech. rep., BPTrends. June. W ONG, J. AND H ONG, J. 2008. What Do We “Mashup” When We Make Mashups? In WEUSE’08. 35–39. X U, X., W EBER , I., Z HU, L., L IU, Y., R IMBA , P., AND L U, Q. 2012. BPMashup: Dynamic execution of RESTful processes. In ICSOC’12: 10th International Conference on Service Oriented Computing, Demo Track. Y U, J., B ENATALLAH , B., C ASATI , F., AND D ANIEL , F. 2008. Understanding Mashup Development. IEEE Internet Computing 12, 5, 44–52. Z ANG, N. AND R OSSON, M. B. 2010. Chapter 20: The web-active end user. See Cypher et al. [2010]. Z ELKOWITZ , M. AND WALLACE , D. 1998. Experimental models for validating technology. IEEE Computer 31, 5, 23–31. ZUR M UEHLEN , M. AND R ECKER , J. 2008. How Much Language is Enough? Theoretical and Practical Use of the Business Process Modeling Notation. In CAiSE’08: 20th Int’l Conf. on Advanced Information Systems Engineering. Montpellier, France.
ACM Transactions on the Web, Vol. V, No. N, Article A, Publication date: January YYYY.