Available online at www.sciencedirect.com
ScienceDirect Procedia Computer Science 65 (2015) 672 – 681
International Conference on Communication, Management and Information Technology (ICCMIT 2015)
A Framework for Classification and Visualization of Elephant Flows in SDN-Based Networks Muhammad Afaqa, Shafqat Ur Rehmanb, Wang-Cheol Songa,* a
Department of Computer Engineering, Jeju National University, Jeju, South Korea Department of Computer Engineering, Yildirim Beyazit University, Ankara, Turkey
b
Abstract Long-lived flows termed as elephant flows normally transport large volumes of data in enterprise networks, particularly data center networks. These flows tend to consume a lot of bandwidth and fill up network buffers end-to-end. This causes non-trivial delays for short-lived flows referred to as mice flows which are usually delay-sensitive. Therefore, identifying and handling elephant flows is important for QoS provisioning. In this paper, we present a framework for real-time detection and visualization of elephant flows in SDN-based networks using sFlow. Using our proposed framework, network operators can examine elephant flows through each switch by double-clicking the switch node in the topology visualization UI. Although not in the scope of this paper, but in order to meet traffic engineering requirements, the elephant flows detected and visualized by our proposed framework can be reprioritized, re-scheduled, or routed via dedicated high speed links. We evaluate the proposed framework by using a physical SDN testbed as well as a Mininet-based testbed. © Published by by Elsevier B.V.B.V. This is an open access article under the CC BY-NC-ND license ©2015 2015The TheAuthors. Authors. Published Elsevier (http://creativecommons.org/licenses/by-nc-nd/4.0/). Peer-review under responsibility of Universal Society for Applied Research. Peer-review under responsibility of Universal Society for Applied Research Keywords:elephant flows detection; visualization; SDN; OpenFlow; sFlow; Floodlight controller; Avior; Mininet.
1. Introduction Studies1 have shown that in data networks the majority of flows tend to be short, whereas the majority of packets belong to a few long-lived large flows. The short flows (mice) are usually referred to latency-sensitive, bursty
* Corresponding author. Tel.: +82-64-754-3656; fax: +82-64-755-3620. E-mail address:
[email protected]
1877-0509 © 2015 The Authors. Published by Elsevier B.V. This is an open access article under the CC BY-NC-ND license (http://creativecommons.org/licenses/by-nc-nd/4.0/). Peer-review under responsibility of Universal Society for Applied Research doi:10.1016/j.procs.2015.09.011
Muhammad Afaq et al. / Procedia Computer Science 65 (2015) 672 – 681
673
applications, such as VoIP and search results, whereas the long-lived flows (elephants) are often large transfers like back-end operations or backups. The small (mice) and large (elephant) flows phenomenon has been addressed as a problem for network performance. Network resources are utilized depending on the requirements and limitations of any application. Elephant flows have the tendency to fill network buffers end-to-end and introduce considerable delay to the latencysensitive small flows that actually share the same buffers with large flows. This results in the degradation of network performance. Furthermore, presently used hash-based multi-path routing methods, such as ECMP used in data networks could possibly hash various elephant flows onto one same link, whereas leaving other links free and causing lower quality network usage2,3. It will be, therefore, much suitable to deal with elephant flows differently than mice flows. Hence, it is required to detect, and signal the existence of elephant flows. Next, with SDN, a traffic engineering module at the controller level can be informed to route elephant flows properly 4. Conventionally, elephant flows can be detected through periodically polling, such as Hedera5. This method uses five-second polling period. This degree of granularity gives rise to probable network congestion between polls. Since, Hedera exploits periodic polling for elephant flow detection that extracts the per-flow statistics from each of its edgeswitch. However, the edge switch may be needed to manage over 38,400 flow entries if with 32 servers; each server generates 20 new flows every second with a flow timeout period of 60 seconds4. This level of granularity not only becomes infeasible in the real switch implementations of OpenFlow, but also leads to possible network congestion between polls. Given current fast datacenter networks with 10Gps or even faster links, it is possible to drop many packets between polling intervals due to late detection of elephant flows. It is also possible that a short-lived elephant flow would stay in an undesired route during of its entire existence. Mahout6 administers flow traffics by requiring timely periodic detection of significant flows, i.e., elephant flows that carry large amount of data. To overcome the limitations inHedera, the main idea of Mahout is that instead of directly monitoring the switches in the network, it monitors and detects elephant flows at the end host through a shim layer in the Operating System. When the shim layer detects that the socket buffer of the flow crosses a specified threshold, it determines that the flow is an elephant flow. Then, it marks the consequent packets of that flow using an in-band signaling mechanism. The switches in the network are configured to forward these marked packets to the Mahout controller, which determines the best path for this elephant flow and installs a flow-specific entry in the rack switch4. However, Mahout is essentially open loop architecture, without an automated decision-making module that can continually compute an appropriate threshold for elephant flow detection based on information feedback from the network. This is a key limitation of Mahout for continuous datacenter operation 7. In this paper, the detection of elephant flows in SDN systems is achieved using sampling technology, sFlow8. SDN systems use OpenFlow and sFlow enabled switches with an advanced software-based centralized controller, by means of which network engineers can examine, predict, and regulate the behavior of the traffic 9. sFlow based sampling technology requires sending samples of all flows to traffic analysis tools, such as, sFlow-RT10, Ganglia etc., which then determines the existence of elephant flows based on the samples. In our proposed framework, we developed a SDN control application that detects elephant flows which can be then visualized in a separate browser window linked to the sFlow-RT traffic analysis tool. Basically, the sFlow-RT controller receives a stream of sFlow measurements from the OpenFlow switch and rapidly detects elephant flows in real-time and notifies the control application. The double-click feature in our framework enables the user to visualize all the flows including elephant flows passing through any switch node in the random network topology. The remainder of the paper is organized as follows. An overview of sFlow technologies in relation with flow detection is provided in Section 2. In Section 3, the architecture model of the proposed framework is presented. In Section 4, the results for three different scenarios achieved from the proposed framework deployed on a physical testbed are explained. Section 5 shows the ability of our proposed framework to work in large-scale SDN-based networks. The paper is concluded in Section 6. 2. Flow Monitoring using sFlow Switches are configured to use sFlow protocol in the control plane in order to communicate with the sFlow analytics engine, such as sFlow-RT. Furthermore, switches are also configured to use OpenFlow protocol to communicate with
674
Muhammad Afaq et al. / Procedia Computer Science 65 (2015) 672 – 681
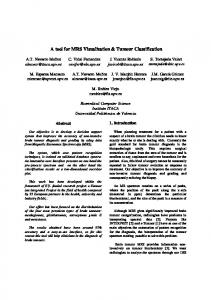
OpenFlow controller like OpenDaylight11 or Floodlight12 in the control plane. Control plane software, such as OpenFlow controller and sFlow use Open Northbound APIs to provide control functionality and summary statistics to SDN applications, e.g. DDoS Mitigation, Load Flow Detection etc. The sFlow Agent is a software process that runs as part of the network management software within a device as shown in Fig. 1. It couples flow samples and interface counters into sFlow datagrams that are sent through the network to a sFlow collector. Sampling of packets is in particular carried out by the switching/routing ASICS, giving wirespeed performance. The condition of the forwarding/routing table entries attached with each sample packet is also recorded13. The OpenFlow protocol enables SDN controller to make regulations to the network by interacting with forwarding plane. These regulations may include retrieval of information of a network of switches and to configure the forwarding behavior of these switches. A graph based model of the network and an advanced routing algorithm to determine the path of flows through the network is built by SDN controller. Using OpenFlow protocol, flow routes determined by the controller are added to the forwarding tables of the switches14. The sFlow standard is implemented in switches/routers using a separate Application Specific IC (ASIC) which allows for real-time network-wide visibility in the traffic flows and enables to continuously monitor application level traffic flows at wire speed on all interfaces simultaneously. Together, OpenFlow and sFlow can be used to offer an integrated flow monitoring system. In such a system, the OpenFlow controller can be used to define flows that are to be monitored by sFlow. In addition to that, metrics from sFlow can be used as feedback by an SDN application to control the forwarding trends in the switches.
Fig. 1.sFlow Agent Embedded in Switch/Router
Muhammad Afaq et al. / Procedia Computer Science 65 (2015) 672 – 681
3. Proposed Framework Architecture In our proposed framework, switches are configured to use sFlow and OpenFlow protocols to communicate with sFlow-RT and Floodlight OpenFlow controller respectively in the control plane. sFlow-RT is a widely used tool to process sFlow packets received from the network. It provides real-time monitoring ability into Software Defined Networks. sFlow-RT sits in the control plane of the SDN stack. It changes the received datagrams into summary statistics or actionable metrics on the flows as defined by the user. A set of packets with a common property constitutes a flow of traffic known as the flow key which is observed within a period of time. The flow key is usually specified by fields from packet header, such as TCP/UDP port numbers, IP source and destination addresses. Flow names are usually used as metrics which are programmatically approachable through RESTful Northbound APIs.Control plane software, such as sFlow and OpenFlow controller use Open Northbound APIs to provide summary statistics and control functionality to SDN applications15. Fig. 2 demonstrates the operation of different components used in our proposed framework. Avior, which is used in the framework, is a network management GUI designed for OpenFlow networks, focusing on versatility and usability with a variety of dynamic network statistics and useful management tools16. We developed the following two JavaScript programs: largeflow-record, and proxy-server. In addition to that, we added the double-click feature to Avior to visualize the recorded flows in real-time. The Traffic samples can be collected by using sFlow from wide range of devices, such as physical switches, virtual switches (OVSes), hosts, etc. sFlow monitoring can be configured on all interfaces of the device with little overhead. The sampling rate for each link can be determined according to the monitoring policy.
Fig. 2. Proposed Framework Architecture
The flow classification application is generic and is able to record all types of elephant flows, such as UDP and TCP, and ICMP flows. Fig. 3 shows the flow chart of 'LargeFlowRecord' function used in JavaScriptlargeflow-record. In this function, flow and threshold value for elephant flow are first defined and then pushed to sFlow-RT. Using the flow keys, any flow greater than the threshold value is recorded as elephant flow. Furthermore, in our proposed framework, users can specify the flow using a comma separated list of keys.
675
676
Muhammad Afaq et al. / Procedia Computer Science 65 (2015) 672 – 681
Fig. 3. Flow Chart for largeflow-record Function
We modified the JavaScript topologyView in Avior to show the overall topology and related information in Avior GUI. It contains the functions for click events, showing labels, rendering the legend and network topology using d3 (data driven documents) JavaScript library, and creating as well as displaying the network graph. More importantly, it retrieves flows information from sFlow-RT and displays it under each switch node connected in the network topology. In the ‘double click’ function of the JavaScript topologyView, variables for sFlow-RT, WebSocket server, and sFlow Agent (OVS) IP have been defined. It is responsible for opening a new browser window which will either show a single or several elephant flows going through a particular switch when that switch node is double-clicked. The pseudocode of that part of JavaScript topologyView which is responsible for popping up a separate window when any switch node in the network topology is double-clicked is shown in Fig.4.
Fig. 4.Pseudocode for Double-Click Function
In our proposed framework, Avior communicates with sFlow-RT and Floodlight OpenFlow controller via a proxy server. Since the browser’s same-origin policy does not permit Avior to communicate directly with sFlow-RT and Floodlight OpenFlow controller, so in order to overcome this restriction, we used web sockets which are not subject to this security policy. Initially, Avior has only the Data Path IDs (DPIDs) of the switches. In order to retrieve IPs for those DPIDs, it sends requests to the JavaScript Proxy-Server program. The Proxy-Server then receives switches information from Floodlight OpenFlow Controller and after finding the IP for a particular DPID, it forwards to Avior. Now that Avior
Muhammad Afaq et al. / Procedia Computer Science 65 (2015) 672 – 681
has IP of the switch, it sends request to sFlow-RT to get the names of the recorded flows. Finally, when the user double-clicks any switch of the network topology given in Avior, a new browser window pops up and all the flows which are going through that particular switch can be visualized. Fig. 5 shows the pseudocode for JavaScripot ProxyServer program.
Fig. 5.Pseudocode for JavaScript Proxy-Server Program
4. Real-time Detection and Visualization of Large Flows in Physical Testbed In order to carry out the experiments, we deployed the entire framework on a physical testbed. As shown in Fig. 6, the network topology considered is a linear network topology which is connected to our proposed framework discussed in Section 3. The topology consists of four Open vSwitches (OVSes). Each OVS is connected to host(s). It is pertinent to mention here that flow classification application and proxy-server were implemented using node.js which employs asynchronous programming model and is optimized for very high performance I/O.
Fig. 6. Linear Network Topology with Proposed Framework
677
678
Muhammad Afaq et al. / Procedia Computer Science 65 (2015) 672 – 681
Based on physical testbed, the same linear network topology in Avior GUI is shown in Fig. 7. The flows on each switch node can be visualized by double-clicking on the switch node.
Fig. 7. Linear Network Topology in Avior GUI
We investigated three different scenarios, i.e. detection and visualization of UDP, TCP, and ICMP flows in our proposed framework based on physical testbed. It is pertinent to mention here that a threshold value of 800Kbps (100KBps) has been defined in largeflow-record application. Any flow greater than this threshold value is recorded as elephant flow. Each scenario is explained in detail. 4.1. Detection and Visualization of UDP Flows In the scope of this paper, our focus is to visualize the flows generated by the user. It can be seen from Fig. 6 that in the network topology, each switch is connected to a host. The users on hosts H1, H2, and H4 generate traffic targeting hosts H3, H4, and H3 respectively. Fig. 8 shows the flows when switch node S3 is double-clicked. All three flows are passing through switch node S3 as shown. It is obvious from the figure that all three flows exceed the defined threshold value of 100KBps, therefore, recorded as elephant flows.
Fig. 8. UDP Flows on Switch S3
Muhammad Afaq et al. / Procedia Computer Science 65 (2015) 672 – 681
4.2. Detection and Visualization of TCP Flows In this scenario, host H3 and host H4 are acting as TCP servers, whereas host H1 and host H2 as TCP clients. The user on host H1 generates TCP traffic targeting host H3 which is acting as a TCP server. Similarly, the user on host H2 generates TCP traffic targeting TCP server on host H4. In both cases, the traffic should pass through switch nodes S1, S2, and S3. These TCP flows can be visualized by double-clicking switch node S2 as shown in Fig. 9.
Fig. 9. TCP Flows on Switch S2
4.3.
Detection and Visualization of ICMP Flows
Since the aim of a DoS attack is to deny access to a specific network resource. This is often achieved through a flood of illegitimate connections targeted to a resource in order to overwhelm that resource. Each type of DoS attack works by exploiting specific weakness in IP protocol. ICMP flood is the most common type of DoS attack 17. In this scenario, a flood ping is used to generate a large flow from host H1 to host H3. Fig. 10 shows the detection and visualization of this ICMP flood elephant flow in real-time.
Fig. 10. Detection and Visualization of ICMP Flood Elephant Flow
5. Real-time Detection and Visualization of Large Flows in Mininet-Based Testbed In order to show that our proposed framework is not only applicable to small and medium-scale but also to largescale SDN-based networks, we deployed it in a testbed based on Mininet. Mininet uses Linux containers and Open vSwitch to allow realistic virtual networks of hosts and switches to be constructed using a virtual machine18. For this
679
680
Muhammad Afaq et al. / Procedia Computer Science 65 (2015) 672 – 681
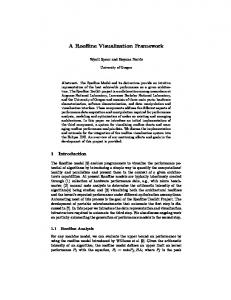
purpose, we created a tree topology consisting of one thousand hosts. As shown in Fig. 11, the blue nodes represent the switches whereas the grey ones represent the hosts of this tree topology.
Fig. 11. Mininet-Based Tree Topology in Avior GUI
As we have already shown that our proposed framework is generic and is capable of detecting and visualizing all types of flows, such as UDP, TCP, and ICMP flows etc., but in this case, we considered UDP flows only for the sake of simplicity. For this purpose, we generated UDP traffic from four different random hosts targeting four different hosts each. Fig. 12 shows the detection and visualization of UDP flows in large-scale SDN-based network deployed in our proposed framework.
Fig. 12. Detection and Visualization of UDP Flows in Large-Scale SDN-Based Network
Muhammad Afaq et al. / Procedia Computer Science 65 (2015) 672 – 681
6. Conclusions and Future Work Since the utilization rate of the bandwidth has become much more significant, even a short delay in the detection of elephant flows could result in big loss of the overall performance. In this paper, we presented a framework to not only detect elephant flows in real-time, but also visualize them by simply double-clicking any switch node of a network topology. The proposed framework was not only deployed on a physical testbed, but also on a Mininet-based large-scale SDN-based network. This real-time detection without even a short delay and visualization of elephant flows in SDN-based networks may yield to packet handling in SDN very efficient.In the future, we will use the proposed framework to enhance the performance of an overall network by exploiting QoS provisioning techniques. The ability of our proposed framework to classify and visualize elephant flows will be utilized to control the network load which will result in enabling the SDN controller to guarantee the QoS for user traffic. Acknowledgments This work was supported by the ICT R&D program of MSIP/IITP. [R0181-14-1054, Development of integrated AP for public service based super Wi-Fi-intended electric vehicle charging station and charger]. References 1. Blog post by Martin Casado, http://networkheresy.com/2013/11/01/of-mice-and-elephants/ 2. Rui (Ray) Zhou, Datacenter Network Large Flow Detection and Scheduling from the Edge, Reading and Research Project, spring 2014. 3. C.E. Hopps, Analysis of an Equal-Cost Multi-Path Algorithm, RFC 2992, Tech. Rep., November 2000. 4. Akyildiz, Ian F., Ahyoung Lee, Pu Wang, Min Luo, and Wu Chou, A roadmap for traffic engineering in SDN-OpenFlow networks. Computer Networks 71 (2014): 1-30. 5. Al-Fares, Mohammad, et al. Hedera: Dynamic Flow Scheduling for Data Center Networks. NSDI.Vol. 10. 2010. 6. Curtis, Andrew R., Wonho Kim, and Praveen Yalagandula. "Mahout: Low-overhead datacenter traffic management using end-host-based elephant detection." INFOCOM, 2011 Proceedings IEEE.IEEE, 2011. 7. Pham, Manh Tung, Kiam Tian Seow, and ChuanHengFoh. "Towards Intelligent Datacenter traffic management: using automated fuzzy inferencing for elephant flow detection." 8. Phaal, Peter, Sonia Panchen, and Neil McKee, InMoncorporation’s sFlow: A method for monitoring traffic in switched and routed Networks.RFC 3176, 2001. 9. Paul Goransson, Chuck Black, Software Defined Networks: A Comprehensive Approach, Publisher: Morgan Kaufmann, 1st Edition, June 06, 2014. 10. sFlow-RT, http://www.inmon.com,May 20, 2014. 11. Stephen Baucke, Kyle Mestery, Anees Shaikh, Chris Wright, OpenDaylight: An Open Source SDN for your OpenStack Cloud, November 6, 2013. 12. The Project Floodlight, http://www.projectFloodlight.org/documentation. 13. Traffic Monitoring using sFlow, http://www.sflow.org 14. Rehman, Shafqat Ur, Wang-Cheol Song, and Mingoo Kang. Network-wide traffic visibility in OF@ TEIN SDN testbed using sFlow, Network Operations and Management Symposium (APNOMS), 2014 16th Asia-Pacific.IEEE, 2014. 15. Chowdhury, S. R., Bari, M., Ahmed, R., &Boutaba, R. (2014, May). Payless: A low cost network monitoring framework for software defined networks. InNetwork Operations and Management Symposium (NOMS), 2014 IEEE (pp. 1-9). IEEE. 16. Avior Documentation, http://www.openflow.marist.edu/documentation. 17. Protecting the Network from Denial of Service Floods, Implementation Guide, Juniper Network Inc. 18. Mininet, http://www.mininet.org.
681