Yeletaysi et al.
Petroleum Supply Continuity Analysis Using GIS And Simulation
A Framework for integrating GIS and Systems Simulation to analyze Operational Continuity of the Petroleum Supply Chain Sarp Yeletaysi Frank Fiedrich George Washington University, ICDRM George Washington University, ICDRM
[email protected] [email protected] John R. Harrald George Washington University, ICDRM
[email protected] ABSTRACT
Crisis and disaster management is a field that requires the understanding and application of tools and knowledge from multiple disciplines. Hurricanes Katrina and Rita in 2005 have proven that U.S. petroleum infrastructure is vulnerable to major supply disruptions as a direct result of disasters. Due to the structure of U.S. oil supply chain, primary oil production centers (i.e. PADD * 3) are geographically separated from primary demand centers (i.e. PADD 1), which creates a natural dependency between those districts. To better understand the extent of those dependencies and downstream impacts of supply disruptions, a multi-disciplinary research approach is necessary. The cross-disciplines in this research include disaster management, critical infrastructure and oil supply chain management, and the utilization of geographic information systems (GIS) and systems simulation. This paper specifically focuses on the framework for integrating GIS and systems simulation as analysis tools in this research. Keywords
Continuity Management, Disaster Management, Petroleum Supply Chain, Disruptions, Critical Infrastructure Analysis, Geographic Information Systems (GIS), Systems Simulation, Hurricane Katrina, Hurricane Rita INTRODUCTION
One of the lessons learned from Hurricanes Katrina and Rita is that natural disasters have the potential to cause major disruptions in U.S. energy infrastructure. This is especially true for the petroleum industry which has a significant portion of its physical infrastructure in the southeastern coast and the Gulf of Mexico. Due to the connections between different parts of the oil supply chain, damages that occur in one part of the system may cause cascading impacts in other parts. Those cascading impacts have been witnessed during the 2005 hurricanes. Localities that primarily depend on the Gulf Coast for finished petroleum products faced the risk of shortages (Federal Trade Commission 2006). This in some instances caused very low local inventory levels and price spikes. The direct and cascading impacts of hurricanes to petroleum supply chain operations need to be better understood to minimize potential petroleum product shortages in future disasters. Understanding, conceptualizing, and attacking this problem necessitates the amalgamation of knowledge and techniques from several disciplines and research domains. Some of those domains are critical infrastructure analysis, disaster management, systems simulation, geographic information systems, and petroleum supply chain management. GIS is employed to manage and analyze spatial data, whereas systems simulation is used to create a representative model of the oil supply chain. Integration of GIS and systems simulation is an important yet challenging step to address this important real life problem (Biles, Sasso et al. 2004). While research in GIS/simulation integration is getting more and more mature, we still have a long way to go. This paper describes a two step process that integrates data from a GIS analysis into the ARENA 11.0 environment that represents the petroleum supply chain as a mixed discrete/continuous simulation model.
*
PADD stands for Petroleum Administration Defense District. There are five geographic PADD’s and exhaustively they include 50 States and the District of Columbia. PADD I is East Coast. PADD III is Gulf Coast.
Proceedings of the 5th International ISCRAM Conference – Washington, DC, USA, May 2008 F. Fiedrich and B. Van de Walle, eds. 586
Yeletaysi et al.
Petroleum Supply Continuity Analysis Using GIS And Simulation
The paper is organized as follows. Background discusses the significance of the real life problem. Literature Review provides a brief summary of previous research in relevant research streams. The methodological construct employed in this research is covered in the Methodology section. Current Status and Preliminary Findings provide an update on the current standing of the research. The last section summarizes Conclusions. BACKGROUND
There are numerous examples of cascading failures in interdependent critical infrastructures. In 1998 the failure of a telecommunications satellite triggered telecommunications failures that impacted a vast majority of pagers in the United States (Rosenbush 1998). During the tragic events of 9/11 we have witnessed cascading impacts in several interdependent systems due to geographical and physical interdependencies. The collapse of the twin towers impacted New York City’s PATH system which hosted a train station directly underneath the towers. The destruction severely damaged the power infrastructure and caused major power outages in lower Manhattan. Power outages, dust from the debris, and physical destruction caused significant losses in IT equipment and data. Loss of IT infrastructure adversely impacted the financial sector. Data transactions were at least temporarily interrupted (Thompson 2002). On August 14th, 2003 a relatively minor incident that started with a failure of a power generation unit in Ohio propagated to large portions of northeastern United States and parts of Canada following a series of equipment, human, and computer failures. The blackout impacted the states of Ohio, Michigan, Pennsylvania, New York, Vermont, Massachusetts, Connecticut, and New Jersey and the Canadian province Ontario, a total area with an estimated population of 50 million. The system could only be restored two days later. The incident caused significant economic losses (U.S. and Canada Power System Outage Task Force 2003). Even though documented examples are limited, it is known that Hurricane Katrina triggered some cascading infrastructure failures. Most of those cascading failures can be primarily attributed to the geographical and logical interdependencies between the power distribution network and the data network (internet, SCADA etc.). Secondary effects of those failures have also impacted oil infrastructure operations which are dependent on both the power and the data networks. While a significant portion of physical oil infrastructure (such as off-shore facilities, refineries, and pipelines) have their own back-up power others have suffered production loss from the power outages caused by the hurricane (BusinessWeek 2005). From a supply chain perspective, input interdependencies caused temporary petroleum product shortages in different localities. Yeletaysi (2007) provides discrete examples of cascading failures in critical interdependent infrastructures when a major earthquake triggers a refinery fire and destroys the power grid which as a secondary impact reduces water pressure for fire fighting water and paralyzes the fire fighting capability of the Tupras refinery. Impacts of 2005 Hurricanes (Katrina and Rita) and Disruptions in the Petroleum Supply Chain
Hurricanes Katrina and Rita claimed more than 1000 lives in 2005. The two disasters combined left thousands of people homeless. The National Hurricane Center, Insurance Information Institute, and the Congressional Budget Office identified Hurricane Katrina as the costliest disaster in the U.S. History. Hurricane damage analysis by the Risk Management Solutions Company † shows that the total cost of insured and uninsured losses from Katrina and Rita are approximately as high as 140 billion U.S. dollars. Between $40-$67 billon U.S. dollars of this damage is estimated to be insured (Congressional Budget Office 2005). A Congressional Budget Office (CBO) (2006) report mentions that based on the unofficial count of unemployment insurance claims to the Department of Labor, approximately 570.000 people have lost their jobs at least temporarily in the recent aftermath of the hurricanes. Based on CBO’s estimate of hurricane damage to critical infrastructure, American Petroleum Institute reports that total damage by Katrina and Rita to energy infrastructure around the Gulf Coast is between $18 billion dollars and $32 billion dollars (American Petroleum Institute 2006). Apart from the physical infrastructure damage, the energy industry incurred significant losses due to interruptions to operations triggered by the hurricane damage, stateordered evacuations of personnel, and transportation problems. According to a report by the American Geological Institute and based on information from the U.S. Minerals Management Service (MMS) 80 percent of the manned oil platforms and 70 percent of rigs in the Gulf of Mexico were evacuated prior to the storm. Most of those facilities
†
a private-sector company that specializes in catastrophe risk insurance Proceedings of the 5th International ISCRAM Conference – Washington, DC, USA, May 2008 F. Fiedrich and B. Van de Walle, eds. 587
Yeletaysi et al.
Petroleum Supply Continuity Analysis Using GIS And Simulation
re-started operations within the week following the second landfall ‡ of Hurricane Katrina (American Geological Institute 2005). MMS’s final “Hurricane Katrina/Hurricane Rita Evacuation and Production Shut-in Statistics Report § ” mentions that as of June 1st, 2006 71 out of 819 (equal to 8.67%) manned oil platforms and none of the 134 oil rigs were still evacuated. The daily shut-in oil production of 227,888 barrels of oil per day (BOPD) corresponds to approximately 15% of the total daily production in the Gulf of Mexico (GOM). The accumulated shut-in production for the time period between August 26, 2005 and June 1st, 2006 is approximately 162.4 million barrels. This amount constitutes nearly 30% of the total yearly production in the GOM (Minerals Management Service 2006). Overall, impacts of Katrina temporarily hindered 27% of U.S. oil production capacity, 32% of U.S. oil import capacity, and 13% of U.S. oil refining capacity (Federal Trade Commission 2006). AN OVERVIEW OF RELEVANT LITERATURE
Critical Infrastructure Analysis and Petroleum Supply Chain The literature on critical infrastructure systems is as old as infrastructures themselves but the literature on critical infrastructure analysis that ties the domain to emergency management and systems engineering is fairly new. Recent catastrophic incidents such as the September 11th, 2001 terrorist attacks, the August 13th, 2003 North American Blackout, and Hurricanes Katrina and Rita in 2005 acted as important triggers for research in this field. Mark and Stuart-Alexander (1977) pioneer the idea of formally including potential costs of disasters in the feasibility analysis of critical infrastructure construction projects. Amin (2000) defines critical interdependent infrastructures as “complex interactive networks” and provides examples of how those networks interact with each other. Haimes and Jiang (2001) introduce the notion of utilizing Leontief-based ** input/output models to model interdependencies of critical infrastructures. Rinaldi, Peerenboom et al. (2001) provide a roadmap for conceptual bases of critical infrastructure analysis, modeling, and simulation. Trench (2001) underlines some of the unique operational realities of the petroleum pipeline sector in the U.S. Smith (2002) provides important details regarding the challenges of systems simulation for critical infrastructure protection and provides useful measures of effectiveness. In her doctoral dissertation research entitled Life Cycle Cost Analysis of Water Supply Systems as Critical Lifelines, Tanali (2002) develops an analytical framework to assess life cycle costs of water supply infrastructures under simulated disaster scenarios and compares pre-defined strategic decision alternatives for operation and maintenance (O&M), mitigation, and contingency planning. Wallace, Mendonca et al. (2003) use integer programming to select and prioritize optimal strategies for infrastructure recovery under resource constraints in the aftermath of the September 11th attacks. Mendonça, Lee et al. (2004) investigate the damage to critical infrastructure systems in Manhattan in the recent aftermath of 9/11 attacks. Panzieri, Setola et al. (2005) implement an agent based simulation approach to model critical interdependent infrastructures. Geographic Information Systems (GIS)
Geographic information systems (GIS) may still be considered as one of those tools the benefits of which are yet to be better understood and appreciated. Since its first conceptualization in the 1950’s and 1960’s GIS have evolved tremendously both in terms of capabilities and areas of application (Mark, Chrisman et al. 1997). Initial applications of GIS in early 60’s have included simple mapping operations and digitization of paper based maps (ESRI 2006). Today’s contemporary geographic information systems include five essential components. Those components are; human resources (people), hardware, software, data, and procedures (Longley, Goodchild et al. 2005). Today we can see GIS used in diverse fields such as science applications, resource planning, asset mapping, land-use planning, engineering and transportation. Recent events such as the September 11th terrorist attacks, the Southeastern Asian Tsunami, and Hurricane Katrina have shown that better information management is essential in all phases of ‡
Hurricane Katrina made its first landfall in Florida on the morning of August 25th, 2005 and its second landfall on August 29th in Louisiana. §
The report reflects evacuation and shut-in statistics for the Gulf Coast Oil and Gas Industries as of June,1 2006
**
Wassily Leontief has been awarded the Nobel Prize in 1973 in Economics for developing an economical model which is capable of approximating the impacts of change in one sector of the economy to another one. Proceedings of the 5th International ISCRAM Conference – Washington, DC, USA, May 2008 F. Fiedrich and B. Van de Walle, eds. 588
Yeletaysi et al.
Petroleum Supply Continuity Analysis Using GIS And Simulation
emergency management (Haddow and Bullock 2003). Risk assessment, flood modeling, wildfire mapping, community preparedness, vulnerability analysis, resource allocation, route optimization are only a few disaster management applications of GIS (Amdahl 2001). GIS has also become a common application for critical infrastructure operators and owners as an efficient geographic information management tool. Harder (1999) specializes in GIS applications for energy infrastructure operators (Harder 1999). Rinaldi (2004) and Tolone, Wilson et al. (2004) provide details of their critical infrastructure analysis approaches using systems simulation and geographic information systems (GIS). Systems Simulation
According to Altiok and Melamed (2001) systems simulation is an analytical framework to create a simpler yet adequately realistic representation of a system the behavior of which needs to be better understood. Simulation of stochastic processes is often referred to as Monte Carlo simulation. Monte Carlo simulation has been introduced by Stanislaw Ulam in 1946, even though it is known that W. S. Gossett (or “Student” as widely known in the literature with his famous Student’s t-distribution) has done some previous work related to random sampling which is at the heart of Monte Carlo simulation (RiskGlossary.com 2006). In their influential paper entitled “The Monte Carlo Method” Metropolis and Ulam (1949) explain the Monte Carlo method by introducing its applications. Yet another paper titled “The Monte Carlo Method” by Bauer (1958) evaluates the potential of the methodology to approximate non-physical phenomenon when standard techniques are inefficient due to scope of the problem or complexity of the process. Rinaldi (2004) investigates complexities of critical infrastructure analysis with an emphasis on interdependency analysis. It’s stressed that modeling and simulation (M&S) are vital tools for critical infrastructure analysis for a variety of reasons including: 12345-
M&S can help determine cascading impacts of disruptions to a given part of the system. Through M&S insight can be gained on the behavior of infrastructures during disasters. M&S can improve recovery planning for catastrophic failure. M&S can support risk analysis and help identify critical nodes of the infrastructure. M&S can be integrated with decision support systems.(Rinaldi 2004).
Tolone, Wilson et al. (2004) contribute to integration of GIS and systems simulation for critical infrastructure analysis with the development of an agent based infrastructure simulation model. Vieira (2004) demonstrates a general framework for simulating supply chains with ARENA. METHODOLOGY Research Goals
The most essential goal of this research is to increase our knowledge and understanding of potential downstream petroleum supply chain impacts of hurricanes in the Gulf of Mexico. As mentioned earlier, the Gulf of Mexico region (PADD 3) is the primary oil production and refining center in the United States and it supplies other regions with crude oil and refined products. The East Coast (PADD 1) is a primary demand center for petroleum products, and especially for motor gasoline. The methodological approach to achieve the research goal is the development of: 1- a GIS based hurricane business interruption model for the physical oil infrastructure in and around the Gulf of Mexico based on empirical data obtained during Hurricanes Katrina and Rita ; 2- a petroleum (i.e. crude oil, and motor gasoline) supply chain simulation model for the continental U.S. with a special emphasis on the states located within PADD 3 (New Mexico, Texas, Louisiana, Arkansas, Mississippi, Alabama) PADD 1C (Florida, Georgia, South Carolina, North Carolina, Virginia, West Virginia) PADD 1B (Maryland, Delaware, New Jersey, Pennsylvania, New York) and the use of those flexible models to simulate the potential downstream impacts of a Gulf Coast Hurricane in an effort to estimate expected shortages (i.e. unmet demand), quantify the uncertainty of results, and understand the root causes of shortages per locality (i.e. PADD or state). As indicated in Figures 1 and 2, the boundaries of the analysis are restricted by geography (i.e. PADD 1 and PADD 3), by commodity (i.e. crude oil, and finished motor gasoline), by mode of transportation (i.e. pipeline, and barge) and by significance of modeled supply chain element (i.e. local vs. trans-regional).
Proceedings of the 5th International ISCRAM Conference – Washington, DC, USA, May 2008 F. Fiedrich and B. Van de Walle, eds. 589
Yeletaysi et al.
Petroleum Supply Continuity Analysis Using GIS And Simulation
The methodology is designed to quantify the uncertainty in the input data and results, as there are uncertainties regarding the expected damage for any piece of infrastructure during any disaster. To quantify the uncertainty of the input data, which is primarily observed closures in different infrastructures during and after the hurricane, triangular distributions are used to model the uncertainty of the total days of closure. The parameters of those distributions are estimated using real data collected on the impacts of the hurricane to different infrastructures. Secondly, to better understand the impact of the uncertainty to study results the simulation is run using probability distributions with same expected value but different uncertainty (i.e. variance). The choice of systems simulation as part of the methodology is the direct result of our intention to include the uncertainties of our data in the model.
Figure 1. Petroleum supply chain elements in scope
Figure 2. Geography in scope of simulation model
The data used in the study comes primarily from public data sources such as those from U.S. Department of Energy (DoE), Energy Information Administration (DoE), Office of Electricity Delivery and Energy Reliability (DoE), Minerals Management Service (MMS), Federal Energy Regulatory Commission (FERC), U.S. Census Bureau, U.S. Army Corps of Engineers (USACE), National Oceanic and Atmospheric Administration (NOAA), and Federal Trade Commission. The data pieces include but are not limited to oil supply/demand by state and PADD, crude oil production capacity by state, refining capacity by refinery, infrastructure disruptions during 2005 Hurricanes, quantities transported by various transportation modes, storage capacities by state, imports and exports by state. GIS Model
The GIS model is the first of the two essential models that will be necessary for the successful achievement of research goals. The GIS employed in this study runs on a standalone laptop computer with 1 gigabytes of RAM, 60 gigabytes of hard disk space and a central processing unit of 1.66 gigahertz. While the main piece of software that manages the most essential spatial information is ESRI ArcEditor 9.1, for supplementary information and data collection, web-based tools such as Google Earth are also utilized. ArcEditor 9.1 primarily manages the geodatabase that includes spatial and tabular information about the oil supply chain elements that are within the scope of the model. Those supply chain elements include oil wells, off-shore platforms, rigs, refineries, pipelines, storage terminals, ports, and other relevant data layers. Each of those elements has been organized into separate shape files that store locations and attributes. Therefore the first use of the GIS is in visual modeling of the infrastructure. Secondly, through use of additional shape files of more general nature (i.e. base maps), the GIS makes the selection and classification of existing shape files possible which is an essential task for organizing the bulk of spatial data based on the scope of research. A basic example of this capability is to group all infrastructure elements that are located within a PADD in a new shape file by performing a “completely within” query. Therefore the GIS is essential for data manipulation.
Proceedings of the 5th International ISCRAM Conference – Washington, DC, USA, May 2008 F. Fiedrich and B. Van de Walle, eds. 590
Yeletaysi et al.
Petroleum Supply Continuity Analysis Using GIS And Simulation
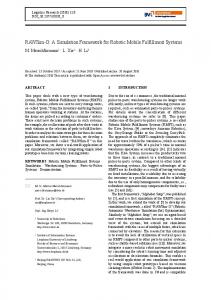
Figure 3. The Infrastructure and Hurricane (path and category) layers within GIS making analysis possible
Thirdly, the GIS also manages shape files that include spatial and tabular information regarding Hurricanes Katrina and Rita. This includes but is not limited to the path of the hurricanes, estimated rainfall, and wind speeds around the path based on which storm categories are established. As will be detailed in point four, the capability to overlay hurricane data with infrastructure data is invaluable for analysis purposes. Fourthly, the analysis capabilities of ArcEditor 9.1 are used to select the probability distributions to be used to model disruptions at individual supply chain elements. The probability distributions used in the study are of the triangular distribution family, and their parameters are estimated based on the empirical disruption data obtained for each supply chain element during Hurricanes Katrina and Rita. As can be seen in Figure 3, each strip around the hurricane path qualifies a different triangular distribution for each critical infrastructure type. This appropriate triangular distribution qualified by ArcEditor 9.1 based on another “completely within” query is then fed into ARENA 11.0 simulation platform. As part of the “Resource Status Logic” of the simulation model the GIS selected probability distribution essentially models the time dependent operating status of each infrastructure in the model. Lastly, the GIS models directly support the creation of the simulation model in that they provide detailed information about the links between infrastructures components. This is especially important when tabular data is not available regarding connectivity which is the case at more granular levels of analysis (typically state level) within the systems simulation. Then the links visible in ArcEditor 9.1 or custom datasets uploaded by individuals or organizations to Google Earth can be used to justify assumptions made in the lack of complete data. Systems Simulation in ARENA 11.0
ARENA 11.0 systems simulation software is the platform chosen for the actual simulation model of the petroleum supply chain. ARENA is a simulation platform primarily designed for discrete event systems simulation, but its later versions also support semi-continuous and continuous simulation blocks. In discrete system simulations, the state of the system changes in discrete time intervals, whereas in continuous simulations the system has elements with continuously changing status or processes that run continuously over time. The supply chain model in this research has both discrete and continuous elements, therefore is considered a mixed discrete/continuous simulation model. In ARENA, each element of the system and the connections between elements are modeled in a flowchart-like visual environment. The basic modules used to model individual parts of the model include but are not limited to Create, Dispose, Process, Decide, Assign, Record etc. Each module is responsible for representing a certain phenomenon of the actual system. For example the Create module creates entities that run through the system. In our model, multiple create modules create crude oil and other logical entities to run through pipelines to refineries, and ships to transfer crude oil/motor gasoline from one place to another. The Dispose modules dispose those entities once they complete their mission in the system. The sub model 8 available in Figure 4 uses those basic modules to model “Resource Status Logic” which essentially updates the status (i.e. operating vs. failed) of resources over time based on disruption probability distributions identified by the GIS and reflected in the simulation model. Proceedings of the 5th International ISCRAM Conference – Washington, DC, USA, May 2008 F. Fiedrich and B. Van de Walle, eds. 591
Yeletaysi et al.
Petroleum Supply Continuity Analysis Using GIS And Simulation
Figure 4. A snapshot of a supply chain sub-model in ARENA 11.0 with two examples of simulation sub-logic
Some of the more advanced ARENA modules employed in this model are the Advanced Transfer Modules, and Flow Process Modules. Advanced Transfer modules make it easier to model connections between model items, and therefore come handy for models with many connections. This is especially true for supply chain models where the system is essentially composed of multiple layers of interconnected modules. Flow process modules are used to model flow processes, which typically constitute continuous phenomenon within the model. Typical flow process modules include but are not limited to Tank, Sensor, Flow, Regulate, Seize Regulator, and Release Regulator. A Tank module represents a repository into which liquids are transferred and stored. Tank modules are typically used with Flow modules, which simulate the actual flow of the liquid from its origin into the Tank and with Regulate modules that act as valves controlling the inflow to/outflow from the Tank. Sensors are modules that regularly check the level of a Tank and execute predefined activities based on the level. For example a Sensor can be used to dispatch a refill truck once the Tank reaches its safety stock level. The sub model 2 available in Figure 4 uses a mix of basic modules and flow modules for continuous elements (with gray background) to model “Land Oil Production Logic”. The continuous elements are necessary since the flow of oil from wells into a storage tank is typically a continuous process. In ARENA, systems statistics can be either collected automatically by the simulator or they can be predefined by the user for specific purposes. In this study the primary statistic collected is the percent of demand not met for each PADD/state. This statistic is to be exclusively defined since none of the internal statistics collected would directly capture it. To calculate this statistic, each entity needs at least two local parameters, which are total demand, and total supply. The end ratio of those two parameters will give us the demand satisfied. Integration of the GIS Model and the Simulation Model in ARENA 11.0
As described in detail above, we capitalize on the strengths of GIS and Systems Simulation at relevant stages of the analysis procedure. The key is to have a clear understanding of the capabilities and weaknesses of each tool and to design a procedure that consistently and logically employs each tool in a harmonious fashion to serve the overall goal of the research. In the example above we have primarily relied on the GIS model for visualizing the underlying petroleum supply chain infrastructure and hurricane data, and the selection of probability distributions that will be used in the simulation model in ARENA 11.0. The motivation behind performing those steps using the GIS model is because ArcEditor 9.1 has powerful geo-visualization and spatial analysis capabilities that simulation software typically don’t have. ARENA is not designed to handle complex geographic data, and even if it did it would not have the analysis capability provided by ArcEditor. By the same token ArcEditor does not have any out-of-the-box simulation capabilities; therefore we rely on ARENA for simulating the petroleum supply chain. While the integration is somewhat manual, it is not as technically challenging and time consuming as a real-time integration and can be used until fully integrated GIS based simulation software are widely available.
Proceedings of the 5th International ISCRAM Conference – Washington, DC, USA, May 2008 F. Fiedrich and B. Van de Walle, eds. 592
Yeletaysi et al.
Petroleum Supply Continuity Analysis Using GIS And Simulation
CURRENT STATUS & PRELIMINARY FINDINGS
As of January 2008, several crucial tasks in this research are complete whereas others are still worked on. The collection, classification, standardization, and integration of all GIS data as well as the collection of empirical data on infrastructure disruptions have been completed. The collection of PADD level data for supply chain conceptualization is also fully complete. All logical sub-models for the simulation model have been identified and model development in underway. Preliminary research indicates that all petroleum supply chain elements are vulnerable to minor or major disruptions during hurricanes. The extent of those disruptions and the layout of connections between elements decide the impact on the supply chain. Refineries and pipelines appear to be the two most critical supply chain elements, where especially long-term disruptions may have significant supply shortage consequences. This is especially true for some East Coast states that have limited or no refining capacity, and with a high reliance on finished product via pipelines. The ultimate goal of the research is to identify, quantify, and understand root causes of those short supply conditions. CONCLUSIONS
In a perfect world we would use GIS software with advanced simulation capabilities or systems simulation software that can manage complex spatial data. Promising research is being conducted towards a fully integrated GIS based systems simulation framework. Commercial GIS software can now perform time driven animations (ESRI 2007). Tolone, Wilson et al. (2004) generated a powerful prototype that has the potential to become the next generation integrated GIS based simulation system. There is even significant progress made in fully integrating commercial GIS and systems simulation software (Wu, Shuman et al. 2007). However until those fully integrated GIS based system simulation tools are widely available, we may still need to capitalize on the existing power of GIS models and systems simulation software as separate tools. This paper demonstrated a two step analysis framework where a GIS model is combined with a systems simulation tool to perform a supply chain interruption analysis. In doing that, the authors elaborated on the thinking process which may shed light into similar needs for integration in the absence of fully integrated GIS simulation tools. The strength of the approach is that it identifies both the strengths and the gaps of underlying capabilities, and it elaborates on overlapping analysis needs that need to be supported by amalgamation of GIS and systems simulation. While the domain of application discussed in this paper is specific to oil supply chain interruption analysis, the framework can be used in any scenario where behavior of geospatially oriented entities is to be simulated. REFERENCES
1.
Altiok, T. and B. Melamed (2001). Simulation Modeling and Analysis with Arena. Piscataway, New Jersey, Cyber Research, Incorporated, Enterprise Technology Solutions, Incorporated.
2.
Amdahl, G. (2001). Disaster Response: GIS for Public Safety. Redlands, CA, ESRI, Inc.
3.
American Geological Institute (2005). Katrina strikes the energy sector Geotimes Magazine, [cited 07/21 2006]. Available from http://www.agiweb.org/geotimes/sept05/WebExtra090905.html.
4.
American Petroleum Institute (2006). The 2006 Hurricane Season and America's Oil & Natural Gas Industry, [cited 07/21 2006]. Available from http://api-ec.api.org/.
5.
Amin, M. (2000). National Infrastructures as Complex Interactive Networks. Automation, Control, and Complexity: An Integrated Approach. T. Samad and J. Weyrauch. New York, John Wiley and Sons: Chapter 14.
6.
Bauer, W. F. (1958). "The Monte Carlo Method." Journal of the Society for Industrial and Applied Mathematics 6(4): 438-451.
7.
Biles, W. E., D. Sasso, et al. (2004). Integration of Simulation and Geographic Information Systems: Modeling Traffic Flow in Inland Waterways. 2004 Winter Simulation Conference, Washington, D.C.
8.
BusinessWeek (2005). How Katrina turned off the oil [online]. McGraw-Hill, [cited July 27 2006]. Available from http://www.businessweek.com/bwdaily/dnflash/aug2005/nf20050831_0413.htm.
9.
Congressional Budget Office (2005). Macroeconomic and Budgetary Effects of Hurricanes Katrina and Rita. Statement of Douglas Holtz-Eakin, Director of Congressional Budget Office. Washington, D.C. Proceedings of the 5th International ISCRAM Conference – Washington, DC, USA, May 2008 F. Fiedrich and B. Van de Walle, eds. 593
Yeletaysi et al.
Petroleum Supply Continuity Analysis Using GIS And Simulation
10. Congressional Budget Office (2006). The Budget and Economic Outlook: Fiscal Years 2007 to 2016. Washington, D.C.: 28-29. 11. ESRI (2006). Project: ESRI Timeline, [cited August 30 2006]. Available from http://www.esri.com/company/about/timeline/flash/index.html. 12. ESRI (2007). New with ArcGIS 9.2. ArcUser. January-March 2007: 6-7. 13. Federal Trade Commission (2006). Investigation of Gasoline Price Manipulation and Post-Katrina Gasoline Price Increases. Washington, D.C. 14. Haddow, G. and J. Bullock (2003). Introduction to Emergency Management, Butterworth-Heinemann. 15. Haimes, Y. and P. Jiang (2001). "Leontief-based model of risk in complex interconnected infrastructures." Journal of Infrastructure Systems. 16. Harder, C. (1999). Enterprise GIS for Energy Companies. Redlands, CA, ESRI Press. 17. Longley, P. A., M. F. Goodchild, et al. (2005). Geographical Information Systems and Science. West Sussex, England, Wiley. 18. Mark, D., N. Chrisman, et al. (1997). GIS History Project, Summary Paper Presented at the UCGIS Seminar June 1997, [cited August 30 2006]. Available from www.geog.buffalo.edu. 19. Mark, R. K. and D. E. Stuart-Alexander (1977). "Disasters as a Necessary Part of Benefit-Cost Analyses." Science 197(4309): 1160-1162. 20. Mendonça, D. M., E. E. Lee, et al. (2004). Impact of the 2001 World Trade Center attack on Critical Interdependent Infrastructures. 2004 IEEE International Conference on Systems, Man and Cybernetics. 21. Metropolis, N. and S. Ulam (1949). "The Monte Carlo Method." Journal of the American Statistical Association 44(247): 335-341. 22. Minerals Management Service, U. S. D. o. t. I. (2006). Hurricane Katrina/Hurricane Rita Evacuation and Production Shut-in Statistics Report as of Thursday, June 1, 2006, [cited 07/22 2006. Available from http://www.mms.gov/ooc/press/2006/press0605.htm. 23. Panzieri, S., R. Setola, et al. (2005). An approach to model complex interdependent infrastructures. 16th IFAC World Congress, Praha, Checz Republic. 24. Rinaldi, S. M. (2004). Modeling and Simulating Critical Infrastructures and Their Interdependencies. 37th Annual Hawaii International Conference on System Sciences, Big Island, HI. 25. Rinaldi, S. M., J. P. Peerenboom, et al. (2001). "Identifying, Understanding, and Analyzing Critical Infrastructure Interdependencies." IEEE Control Systems Magazine: 11-25. 26. RiskGlossary.com (2006). The Monte Carlo Method, [cited 08/24 2006]. Available from http://www.riskglossary.com/articles/monte_carlo_method.htm. 27. Rosenbush, S. (1998). "Satellite's death puts millions out of touch." USA Today, May 21, 1998. 28. Smith, R. (2002). Complexities of Simulating Domestic Infrastructure Protection. Fall 2002 Simulation Interoperability Workshop. 29. Tanali, I. R. (2002). "Life Cycle Cost Analysis of Water Supply Systems as Critical Lifelines." Ph.D. Dissertation,Engineering Management and Systems Engineering The George Washington University. 30. Thompson, W. C. J. (2002). The Fiscal Impact of 9/11 to New York City [online]. City of New York, 2006]. Available from http://comptroller.nyc.gov/bureaus/bud/reports/impact-9-11-year-later.pdf. 31. Tolone, W. J., D. Wilson, et al. (2004). Critical Infrastructure Integration Modeling and Simulation. 2nd Symposium in Intelligence and Security Informatics, Tucson, Arizona. 32. Trench, C. J. (2001). How Pipelines Make the Oil Market Work – Their Networks, Operation and Regulation, A Memorandum Prepared for the Association of Oil Pipe Lines And the American Petroleum Institute's Pipeline Committee, [cited 07/20 2006]. Available from https://www.piersystem.com/posted/888/Notes_How_Pipelines_Make_the_Market_Work.57635.pdf. 33. U.S. and Canada Power System Outage Task Force (2003). Interim Report: Causes of the August 14th Blackout in the United States and Canada: 1, 21.
Proceedings of the 5th International ISCRAM Conference – Washington, DC, USA, May 2008 F. Fiedrich and B. Van de Walle, eds. 594
Yeletaysi et al.
Petroleum Supply Continuity Analysis Using GIS And Simulation
34. Vieira, G. E. (2004). Ideas for Modeling and Simulation of Supply Chains with Arena. 2004 Winter Simulation Conference, Washington, D.C. 35. Wallace, W. A., D. M. Mendonça, et al. (2003). Managing Disruptions to Critical Interdependent Infrastructures in the Context of the 2001 World Trade Center Attack. Beyond September 11th: An Account of Post-Disaster Research. N. H. R. a. A. I. Center, P. E. R. Institute and T. I. f. C. I. Systems. Boulder, CO, University of Colorado. Special Publication #39: 165-198. 36. Wu, S., L. Shuman, et al. (2007). Embedding GIS in Disaster Simulation. 2007 ESRI Homeland Security GIS Summit, Denver, Colorado. 37. Yeletaysi, S. (2007). International Response to TUPRAS Refinery Fire: A Case Study. Washington, D.C., accepted for publication by Turkish Journal of Disaster on April 23, 2007.
Proceedings of the 5th International ISCRAM Conference – Washington, DC, USA, May 2008 F. Fiedrich and B. Van de Walle, eds. 595