partially on best professional judgment (BPJ), which ... cal concentration data alone fails to differentiate ... The State of California is developing a framework.
A framework for interpreting sediment quality triad data Steven M. Bay and Stephen B. Weisberg
ABSTRACT There are numerous approaches for integrating multiple lines of evidence (MLOE) data in a sediment quality triad assessment, but most rely at least partially on best professional judgment (BPJ), which can be problematic in application to large data sets or in a regulatory setting where the assessment protocol needs to be transparent and consistently reproducible. This study presents an approach for standardizing triad-based assessments and evaluate the extent to which it captures and reproduces the assessments of experts employing BPJ on the same data. The framework is based on integrating answers to two questions: 1) Is there biological degradation at the site, and 2) Is chemical exposure at the site high enough to potentially result in a biological response? The efficacy of the framework was assessed by applying it to data from 25 sites and comparing the site classifications to those of six experts who were provided the same data. The framework produced an answer that better matched the median classification of the experts than did five of the six experts. Moreover, the bias in response was less than that obtained from some of the experts, and the errors were relatively evenly divided between sites classified as more impacted or less impacted than the median expert classification. The framework was also applied and found to distinguish well sites from known degraded and reference areas within California. While the framework suggested here is not the only one possible and should be supplemented with BPJ when additional data beyond that included in the framework are available, the framework provides a validated means for using a triad based approach in large-scale assessments, such as those for Clean Water Act (CWA) 305b programs or regulatory decisions, where transparency in the decision process is critical.
INTRODUCTION Assessments of sediment quality for the effects of chemical contamination frequently use a triad of
chemical concentration, sediment toxicity, and benthic infaunal community condition data (Long and Chapman 1985). These are used in combination because sediments are a complex matrix and chemical concentration data alone fails to differentiate between the fraction that is tightly bound to sediment and that which is biologically available. Toxicity tests improve on chemical measurements because they integrate the effects of multiple contaminants, but toxicity tests are typically conducted under laboratory conditions using species that may not occur naturally at the test site and with a range of sensitivities, making it difficult to interpret the ecological significance of the results when used alone. Benthic community condition is a more direct ecological indicator because these are resources at risk from sediment contamination, but their use alone is problematic because they are potentially affected by other factors, such as eutrophication, physical disturbance or hypoxia. Several approaches for integrating these multiple lines of evidence (MLOE) data have been developed (Chapman et al. 2002). These integration approaches rely mostly on a similar suite of indicators for each LOE, but differ in how the LOEs are combined into a single assessment. Some are based on combinations of binary responses for each LOE, while others use a more complex statistical summarization. For example, some approaches weight the three LOEs equally, while others weight them differently. Further, even within an integration framework, thresholds must be determined for each LOE. Consensus thresholds for these most commonly used LOEs do not yet exist, with the result that these threshold decisions become particularly important when the integration is based on a binary decision for each LOE. As a result of these current limitations, most triad applications rely on some degree of BPJ (Burton et al. 2002, Chapman and Anderson 2005). Despite the many decisions inherent in the integration of LOEs, BPJ has been found to be reasonably Framework for interpreting sediment quality triad data - 175
repeatable for interpretation of triad data (Bay et al. 2007). Thus, BPJ can be an acceptable means of integration for site-specific assessments, but it is not easily applicable to large-scale assessments where many sites are involved. It is also problematic in a regulatory setting, where the assessment protocol must be transparent and consistently reproducible over time and space (Forbes and Calow 2004). The State of California is developing a framework for standardizing such triad-based assessments as part of establishing sediment quality objectives. The present study describes that framework and evaluate the extent to which it captures and reproduces the assessments of experts employing BPJ on the same data.
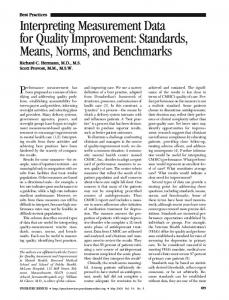
METHODS Integration Framework The framework integrates three lines of evidence (LOE) to assess sediment quality at a site (i.e., specific location or station). Integration of the data involves a three-step process (Figure 1). First, the response for each LOE is assigned into one of four response categories: 1) no difference from background conditions, 2) a small response that might not be statistically distinguishable from background conditions, 3) a response that is clearly distinguishable from background, and 4) a large response indicative of extreme conditions. Second, the individual LOEs are combined to address two key elements of a risk assessment paradigm: 1) Is there biological degradation at the site? and 2) Is chemical exposure at the site high enough to potentially result in an adverse biological response? To answer the first question, the benthos and toxicity Toxicity
Benthos
Chemistry
Toxicity
Potential for Chemically Mediated Effect
Level of Biological Effect
Site Condition
Figure 1. Conceptual model for the integration of MLOEs in the assessment framework. Framework for interpreting sediment quality triad data - 176
LOEs are integrated to assess the severity of effects (Table 1). The effects assessment is equivalent to the benthic condition in most cases, except where there is extreme disagreement between the benthos and toxicity LOEs. Benthos is given greater weight in this assessment as it is the ultimate endpoint of interest (Chapman 2007). The second question arises because the biological response may be attributable to factors other than chemical contaminants. This framework is intended to assess impacts on sediment quality due to anthropogenic chemical contamination, not impacts from physical or biological processes. The potential that effects are chemically mediated is assessed using the sediment chemistry and toxicity LOEs (Table 2). Chemistry is the more direct measure, but toxicity is given equal weight because of the potential that unmeasured chemicals are present and because of uncertainties in thresholds used to interpret chemical data (Ingersoll et al. 2005). The final data integration step combines the severity of effect and potential for chemically-mediated effects to assign a site into one of six impact categories: • Unimpacted. Confident that contamination is not causing significant adverse impacts to aquatic life living in the sediment at the site. • Likely Unimpacted. Contamination is not expected to cause adverse impacts to aquatic life in the sediment, but some disagreement among LOEs reduces certainty that the site is unimpacted. • Possibly Impacted. Contamination at the site may be causing adverse impacts to aquatic life in the sediment, but the level of impact is either small or is uncertain because of disagreement among LOEs. • Likely Impacted. Evidence of contaminantrelated impacts to aquatic life in the sediment is persuasive, in spite of some disagreement among LOEs. • Clearly Impacted. Sediment contamination at the site is causing clear and severe adverse impacts to aquatic life in the sediment. • Inconclusive. Disagreement among the LOE suggests that either the data are suspect or that additional information is needed before a classification can be made. The decision process for determining the site
Table 1. Severity of effect classifications, derived from the benthos and toxicity LOEs.
Benthos LOE Category
Toxicity LOE Category
Nontoxic
Low Toxicity
Moderate Toxicity
High Toxicity
Reference
Unaffected
Unaffected
Unaffected
Low Effect*
Low Disturbance
Unaffected
Low Effect
Low Effect
Low Effect
Moderate Disturbance
Moderate Effect
Moderate Effect
Moderate Effect
Moderate Effect
High Disturbance
Moderate Effect*
High Effect
High Effect
High Effect
*Extreme disagreement between LOE is present indicating atypical conditions or suspect data. Review of additional information about the site before making an assessment is recommended.
assessment category is based on a foundation that there must be some evidence of biological effect in order to classify a site as impacted (Table 3). Additionally, there must be some evidence of elevated chemical exposure in order to classify a site as chemically-impacted.
Application of the Framework Application of the framework requires measuring sediment chemistry, toxicity, and benthic community condition at each site using standardized methods. The response of each measurement is compared to established thresholds to categorize each of the individual LOEs into one of four possible response categories (Table 4).
Chemistry A combination of two sediment chemistry indices was used to determine the magnitude of chemical exposure at each site: the logistic regression models calibrated to California data (CA LRM; Bay et al. 2008) and the Chemical Score Index (CSI; Ritter et al. 2008). The CA LRM was developed
using the logistic regression modeling approach that estimates the probability of toxicity based on the chemical concentration (Field et al. 2002, USEPA 2005). The CSI uses the chemistry data to predict the occurrence and severity of benthic community disturbance. Index-specific thresholds were applied to each index to classify the result into one of four chemical exposure categories: Minimal, Low, Moderate, and High. The resulting exposure categories were assigned a score of 1 - 4 (e.g., Minimal Exposure = 1) and the average of the scores for each chemistry index was used to determine the overall chemistry LOE category. Average scores were rounded up to the next whole number in the case of intermediate results (e.g., average score of 2.5 = Moderate Exposure).
Toxicity The results of multiple toxicity tests are used to determine the magnitude of sediment toxicity at each site. The tests must include a 10-day amphipod survival test and a sublethal test (e.g., embryo development or juvenile growth). Thresholds based on per-
Table 2. Potential that effects are chemically mediated classifications, derived from chemistry and toxicity LOE.
Chemistry LOE Category
Toxicity LOE Category
Nontoxic
Low Toxicity
Moderate Toxicity
High Toxicity
Minimal Exposure
Minimal Potential
Minimal Potential
Low Potential
Moderate Potential*
Low Exposure
Minimal Potential
Low Potential
Moderate Potential
Moderate Potential
Low Potential
Moderate Potential
Moderate Potential
Moderate Potential
Moderate Potential*
Moderate Potential
High Potential
High Potential
Moderate Exposure High Exposure
*Extreme disagreement between LOE is present indicating atypical conditions or suspect data. Review of additional information about the site before making an assessment is recommended.
Framework for interpreting sediment quality triad data - 177
Table 3. MLOE site classifications, derived from intermediate classifications described in Tables 1 and 2.
Potential for Chemically
Severity of Effect
Mediated Effects
Minimal Potential Low Potential Moderate Potential High Potential
Unaffected
Low Effect
Moderate Effect
High Effect
Unimpacted
Likely Unimpacted
Likely Unimpacted
Inconclusive
Unimpacted
Likely Unimpacted
Possibly Impacted
Possibly Impacted
Likely Unimpacted
Possibly Impacted or Inconclusive*
Likely Impacted
Likely Impacted
Inconclusive
Likely Impacted
Clearly Impacted
Clearly Impacted
*Inconclusive category applies when: chemistry = minimal exposure, benthos = reference, and toxicity = high. Other LOE combinations represented by this cell are classified as Possibly Impacted.
centage survival and statistical significance are applied to classify the test results into one of four toxicity categories (Bay et al. 2007a): Nontoxic, Low, Moderate, and High. The toxicity categories are averaged as described previously to determine the overall toxicity LOE category.
Benthos A combination of four benthic community condition indices was used to determine the magnitude of disturbance to the benthos at each site (Ranasinghe et al. 2007). The indices include approaches based on community metrics and abundance of individual species. The benthic indices are:
Benthic Response Index (BRI), which was originally developed for the southern California mainland shelf and extended into California’s bays and estuaries (Smith et al. 2001, Smith et al. 2003). The BRI is the abundance-weighted average pollution tolerance score of organisms occurring in a sample. Index of Benthic Biotic Integrity (IBI), which was developed for freshwater streams and adapted for California’s bays and estuaries (Thompson and Lowe 2004). The IBI identifies community measures that have values outside a reference range.
Table 4. Ranges of values used to define each LOE indicator category. Separate benthic index ranges are used for southern California and San Francisco Bay habitats. LOE
Indicator
Chemistry Exposure
Minimal
Low
Moderate
High
CA LRM
0.33 to 0.49 to 0.66
CSI
1.69 to 2.34 to 2.99
Nontoxic
Low
Moderate
High
>90
82
59
3
RBI
>0.27