custom-built to support specific notations and difficult to maintain. ... Currently to support these kinds of software visualisation notation exchange a custom converter or .... This approach has the advantage that the database APIs used are much.
Stoeckle, H., Grundy, J.C. and Hosking, J.G. A Framework for Visual Notation Exchange, Journal of Visual Languages and Computing, Volume 16, Issue 3 , June 2005, Elsevier, pp.187-212.
A Framework for Visual Notation Exchange Hermann Stoeckle1, John Grundy1, 2 and John Hosking1 Department of Computer Science1 and Department of Electrical and Computer Engineering2, University of Auckland, Private Bag 92019, Auckland, New Zealand {herm, john-g, john}@cs.auckland.ac.nz Abstract A wide range of software tools provide software engineers with different views (static and dynamic) of software systems. Much recent work has focused on software information model exchange. However, most software tools lack support for exchange of information about visualisation notations (both definitions of notations and instances of them). Some basic converters have been developed to support the exchange of notation information between software tools but almost all are custom-built to support specific notations and difficult to maintain. We describe the development of several notation exchange converters for tools supporting software architecture notations. This has lead to the development of a unified converter generator framework for notation exchange. Keywords: visual notation exchange, notation converters, tool integration, visual language representation
1. Introduction A vast (and still increasing) number of software visualisation notations exist. These include static visualisation notations at varying levels of abstraction e.g. class diagrams, component diagrams and deployment diagrams [4, 26]; dependency graphs [27, 30], software architecture structure [9, 15, 30], and for dynamic visualisation e.g. call-graphs and control flow [1, 20, 27], message sequencing [30, 24, 31, 4]; dynamic architectures [14, 24]; and various run-time software characteristics like performance and resource utilisation [14, 27]. Many tools have been developed to support variants of these visualisation notations, for example UML-based CASE tools [26, 30], software architecture design and analysis tools [9, 24, 15], graph visualisation tools [11, 18, 20], program analysis and visualisation tools [3, 24, 27] and visual language tools [13, 31]. Often developers would like to exchange notation information between the tools from time to time e.g. exchange a UML diagram from a CASE tool to MS Visio™ for further enhancement; exchange diagram notation descriptions between CASE tools so the tools allow viewing and possibly editing of the same format notation; and exchange notation instance information with other tools to support viewing the information in a different platform e.g. web interface, or 3D virtual reality interface to the visualisations. In addition to exchanging notation information in custom tool formats we may wish to convert between low-level display formats e.g. a CASE tool diagram into SVG, VRML or GXL exchange formats [5, 18, 19]. Currently to support these kinds of software visualisation notation exchange a custom converter or translator must be developed [17, 16, 19]. These take considerable effort to build, test and deploy and are difficult to modify if the notation itself or the tool notation information formats change. They also typically lose parts of the information in one tool when translating to another tool’s notation information model. We describe our work building several translators for different software visualisation notation formats. The original notations are those defined and used by our Pounamu meta-tool to describe various visualisation notation shapes, their properties and their relations. We have hand-built several notation converters supporting the translation of static and dynamic software architecture notation information between Pounamu and an earlier software architecture modelling tool (SoftArch), and to graph-based formats (GXL) and graphic-based formats (SVG, VRML), used by other rendering and editing tools. From insights during this work, we describe our new approach to generating notation converters from intervisual notation mapping specifications.
2. Motivation We have been developing Pounamu, a new meta-tool to support the specification of multi-user, multi-view visual language-oriented software engineering tools. Pounamu allows software engineers to define new meta-models and metaviews for software tools and to realise tools based on these specifications. Pounamu was designed to provide thick client CASE tools to support the developer in different parts of software development. Pounamu views consist of a wide range
Stoeckle, H., Grundy, J.C. and Hosking, J.G. A Framework for Visual Notation Exchange, Journal of Visual Languages and Computing, Volume 16, Issue 3 , June 2005, Elsevier, pp.187-212.
of graphical shapes and connectors representing information about a software system, as well as dialogue-based views. Pounamu currently uses its own proprietary XML-based representation format for its software notations. Pounamu’s design tools include shape and connector designer, meta-model designer, modelling view designer and event handler designer. Figure 1 (a) shows an example of specifying a UML class icon shape in the Pounamu shape design tool. This shape is composed of a box, set of labels (class name, stereotype etc), list of attributes and list of methods. The Pounamu tool designer specifies a graphical notation for a new tool based on shapes and shape connectors. Shapes can be of arbitrary complexity and may be composed of other sub-shapes. Figure 1 (b) shows an example diagramming tool generated by Pounamu, a Unified Modelling Language (UML) CASE tool, being used. A thick-client interface is provided for all Pounamu tools, which includes an element tree (1), pop-up and pull-down (2) menus, drawing canvas (3), shape property editor, status window (4), and directly-manipulatable shapes (5) and shape elements. (2) (1) (3)
(5)
(4)
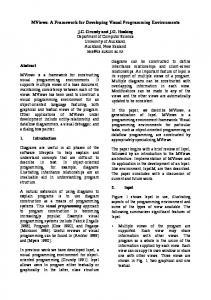
Figure 1. (a) Example of Pounamu shape design view and (b) example of UML tool modeller view. As identified in the introduction, a large number of software tools have been developed to support visual software modelling and analysis, each using a particular set of visual notational symbols. We wanted to support import and export of software visualisations (both static and dynamic) between Pounamu-based environments and other software engineering tools, e.g. CASE tools, architecture design tools, software visualisation tools and other visual language environments. More generally, we want to more easily support the import and export of visual software notations between a wide range of 3rd party software tools e.g. CASE tools. We also want to allow users of Pounamu, and possibly users of other visual language-based software engineering tools, to interact with views using different viewing and editing technologies, including web-based thin client and 3D virtual reality. For complex dynamic software visualisations in particular, we want to make use of 3rd party viewing tools like 3D viewers and information visualisation tools. To achieve this, Pounamu has to be able to support the import and export of a wide range of external visual notation formats. This can include formats of applications dealing with graphs, view layouts, software information (e.g., UML-based models), data visualization tool formats or even translating events within a CASE tool into rule sets using Programming by Example techniques. As an example of the kinds of software visualisation notation exchange we require, consider the four software architecture visualisations shown in Figure 2. A Pounamu tool (1) has been defined to support the modelling of complex software architectures, using a domain-specific visual language comprising of shapes representing clients, servers, processes, databases and so on. We want to be able to exchange this visual model with other tools providing software architecture modelling and analysis. For example, we want to exchange this model view with our SoftArch [13, 15] software architecture modelling and analysis tool, a view from which is shown in (2). This would allow us to model an architecture in our Pounamu tool and then export it to SoftArch for further refinement and analysis. Pounamu and SoftArch can both visualise software architecture diagrams but use a set of different visual notational symbols and different representational formats for this information. Similarly, we may wish to import a SoftArch view into Pounamu, or export a Pounamu or SoftArch view to e.g. the Argo/UML CASE tool, a view from which is shown in (3). Again, a different visual notation and representational format is used by all tools, requiring complex conversion between them. As a final example, we may wish to export one of these software architecture views to a VRML viewer, as shown in (4). This might enable us to both show extra information (e.g. architecture performance metrics) using the third visual dimension,
Stoeckle, H., Grundy, J.C. and Hosking, J.G. A Framework for Visual Notation Exchange, Journal of Visual Languages and Computing, Volume 16, Issue 3 , June 2005, Elsevier, pp.187-212.
and/or enable the architect to more easily and flexibly navigate a complex model using the VRML viewer’s 3D visual interaction support.
(1) (2)
(3) (4)
Figure 2: Some examples of software architecture visualization notation exchange between software tools.
3. Related Work A range of software tool integration approaches have been developed over many years [12, 33]. Most integration approaches tend to focus on supporting data integration [32], control integration [28, 29], user interface integration [29], and/or process integration [1]. Data-oriented tool integration approaches have typically used CASE tool data exchange [32], common exchange formats like XMI and GXL [21, 30], and shared databases [12]. The main disadvantages of these approaches are their lack of dynamic integration support and limitation to data-oriented exchanges. User interface integration techniques provide a common user interface metaphor e.g. GUI wrappers [28], a common interface library, or WWW [22], but often lack back-end integration support for the tools. Control integration approaches typically use APIs and object-based integration approaches, such as CORBA and related distributed object technologies [10], software components [36], and web services, particularly for workflow system integration [23]. These approaches provide powerful integration support, but often lack adequate user interface and process integration support across the integrated tool sets [25, 29]. Process integration approaches typically require data and/or control integration strategies if integrated tools are intended to exchange model or view information [25, 33]. To exchange software information with other tools is still a major software engineering challenge, with much effort and time spent in developing solutions to build data exchange converters between different tools [12, 21, 30]. To achieve data-oriented tool integration as shown in the previous section, developers have typically ended up using tool APIs, shared databases or data exchange formats. Remote APIs for accessing the functionality of tools can ensure more consistent information and close integration of tools [28, 36]. However this requires detailed knowledge of the different functional parts of the API and their interaction. Functions of an API have to be used in a specific order and requires target tools to
Stoeckle, H., Grundy, J.C. and Hosking, J.G. A Framework for Visual Notation Exchange, Journal of Visual Languages and Computing, Volume 16, Issue 3 , June 2005, Elsevier, pp.187-212.
be running as a server application. APIs tend to be more likely to be changed than the underlying information in tools and only a few are well-established standards (for example ODBC or J2EE) which make it easier to exchange tools. API based integration is used to build very flexible and complex Integrated Development Environments (IDEs) with plug-in facilities, for example Eclipse [8] or ArgoUML [30], where plug-ins implement a specific API interface which can be accessed and the results visualized by the IDE. Shared databases are an intermediate step where a tool uses a database via well-known database APIs to access information generated by another tool [10, 12]. This approach has the advantage that the database APIs used are much more stable and well-known than proprietary tool APIs. However, using such a data-oriented approach can limit the degree of tool integration achievable compared to an API-based control integration approach. In addition, while database APIs are much more general than proprietary tool APIs they still typically require explicit coding to use. If a tool-specific API or shared information database API is not accessible, data exchange formats are commonly used to exchange information between tools [12, 18, 21]. Data exchange formats allow access to tool information stored in an persistent format. XML has become a popular exchange format for many tool applications, but tools require specific XML schemas to represent information in meaningful ways. Knowledge of the particular XML schema being used is essential and many tools use their own XML schema, such as our Pounamu tool, to represent information. Much work has been done developing standard exchange formats for model data in software tools, such as the XML-based schema XMI [30], but rather less on visual notation-level information exchange. SVG and VRML have XML-based schema for describing rendering of visual forms, but these are very low-level and not suitable for visual notation exchange. Some tools support the exchange of visual notation information using their own proprietary formats, for example the graph description language (GDL) [1] or WilmaScope [7]. These approaches still require tool integrators to build complex data converters to exchange information with other tools. Some graph-based information exchange approaches, such as GraphML [11] and GXL, are useful for notation-level exchange between tools. However, building converters between different visual notations using these approaches still typically requires explicit coding of complex transformation algorithms.
4. Our Approach We have approached this research in two phases: in the first we have hand-built several notation converter tools to enable exchange of software architecture information between software tools. Based on our experiences, we are currently developing a prototype of a converter generator which permits specification and generation of such converters. Figure 3 provides a high level overview of the types of notation converters we have hand developed. These convert between the XML-based format of Pounamu and other tools’ formats. Pounamu can import and export information at two levels: viewbased (1), exchanging information about notations and notation instances, or model-based (2), exchanging software model information (schema or instance data). The second approach is suitable if each tool defines its own visualisation notation conventions and fully-generates its own views from the model information. The disadvantage is that there is no way to exchange information about appearance, layout and composition of visualisations. Rendering formats e.g. SVG, VRML
Converter Generators…
Rendering and/or editing tools
(5) Pounamu Tool
(1)
Views
(4) XML
Notation Converters (3)
Model
XML (2)
Model Converters
CASE tool view data e.g. SoftArch GXL, GraphML etc XMI, X-ADL, CSV, etc formats
CASE tools
Tools supporting these exchange formats… Other software tools that draw their own visualisations…
Figure 3: High-level architecture of our approach. We use notation converters to translate Pounamu view XML save formats and (3) generic visualisation notations like GXL and GraphML, (4) tool-specific formats e.g. SoftArch’s view representation or (5) low-level rendering formats e.g. SVG and VRML. Currently tool developers develop custom converters using ad-hoc architectures and implementations. Ideally we want to generate converters from specifications of mappings between notations. To achieve visual notation conversion, a source notational representational structure must be loaded, its elements traversed and converted into target visual notational elements, and this target representational structure formatted and given to a receiving software tool.
Stoeckle, H., Grundy, J.C. and Hosking, J.G. A Framework for Visual Notation Exchange, Journal of Visual Languages and Computing, Volume 16, Issue 3 , June 2005, Elsevier, pp.187-212.
From our experiences with this work we have identified some key requirements for the notation converter generator framework that we want to develop. Our main requirements for such a framework include: • A notation description language that can describe each token/element/node of a notation. We would like a language that allows us to classify different parts of a visual notation e.g. tokens vs. simple elements vs. complex elements vs. repeating elements and so on, to aid its transformation. • Visual notation definitions in this language are used to generate a graph-based object representational structure for each notation which will be used to hold instances of the notation for transformation. Each element in our graph-based object structure can manipulate, add or remove other elements in the graph-based structure, allowing complex manipulation of notational elements during transformation. • A flexible inter-notation mapping specification language which can be modified without changing internals of the converter or its elements. This language specifies transformations from source visual notational elements to target elements. Such transformation specifications range from simple (e.g. 1 to 1 token conversions), or very complex e.g. large structural rearrangement from the source notation representational form to the target notation representational form. • The graph-based object structure must provide expressive search facilities to make every element accessible in various ways, supporting complex queries over each notational structure. Our experiences with complex visual notational conversion indicate that such conversions can become very complex with major reorganisational of structural parts of the source notation representation, as well as token-level transformations. • Where appropriate, notational element descriptions can include user interaction and access a complete programming language for further extensions. This allows the converter framework to support arbitrarily complex conversion, but where most notational conversions can be specified and handled by the internotational mapping language. • Verifying the formal correctness of notations using a notation schema description language. This allows converter developers to express constraints in both mapping specifications and visual notation specification languages that can be formally checked to indicate incomplete and invalid transformation specifications. • A converter generator framework which takes the source and target visual notation specifications and the mappings between them expressed in the inter-notational mapping language and generates an appropriate notation converter. • Bi-directional notational conversion support. An infrastructure is needed to support converting between source notation A to target notation B and then back to notation A with a minimal loss of information. As many notational transformations are “lossy” e.g. target notation B doesn’t express all data in source A, support is needed for capturing “lost” information when converting from A to B and adding it back when doing the reverse B to A conversion.
5. Example Notation Converters In this section we describe some of our experiences developing hand-coded software visualization notation converters. In these examples we use simple static and dynamic software architecture visualization notations to illustrate the kinds of notation exchanges that we want to support between software visualization tools. As a common example to illustrate these we use a software architecture description for a video store library providing different search interfaces for customers and staff shown in Figure 1. This architecture can be viewed statically and dynamically in various ways [13, 15]. 5.1 Pounamu Notation to/from GXL Converter GXL (Graph eXchange Language) is a simple XML-based graph exchange format based on relationships between nodes and edges [18]. Originally it was used for reverse engineering, where it is supported by a variety of graph-based software tools, including converters, visualization tools, graph analysis and transformation tools, and source code extractors [5, 19, 21, 37]. We have built import and export converters for moving views to/from Pounamu and GXL. Any Pounamu-designed view format can be converted to GXL or imported from GXL into Pounamu’s XML-based view format description using these converters. These converters are implemented using the XSLT transformation scripting language, which converts the Pounamu view XML format to and from the GXL format. We chose XSLT to implement these GXL converters as both notations use XML-based formats for visualisation notation information description and for the ease with which we could change these XSLT scripts during converter development and future extension.
Stoeckle, H., Grundy, J.C. and Hosking, J.G. A Framework for Visual Notation Exchange, Journal of Visual Languages and Computing, Volume 16, Issue 3 , June 2005, Elsevier, pp.187-212.
Figure 4 shows a view of the video system architecture designed with the SoftArch tool (1); this view’s corresponding Pounamu view XML format (2); and the result GXL file using the developed converter (3). This architecture visualisation is a simple static structure view and one that we may wish to view in a variety of different software and interface tools e.g. SoftArch, Pounamu, Argo/UML, an SVG or VRML web browser plug-in. The GXL and Pounamu XML formats are quite similar in structure and purpose so implementing these converters was relatively straightforward. However, when importing GXL-described views into Pounamu views a set of graph layout defaults must be added to the newly generated Pounamu view model as these do not exist in many GXL descriptions. This layout generation was implemented with a Java algorithm using the DOM interface provided by Java’s XML parser to enable standardized access to the structure of the imported Pounamu XML-format view documents. Java was used so that complex computation could be used and because some information in Pounamu has no direct relation to GXL but may used by some tools (e.g. shape design, position or size). To support these tools we divided the document into different parts (GXL and properties) and added references in the GXL document to the corresponding property file. The limitations of XSLT with respect to file access required also the use of a programming language. When exporting Pounamu XML format views to GXL we leave the Pounamu layout information in the GXL format. As this isn’t used by some 3rd party GXL-based tools it may be ignored and lost if the data is re-imported into Pounamu or other tools. Our GXL import/export converters for Pounamu enable any Pounamu-defined visual notation views to be converted to and from GXL representations. Thus any GXL-compliant software or graph-manipulation tool can consume and/or produce information that can be viewed and edited within our Pounamu meta-tool environment. New visualisation notations designed in Pounamu and view instances of these notations can be exchanged with these tools via the GXLbased common exchange format. (2)
(3)
(1)
Figure 4: An example of converting a Pounamu XML format architecture visualization into GXL. 5.2 GXL to SVG Converter SVG (Scalable Vector Graphics) is a recommendation of the W3C group [38]. The main goal of the SVG format is to describe two-dimensional graphics in XML. Our interest in SVG was as a vehicle to provide developers a thin client interface with limited interaction. Currently Pounamu provides a thick-client interface for editing views of software information e.g. the software architecture diagrams shown previously are all viewed and edited via a desktop environment. The availability of SVG as a plug-in for every common browser makes it a very portable front-end for viewing and/or editing graph-based information visualisation notations, including those for software tools. A developer could for example use an SVG plug-in in a browser to view models designed with Pounamu without having the Pounamu system being locally installed. A very limited converter from GXL to SVG already exists and we initially attempted to adapt this to allow Pounamu views to be converted to SVG, using GXL as an intermediate format, for viewing in browsers [19]. However a major drawback of this converter proved to be a lack of support for hierarchies (graphs inside graphs) and this is an important issue for a breakdown of a complex systems. Our example software architecture visualisation notations all use limited forms of this [15]. In addition, the implemented layout algorithm in this 3rd party GXL to SVG converter is only able to arrange all nodes in a circle, which is extremely unsatisfactory for many applications such as our software architecture
Stoeckle, H., Grundy, J.C. and Hosking, J.G. A Framework for Visual Notation Exchange, Journal of Visual Languages and Computing, Volume 16, Issue 3 , June 2005, Elsevier, pp.187-212.
visualisation notations. Converting model information to SVG with this converter also loses some information e.g. directions of the edges and links between nodes.
(1)
P ounam u view X M L
(2)
X S LT T ra nslator
GXL Interm ediate form at
X S LT T ranslator
SV G XM L
Figure 5: Example of an SVG software architecture view in a web browser (2) converted from a Pounamu view (1) via an intermediate GXL format. To overcome these problems we have developed a new GXL to SVG converter that enables hierarchical graph-based notations to be converted, uses a more flexible layout algorithm, and preserves more of the GXL-described notation characteristics in the SVG format. Figure 5 shows a video system architecture (1) converted to SVG (2) and viewing this SVG-format software architecture diagram in a web browser with an SVG plug-in. This was a Pounamu view initially converted into GXL by our Pounamu GXL converter. For Pounamu based models we could simply use the layout information provided in the property files generated from our Pounamu to GXL converter. For conversions from pure GXL based models a number of complexities arose, therefore we used a modified version of the GXL to Pounamu converter (which provided the layout information) and did calculations to arrange the shapes appropriately. For converting the GXL data format into SVG data format we didn’t used XSLT because the process required more complex operations than are provided by XSLT. We also had to convert the GXL data format into SVG format, rearranging the structure of the XML data significantly in places. The generated SVG-format software visualisations can then be viewed in a web browser using a suitable SVG plug-in. Our converter from GXL to SVG can be accessed via a URL and runs as a servlet to enable distributed users to access the architecture diagrams from their browsers. We have only implemented a converter from GXL to SVG, since the plug-ins are view only and Pounamu users interact with the SVG-format visualisations via browser-based scripting. We have not investigated converting SVG into GXL or Pounamu’s own view XML format. 5.3 GXL to VRML Converter X3D is a XML-based standard notation for defining interactive web- and broadcast-based 3D content integrated with multimedia [34]. X3D is the successor of VRML [35], the original ISO standard for web-based 3D graphics and extends it with new features, additional data encoding formats, stricter conformance, and a component based architecture allowing a more modular approach. X3D is intended for use on a variety of hardware devices and in a broad range of application areas such as engineering, multimedia presentations, and shared virtual worlds. Our aim in building a converter from the GXL format to the X3D format was to provide developers with a 3D-based static and dynamic view of software system information. This is in contrast to developing 3D views in Pounamu, which would be an enormous effort. In our software architecture examples, we may wish to view large, complex static architecture dependencies and other structural relationships using VRML-style 3D virtual environments. We may also want to view complex dynamic information about a software architecture, such as architecture performance measurements, using a 3D approach (e.g. the number of calls can be expressed in the size of shapes; requests across a network link can be expressed by thickness or colour of links between client and server nodes and so on) or other dynamic aspects as animation. A key advantage of such visualisations using 3D virtual reality environments is that navigation of the complex models is more intuitive, via direct manipulation of the environment, zoom in and zoom out and three-axis rotations. Figure 6 shows a simple visualization of our video system architecture example in a VRML web browser plug-in. This uses colour to show the frequency of function calls related to various architecture components of the video system. The designer can rotate the models in 3 dimensions; can zoom in and out, click on nodes/links to request detailed information
Stoeckle, H., Grundy, J.C. and Hosking, J.G. A Framework for Visual Notation Exchange, Journal of Visual Languages and Computing, Volume 16, Issue 3 , June 2005, Elsevier, pp.187-212.
about the performance measures and the architecture components to be shown. In previous work, we tried to show such information using 2 dimensional views in SoftArch, and user feedback indicated difficulty in navigating and interpreting the information [14].
Figure 6: Example of a software architecture diagram converted to VRML from GXL. We implemented the GXL to VRML conversion by building a Java converter that translates GXL nodes and links into VRML 3D scene description elements. This converter also performs simple layout to ensure that the resulting scene elements are separated using basic heuristics If available, it uses the Pounamu layout information added to the GXL by our Pounamu-to-GXL converter. For simple architecture visualisations based on the GXL representation the same layout algorithms as for two dimensions can be used. For very complex visualisations, use of the extra dimension in VRML needs to be made to minimise the visual complexity of the view. We have only made very basic use of this third dimension in our converter to date. Another feature of VRML and X3D we could make further use of is control of viewing and navigation via proximity sensors and scene interaction event-handling.
6.
A Unified Notation Mapping Language
Motivated by the similarities in many converters and the effort involved in developing them, we have been developing a general approach for modelling the conversion between different notations. Our approach is being realised as a Javabased converter-generator framework that will enable developers to describe inter-notation mappings and have suitable visualisation notation converters generated for them. The architecture consists of two tools. A Unified Notation Mapping (UNM) specification language provides a notation format specification facility along with a notation mapping specification syntax, allowing developers to describe a mapping from one visual notation to another. To support the user through this process we provide a UNM development tool. An Automatic LAnguage MApper TOol (ALAMATO) is used to translate UNM inter-notation mapping specifications into specific notation-to-notation converter implementations. Figure 7 shows the basic structure of the UNM. It supports the description of a visualisation notation (1), in terms of fundamental notation elements and their inter-relationships. UNM supports text-based file formats (we assume each visual notation has a textual “save” format) and generates, with the interactive help of the developer, a dictionary (2) which specifies the syntactic structure of the notation. This dictionary is used by ALAMATO to generate a converter between two different visual notations. The dictionary structure can be annotated by editors (3) to specify additional behaviours, with the resulting structures represented as Java code (4). UNM is also used to create a mapping table (5), to provide ALAMATO with the required mapping information for each notation. Storing the mapping information separate from the dictionary has the advantage of more flexibility of mapping. Different users may want different mappings for specific languages, e.g. one user wants to have a GXL node to SVG mapped as a rectangle and another user prefers another shape. The user has only to change the mapping table, not the more complex dictionary which contains the implementation (action) part of the notation and how each element in the notation is represented. External editors can be used to extend the existing functionality, for example doing boundary checking, setting special dynamic behaviours (in the simplest form adding date or time to an output notation), or more complex functions such as layout generation. External editors can also be used for including notations not viewable directly in UNM, such as graphic formats (GIF, JPEG) or text document formats (PDF, MS Word documents). For this, UNM generates a skeleton and the functionality can be implemented using an editor tool. Each notation has to have a connector which is used to transform the notations information into the graph-based structure which is used by the framework. Output facilities are not necessarily required, for example when the UNM framework is only used to visualize
Stoeckle, H., Grundy, J.C. and Hosking, J.G. A Framework for Visual Notation Exchange, Journal of Visual Languages and Computing, Volume 16, Issue 3 , June 2005, Elsevier, pp.187-212.
information. For XML-based notations no such converter has to be developed because XML itself provides enough information to process this step automatically. Dictionary
New notation (2)
(1)
External editors
(3)
(4) Java compiler
UNM (5) Mapping table
Figure 7: UNM and its components. Figure 8 shows a sample dictionary containing several notations. The user designs this hierarchy in UNM and UNM automatically assigns the corresponding tags used for this node. These tags can be used to both find the node in input files and also later to create the output file. The dictionary consists of two types of nodes, structure nodes and content nodes. Structure nodes provide dictionary structure and category branches. Examples are in Figure 8 the nodes PureGraphFormats and GraphicalFormats which categorize different notation types. Content nodes represent the corresponding Java classes and have patterns, which corresponds to the representation in the notation. External editors can be used to annotate each node. A node can also contain a list of nodes, for example to support structures similar to a number of rectangles embedded in a canvas. To validate the correct use of nodes (normally before storing the output format), UNM can be requested to check for correctness which is described in XML Schema [40] for each notation. XML Schema is normally used for XML-based structures, but we use it to describe the nodes in the UNM structures. Figure 9 shows how to specify mappings between notations. To illustrate the mapping we use the video system architecture, (1) shows the Pounamu view and (2) how it is represented in GXL. Developers can use existing data in one notation and model the mapping based on this. Because of UNM’s extensibility (no hard-coded mapping rules) users can start with a small set of mapping rules and refine them when necessary. Arrows describe which elements a mapping should be applied between and also the direction, e.g. in the example the shape element in Pounamu is mapped to the node element in GXL and vice versa (3). UNM generates for both elements an entry point, i.e. the shape element will have a convert method with the node element in GXL as parameter. For complex mappings, i.e. different order or number of parameters the developer has to implement the corresponding rules. G eneral
P ureG raph F orm ats
G raphical F orm ats
GXL
G raphX M L
SV G
…
< GraphX M L>… < /G raphX M L>
< svg>…
G ra ph
G raph
< graph> … < /grap h>
…
VRM L
N ode
E dge
N ode
E dge
< nod e>… < /nod e>
… < /edge>
< node>… < /node>
… < /edge>
Id
Id
F ro m
To
Name
Figure 8: Part of a UNM dictionary.
Source
T arget
Stoeckle, H., Grundy, J.C. and Hosking, J.G. A Framework for Visual Notation Exchange, Journal of Visual Languages and Computing, Volume 16, Issue 3 , June 2005, Elsevier, pp.187-212.
The UNM tool also provides a tree-based view of the dictionary and the mappings, which can be used to categorize elements. An example is shown in Figure 10 representing a small part of a mapping table for GraphXML, GXL, SVG and VRML, being specified in our prototype UNM tool. Mappings can be designed using UNM or by editing the generated mapping table code which is described in GXL. This table gives ALAMATO information about how the nodes are to be mapped between notations. Virtual nodes can be used, which provide no output but categorize the mappings, for example the node Shape (1). Another type of node enables links between branches and guarantees only a single child node in another branch. For example, it is not possible to assign a child node other than a Rectangle to the link node NodeShape based in the Shape branch (2), explicitly specifying that Nodes from GXL or GraphXML have to be mapped to SVG or VRML as rectangles. All nodes are eventually derived from a GeneralNode (via MultipleValueNode for Edge (3)) which provides basic functionality required by every node such as analysing the textual form of the nodes, set and get values etc. (1) (2)
(3)
Figure 9. Example of Pounamu XML to GXL UNM specification.
Stoeckle, H., Grundy, J.C. and Hosking, J.G. A Framework for Visual Notation Exchange, Journal of Visual Languages and Computing, Volume 16, Issue 3 , June 2005, Elsevier, pp.187-212.
(1)
(3) (2)
(4)
(5)
Figure 10: Example of a mapping table in the UNM specification tool. In the constructor of each node the textual representation is specified (4) which is used by GeneralNode to construct the node’s textual form and identify the parameters of a node. Figure 10 also shows how to specify more information about each node (5). UNM has similar navigation facilities to an XML DOM to retrieve documents for specific type of nodes.
7. ALAMATO Notation Converter Generator The architecture of our ALAMATO (Automatic LAnguage MApper TOol) is shown in Figure 11. This tool generates a custom inter-notation mapping converter to translate one visualisation notation format into another. It bundles the requested notations from the dictionary (with schema description) and their mapping tables to build a converter package. ALAMATO also removes all non required mapping rules from the requested notation nodes before generate the converter package, i.e. when a converter from GXL to/from SVG is needed, it removes for example the converting rules for VRML in both notations before deploying it. Dictionary Converter ALAMATO Mapping table Input Notation Format
Output Notation Format
Figure 11: ALAMATO converter generator approach. The deployed converter uses the UNM-specified mapping scheme to generate the structure and node conversion from the input notation to the output notation. During the process of generating the graph structure each node in the dictionary has a life-cycle. The framework provides every node with the capability of reacting to events when the node is created, when the node has to convert from the input notation and when the node is destroyed/removed. ALAMATO can be customized to trigger the conversion event for each node to be iterative (which results in a parser-like behaviour); after the graph-based structure is completely created or both. ALAMATO iterates over all nodes and requests their conversion status until all nodes report their conversion process complete. After the complete conversion, ALAMATO validates the
Stoeckle, H., Grundy, J.C. and Hosking, J.G. A Framework for Visual Notation Exchange, Journal of Visual Languages and Computing, Volume 16, Issue 3 , June 2005, Elsevier, pp.187-212.
output structure before storing it. The output visualisation notation information is then formatted into the output format for consumption by another tool. ALAMATO can be used to prevent loss of information when converting from tool A to tool B for modification and then back to tool A. Figure 12 illustrates how this can be achieved. Information described in the notation of tool A is converted into the notations of tool B using ALAMATO. Some information could not be converted and is lost (1). This is a typical scenario which for example occurs in Section 5.1 when converting from Pounamu, which provides layout information, to GXL, which doesn’t. When converting back from GXL to the Pounamu after editing operations, ALAMATO can use the original version of information (2) to generate an output graph in Pounamu which reinserts the information which was not converted into GXL. Also it generates from Pounamu a graph in GXL, which is used for comparison to identify the differences made. In Figure 12 the differences are 3 new nodes. Only for these nodes is the conversion process (3) invoked. Pounamu
(1)
Pounamu
(2)
Converter Converter (3) GXL
GXL
Editing
Figure 12: ALAMATO using the template mechanism.
Stoeckle, H., Grundy, J.C. and Hosking, J.G. A Framework for Visual Notation Exchange, Journal of Visual Languages and Computing, Volume 16, Issue 3 , June 2005, Elsevier, pp.187-212.
8. Discussion We provide an assessment of current visual notation conversion approaches that are used in software tools and diagramming tools at present. We then assess our UNM’s ability to represent visual notation information models and to express mapping transformation specifications between these models. We compare and contrast our ALAMATO converter generation architecture to existing approaches to realising notation converters and conclude with a summary of our current and future research plans. 8.1 Current Visual Notation Conversion Approaches The issue of integrating software notation-supporting tools has existed for a very long time, with a wide variety of approaches used to address the problem. Table 1 summaries many of the common approaches to addressing this problem. Some approaches focus on user interface or presentation integration, such as shared GUI frameworks or WWW browser [22, 28, 29], OLE-style Embedded Objects, or shared desktops (e.g. VNC) and application sharing (e.g. MS NetMeeting™). None of these approaches address the issue of notation translation but instead force users to utilise only the capabilities of the shared editing tool and its own presentation of notation elements. Control integration approaches [28, 36, 7] utilise APIs, plug-ins and event exchange to integrate tools. These enable a form of indirect notation transformation by changing model and view information state in other tools programmatically. However these typically require low-level programmatic solutions that are very time-consuming to build, maintain and extend. Approach
Examples
User Interface Integration/Sharing
OLE, VNC, MS NetMeeting™, CHIME
Control Integration
Eclipse plug-ins, FIELD tools
Database sharing
Federated databases
Model-based data exchange
XMI, GraphML
Domain-specific notation converters
GXL, GXL2SVG
General-purpose Translator Generators Notation converter Generators
XSLT UNM and ALAMATO
Summary of Advantages and Disadvantages +Can access notation views inside other tool windows or on other users’ desktop +Notation “exchange” is not required -Limited to using only facilities in other notation supporting tool -Often not supported by many existing tools +Powerful and flexible approach +Supports indirect notation transformation between tools -Requires low-level programmatic solutions via API calls etc -Limited by suitability of other tool APIs – some do not adequately support notation-level transformation at all +Common information repository removes need to transform data between tools -Tools must be built to share same data formats and database APIs -Notation-level sharing or translation of information often not supported +Decouples tools fully, unlike user interface, control and shared databases -Don’t support notation-level information transformation explicitly, often loosing much e.g. position, size, colour etc information -Both tools must agree on and support same data representation in exchange format +Domain-specific notation exchange formats and translator tools +Ready-to-use conversion facilities as a black-box -Fixed facilities as provided by converter implementer -Have to program in low-level, general-purpose language to build new converters -Complex to understand and evolve +easier to built converters than with standard programming languages - not visual notation-domain specific, meaning more effort to develop translators +high-level domain-specific framework and IDE for specifying and generating notation translators -Need escape to low-level programming language for very complex conversions
Table 1. Summary of common notation integration approaches. Over many years of research into software visualization and the development of a wide variety of software visualization-supporting tools we have identified the need to support inter-notation translation i.e. the exchange of view (or visualization)-level information between tools, not just model-based information exchange. Examples of such visual notation conversion includes exporting a visual model from one modelling tool, like Pounamu, to another, like SoftArch or Argo/UML, where we want to preserve the basic layout and look-and-feel of the visual model. Other examples include converting a Pounamu, SoftArch or Argo/UML diagram into GXL (for import by tools supporting this exchange format), SVG (for rendering in a SVG-enabled web browser), or VRML (for rendering in a 3D virtual environment web browser plug-in).
Stoeckle, H., Grundy, J.C. and Hosking, J.G. A Framework for Visual Notation Exchange, Journal of Visual Languages and Computing, Volume 16, Issue 3 , June 2005, Elsevier, pp.187-212.
This is a harder task in many respects to the much more common model-based tool integration [17, 30] which focuses on translating between descriptions of software information formats. Translating between notations requires the mapping of descriptions of complex views, which make use of a very wide variety of boxes, lines, colour, positioning and size parameters, text characteristics, annotations and possibly 3D structures. Most current visual software design tools only support model-based information exchange. This requires the generation of visual views from these exchanged models, losing most of the diagrammatic information in the process e.g. layout, icon size, and additional annotation like colour, font etc. In addition, in most cases if the tools do not both support the exact same visual modelling notation, they very often cannot exchange information at even a model-based level. A variety of graph-based converters have been developed [5, 19, 21, 37]. Unfortunately we found that many of these conversion tools only partially implement visual notation mappings. Many of these converters are very “lossy” and remove source notation information that can not be represented in the target notation format e.g. layout when translating into GXL. We also found that modifying them was usually very difficult due to their complexity and the large amount of low-level programming required. In addition, in some instances a tool developer will need to provide default information between notations e.g. layout, icon appearance that isn’t in the source notation information. Often existing converters don’t support this or use inappropriate defaults. Some kinds of visual notation conversion e.g. Pounamu views to Argo/UML views, require complex representational information translation as the save format of each tool is very different, even if the visual notation is quite similar. Other conversions e.g. GXL to VRML, require both complex translation of visual notation information structures and synthesis of target format information e.g. the third dimension in VRML visualisations which doesn’t exist in two-dimensional GXL data files produced by most tools. 8.2 Unified Notation Mapping Some of the complexities that need to be handled in inter-tool visual notation conversions include supporting translation between quite different notation description structures (e.g. between GXL and SVG), the defaulting of values particularly relating to layout (2D or 3D) of visualizations (e.g. Pounamu to VRML), and the translation of simple editing/hyper-linking support into scripting languages or other semantic editing/viewing control (e.g. GXL to SVG and VRML). Our Universal Notation Mapping language captures these notation mapping complexities so that software tool developers can specify inter-notation mappings at high levels of abstraction. UNM provides a technique for specifying the source and target notation information structures, by classifying notational elements into a dictionary framework. Elements and associations between elements in a visual notation thus classified then allow us to represent instances of a notation i.e. a diagram information model, with a set of objects from our framework of UNM classes. Our approach contrasts to pure XML-based approaches using Document Object Model which only support hierarchical nodes of the same type i.e. are not visual notation representational-specific. Our approach allows notation mapping specifications to leverage the classification of visual notation information structure elements for specifying structure and element mappings more easily and to provide a more efficient in-memory representational form. Our UNM dictionary is more flexible than purely XML-based formats such as GXL and SVG in that it can represent these structures and the structure of non-XML notational forms such as VRML. Mapping specifications between visual notational information models is expressed as correspondences in our UNM. These may be from one dictionary element in one notation to a similar element in another; may be from one source element to multiple target elements; may be a formula from multiple source elements to a single target element; or may be from a source information sub-structure to a target sub-structure. We designed UNM’s mapping specifications to provide a wide range of expressive power, allowing quite complex transformations from one part of a source visual notational information structure to another. In addition, we aim to support ease-of-understanding and use for notation mapping specifiers allowing them to easily understand what elements and sub-structures in the source notation structure map to those in the target. Our UNM mapping specification approach is higher-level and focused on visual notation conversion, unlike XSLT scripts for data transformation [14, 41], Rimu scripts for EDI message transformations [16], and purely coded information translation solutions, as used by most current notation converters [5]. This means that in general it provides a more suitable language for expressing visual notational mapping specifications than other current approaches. However, our UNM mapping specifications are not a general-purpose programming language, as they are targeted at notation element and structure mapping and utilise our dictionary-based classification of notation elements and structural groupings. Thus they can not express all possible mappings directly, but instead provide the user the ability to express most common notation information structure mappings we have come across to date. We allow very complex mappings not expressible in UNM to be expressed by a call to arbitrary Java code from a UNM mapping correspondence relationship.
Stoeckle, H., Grundy, J.C. and Hosking, J.G. A Framework for Visual Notation Exchange, Journal of Visual Languages and Computing, Volume 16, Issue 3 , June 2005, Elsevier, pp.187-212.
8.3 ALAMATO Converter Generator Framework Current approaches to realizing notation converters are to implement them by hand using conventional programming languages, express them in a data conversion language like XSLT, or to require the translation of visual notation information models into a common exchange format, such as GXL. Hand-implementation of converters is prone to high overheads in building and maintaining these programs, difficulty in modifying them and a combination of errors, inconsistencies, incompleteness and inappropriate conversions. Using domain-specific data conversion tools like XSLT is generally an improvement but supporting tools are not focused on the domain of visual language notation translation. Thus the corresponding effort and difficulty is still very high. Use of a common exchange format still requires the writing of converters to and from the common exchange format, using one of the previously described approaches. As such, this approach is still prone to high overheads and no domain-specific tools. Our experience with converting visual notations to and from common exchange formats to date has demonstrated that this is generally a lossy process i.e. often many source notation information structures and elements are lost in the conversion. If a target application of the converter requires backwards and forwards conversion, this solution is very poor. Our ALAMATO converter generator framework processes UNM-specified visual notation mapping specifications to automate the generation of notation converters. UNM and its supporting visual notations and IDE allow developers of converters much higher level support in describing the visual notations to convert between and the mapping specifications to use in the conversion process. ALAMATO allows multiple target converter implementations to be realised e.g. can generate a Java-implemented converter or XSLT-implemented converter depending on the requirements of the diagramming tools to be integrated. ALAMATO also provides support for “remembering” information from a source visual notation model that is not translated to the target, and is able to add this information back to a model then translated in the reverse direction, reducing lossy bi-directional transformations. 8.4 Comparative Work XSLT [41] is only useful for relatively straightforward converting processes, because it lacks the completeness of formal programming languages and it cannot be used for all kinds of notations. An advantage of XSLT is its integration of XML and related standards, which provides some basic functionality which compiler developer have to implement on their own. This includes, for example, searching for specific elements in documents using XPath [39] or validating documents with XML Schema. Compared with XSLT our framework provides several advantages. It uses a simple way of mapping by using nodes and edges which can be enriched with logging information during the development process. The translation expressed in XSLT is harder to read and to follow, therefore more error-prone than our approach. Using our framework also provides already well established tools (IDEs and libraries) for developing converters. XSLT provides no direct way for user interaction, which can be necessary the more complex transformations are. Compiler development has much in common with translator development for notations. But in detail both differs in several ways. Compiler generators (for example Yacc) lack on facilities to process structures on a higher level, for example simple functionalities like XPath to navigate to a specific element in the structure. Also the focus is different, compilers parse token by token and generate a target language, whereas notation converters can require to read the entire source before converting the source into the target. Compilers have hard-coded mapping rules and these cannot be modified or changed “on the fly”, changes in either the source language definition, the target language definition or the mapping between requires to have access to the compiler sources to modify them. Our approach can be used for an incremental development, i.e. starting with define basic elements, then refine the notation description and the mappings of the notation without touching the converter framework. Adding new notations to our framework doesn’t require access to converter internals. The only direct comparable work known in this area is the Sankhya Translation Framework (STF) [6] which is very similar to our approach but uses its own simple proprietary language to describe mappings. The Sankhya Translation Modelling language (STML) can represent multiple notations in the same model. The STF uses pluggable streams modules to provide different data sources, for example for file and database access. It also provides facilities to trigger actions for each element. STML doesn’t provide a complete programming language and therefore more complex tasks and user interaction has to be implemented in a traditional programming language using the STF library. STML doesn’t provide any search facilities nor is as easy to extend as UNM is and doesn’t provide any formal validation of the output. To our knowledge no other tool provides an approach similar to our template mechanism which could be one of the main advantages of our framework. The mixture of all these different technologies (GXL, XML Schemata, a mapping table which is exchangeable and separated from the dictionary, direct use of the Java programming language and its extensibility) makes it an interesting alternative to existing approaches.
Stoeckle, H., Grundy, J.C. and Hosking, J.G. A Framework for Visual Notation Exchange, Journal of Visual Languages and Computing, Volume 16, Issue 3 , June 2005, Elsevier, pp.187-212.
8.5 Future Work Our current work focuses on refining the current prototype Unified Notation Mapping dictionary representational structures and mapping specification representations. We are applying this prototype UNM to representing Pounamu diagrams, GXL-encoded diagrams, Argo/UML diagram export files, SVG 2-dimensional diagram models, and VRML 3dimensional virtual world models. This allows us to determine if the UNM is flexible enough and can directly express most mapping transformation specifications between different parts of these quite different visual notational models. We are developing a visual language and IDE for the UNM to allow users to model their visual notational models and to express transformations between source and target model elements and structures. We are implementing a converter generator using the ALAMATO architecture, initially focusing on interpreting UNM specifications to realise our converters and assuming source and target notation information models in an XML-based data format. We are then going to generate Java, XSLT and possibly domain-specific mapping language scripting code from UNM specifications via the ALAMATO approach, allowing a range of notation converter implementations to be realised from the same UNM specification. We will also implement notation information model parsers and unparsers, allowing our generated converters to read and write source and target visual notation information models in non-XML formats e.g. concrete VRML, GIF and SVG formats. Further work will look at generating optimised converter code where necessary to achieve high levels of performance when converting visual notations in some domains e.g. dynamic web page diagram content generation. Where appropriate we aim to add generation of editing action conversions (i.e. view editing and navigation interactions) between different software tools. This would allow developers to readily exchange software visualization notations (appearance – view syntax) as described in this paper, as well as interaction behaviour (editing – view semantics) between software tools and 3rd party visualization products.
9. Summary We have developed a number of software visualization converters that support the translation of notation instance descriptions between a range of formats e.g. our custom Pounamu XML format and the general GXL format; GXL and SVG; GXL and VRML; and have investigated translation between GXL and Excel chart, Visio diagram and GXL and GIF/image map renderings. From our experiences building these visual notation converters we have designed a converter generator framework that allows tool developers to specify inter-notation mappings and to have custom visualization notation converters generated from these mapping specifications. We have developed a Universal Notation Mapping language and prototype notation specification tool and are developing an automatic converter generator from these specifications.
Acknowledgements The helpful comments of the anonymous referees are gratefully acknowledged. Hermann Stoeckle was supported by a scholarship from the Department of Computer Science, University of Auckland, and parts of this research were supported by the Foundation for Research Science and Technology.
References 1. 2.
Absint. aiSee – Graph Visualization. http://www.absint.com/aisee/. Bandinelli, S., Di Nitto, E., and Fuggetta, A. Supporting cooperation in the SPADE-1 environment, IEEE Transactions on Software Engineering, 22 (12), December 1996, 841-865. 3. Beaumont, M. and Jackson, D. Visualising Complex Control Flow. In 1998 IEEE Symposium on Visual Languages, Halifax, Canada, September 1998, IEEE CS Press, pp. 244-253. 4. Booch, G., Rumbaugh, J. and Jacobson, I. The Unified Modelling Language User Guide, Addison-Wesley, 1999. 5. GCF – a GXL Converter Framework. http://www2.informatik.unibw-muenchen.de/GXL/triebsees/. 6. Desikan, M. and Bulusu G.K., SANKHYA Translation Framework, FSE/SIGSOFT Workshop on Tool-Integration in System Development, Sept 1-2, 2003, Helsinki, Finland, http://www.es.tu-darmstadt.de/english/events/tis/. 7. Dwyer, T. and Eckersley, P., WilmaScope – An Interactive 3D Graph Visualisation System, In Proceedings of the 9th International Symposium on Graph Drawing (GD 2001), Vienna, Austria, Sept. 23-26, 2001, LNCS 2265, Springer, pp. 442-443. 8. Eclipse. http://www.eclipse.org. 9. Egyed, A. and Kruchten, P., Rose/Architect: a tool to visualize architecture, In Proceedings of the 32nd Hawaii International Conference on System Sciences, January 1999, IEEE CS Press, pp. 8066. 10. Emmerich, W., Arlow, J., Madec, J., and Phoenix., M., Tool Construction for the British Airways SEE with the O2 ODBMS, Theory and Practice of Object Systems, 3 (3), 1997, 213-231. 11. The GraphML File Format. http://graphml.graphdrawing.org.
Stoeckle, H., Grundy, J.C. and Hosking, J.G. A Framework for Visual Notation Exchange, Journal of Visual Languages and Computing, Volume 16, Issue 3 , June 2005, Elsevier, pp.187-212.
12. Gray, .J.P., Liu, A. and Scott, L. Issues in software engineering tool construction, Information and Software Technology, 42 (2), January 2000, Elsevier, 73-77. 13. Grundy, J.C. Software Architecture Modelling, Analysis and Implementation with SoftArch, In Proceedings of the 34th Hawaii International Conference on System Sciences (Software Architecture Mini-track), January 3-6 2001, Maui, Hawaii, IEEE CS Press, pp. 9051. 14. Grundy, J.C., Cai, Y. and Liu, A. Generation of Distributed System Test-beds from High-level Software Architecture Description, In Proceedings of the 16th International Conference on Automated Software Engineering, San Diego, USA, Nov 26-29, 2001, IEEE CS Press, pp. 192-200. 15. Grundy, J.C. and Hosking, J.G. High-level Static and Dynamic Visualisation of Software Architectures, In Proceedings of the 2000 IEEE Symposium on Visual Languages, Seattle, Washington, USA, Sept. 10-14, 2000, IEEE CS Press, pp. 5-12. 16. Grundy, J.C., Mugridge, W.B., Hosking J.G. and Kendal, P. Generating EDI Message Translations from Visual Specifications, In Proceedings of the 16th International Conference on Automated Software Engineering, San Diego, USA, Nov 26-29, 2001, IEEE CS Press, pp 35-42. 17. Grundy, J.C. and Hosking, J.G. Software Tools, Wiley Encycolpedia of Software Engineering, 2nd Edition, Wiley, December 2001. 18. GXL (1.0) Tools. http://www.gupro.de/GXL/tools/tools.html. 19. GXL2SVG. Example of the JGraph project. http://jgraph.sourceforge.net/downloads.html. 20. Hill, T., Noble, J. Visualizing Implicit Structure in Java Object Graphs, In Proceedings of SoftVis’99, Sydney, Australia, Dec 5-6 1999. 21. Hold, R.C., Winter, A., and Schürr, A. GXL: Toward a Standard Exchange Format, In 7th Working Conference on Reverse Engineering, Brisbane, Australia, Nov. 23 - 25, 2000, IEEE CS Press, 2000, pp. 162-171. 22. Kaiser, G.E. Dossick, S.E., Jiang, W., Yang, J.J., Ye, S.X. WWW-Based Collaboration Environments with Distributed Tool Services, World Wide Web, vol. 1, no. 1, 1998, Kluwer Academic Publishers, pp. 3-25. 23. Kafeza, E., Chiu, D. and Cheung, S.C. Alert-Driven Process Integration in a Web Services Environment, In Proceedings of the 1st International Conference on Web Services, Las Vegas, USA, June 23-26, 2003, CSREA Press, pp. 145-151. 24. Liu, A. Dynamic Distributed Software Architecture Design with PARSE-DAT, In Proceedings of Software – Methods and Tools, Wollongong, Australia, Nov. 6-9, 2000, IEEE CS Press, pp. 199-210. 25. Meyers, S. Difficulties in Integrating Multi-view Editing Environments, IEEE Software, 8 (1), Jan. 1991, pp. 49-57. 26. Quantrani, T. Visual Modeling With Rational Rose and UML, Addison-Wesley, 1998. 27. Reiss, S.P. A framework for abstract 3-D visualization, In Proceedings of the 1993 IEEE Symposium on Visual Languages, Bergen, Norway, August 24-27, IEEE CS Press, pp. 108-115. 28. Reiss, S.P. Connecting Tools Using Message Passing in the Field Environment, IEEE Software, 7 (7), July 1990, pp. 57-66. 29. Reiss SP. The Desert environment. ACM Transactions on Software Engineering & Methodology, 8 (4), Oct. 1999, pp.297-342. 30. Robbins, J. and Hilbert, D.F. Extending design environments to software architecture design, Automated Software Engineering, Vol. 5, No. 3, July 1998, pp. 261-390. 31. Stankovic, N. and Zhang, K. Towards Visual Development of Message-Passing Programs, In Proceedings of 1997 IEEE Symposium on Visual Languages, Capri, Italy, 23-26 September, 1997, IEEE CS Press, pp. 144-151. 32. Thompson AK. CASE data integration: the emerging international standards. ICL Technical Journal, 8 (1), May 1992, pp.54-66. 33. Wasserman, A. Tool Integration in Software Engineering Environments, in Software Engineering Environments: International Workshop on Environments, Berlin, 1990, Springer-Verlag, pp. 137-149. 34. The Web3D Consortium. Extensible 3d (x3d) graphics. http://www.web3d.org/x3d.html. 35. The Web3D Consortium. The virtual reality modeling language. http://www.web3d.org/Specifications/VRML97/. 36. Wilcox et al. A CORBA-Oriented Approach to Heterogeneous Tool Integration; OPHELIA, FSE/SIGSOFT Workshop on ToolIntegration in System Development, Sept 1-2, 2003, Helsinki, Finland. 37. Winter, A. Exchanging Graphs with GXL, In Proceedings of the 9th International Symposium on Graph Drawing (GD 2001), Vienna, Austria, Sept. 23-26, 2001, LNCS 2265, Springer, pp. 485-500. 38. World Wide Web Consortium (W3C). Scalable Vector Graphics (SVG) 1.0 Specification. http://www.w3.org/TR/SVG/. 39. World Wide Web Consortium (W3C). XML Path Language (XPath) Version 1.0. http://www.w3.org/TR/xpath. 40. World Wide Web Consortium (W3C). XML Schema 1.1. http://www.w3.org/XML/Schema. 41. World Wide Web Consortium (W3C). XSL Transformations (XSLT) Version 1.0. http://www.w3.org/TR/xslt.