A Framework to Automate Travel Activity Inference Using Land-Use Data: The Case of Foursquare in the Greater Toronto and Hamilton Area Tamer Abdulazim, M.Sc. PhD Candidate 1 Phone: 647-503-0555 Email:
[email protected] Hossam Abdelgawad, Ph.D. Postdoctoral Fellow 1 Assistant Professor, Cairo University, Faculty of Engineering 12631, Giza, Egypt Tel. 416-978-5049 Email:
[email protected] Khandker M. Nurul Habib, PhD, P.Eng Assistant Professor 1 Phone: 416-946-8027 Email:
[email protected] Baher Abdulhai, PhD, PEng Professor 1 Phone: 416-946-5036 Email:
[email protected]
1 Department
of Civil Engineering University of Toronto
35 St. George St. GB105 Toronto, ON M5S 1A4
Fax: 416-978-5054
Number of Words: 6063 (text) + 1250 (figures and table) = 7312 Submission Date: March, 2015 Forthcoming in the Transportation Research Record: Journal of the Transportation Research Board (TRR Journal)
Abdulazim, Abdelgawad, Habib and Abdulhai
1
Abstract This paper introduces a framework for inferring activity-travel given nearby land-use information that can be obtained from location-based social network (LBSN) such as Foursquare. The first component of the framework implements a generic method to acquire land use data from LBSN services which is a prerequisite for the inference algorithm. Three inference algorithms are suggested with brief discussion on the situations where each algorithm might be a better fit. Finally, a case study in which we apply activity inference on a dataset collected in the Greater Toronto and Hamilton Area (GTHA) during the fall season of 2012. Results are encouraging and clearly suggest that it is possible to automatically infer daily activitytravel, which could significantly reduce personal travel survey burden and allow for long period travel diary data collection that is currently not easily achievable with traditional survey methods.
Abdulazim, Abdelgawad, Habib and Abdulhai
2
INTRODUCTION High quality and comprehensive data on personal travel activities is absolutely essential to the planning and design of urban transportation systems. Such data is typically derived from a variety of sources, the most common of which is travel survey methods that provide the core data for understanding and modelling trip-making and the transportation system at large. Without adequate data on personal travel activities it is impossible for transport planners and policy makers to understand the transport needs nor the issues to address. To respond to this fundamental need for data collection, transport agencies have invested considerable resources on traditional on-going travel surveys methods. Although providing a rich source of information to understand travel demand patterns, traditional travel surveys (e.g., landline-based telephone interviews, mandatory census forms, pen and paper) suffer from the following: 1) pose a burden on survey participants as they are required to recall and record their daily activities, 2) run only for a short period of time, and 3) very costly and cumbersome to design, run and maintain. Collecting personal travel diary using traditional survey methods commonly run for a few days only or at most a few weeks to reduce the survey burden. Such limitation on the data collection period, reduces our ability to have a long period activitytravel diary data that is necessary to capture travel patterns that might not occur within the short survey period including recreational, social or shopping trips. Emerging information and communication technologies, however, are rapidly introducing new data collection methods - including GPS-assisted, smartphones, web - that could potentially address some of the limitations facing traditional survey methods (1). Similarly advances in statistical machine learning and classification algorithms offer a new realm for analyzing, inferring, and mining diverse datasets; and making good use of these diverse datasets. Additionally, the availability of crowdsourced location-based data, such as Foursqaure and YellowPages (2) (3), provides the access to a potentially very rich, new, and useful source of information to transportation professionals and researchers. Research Motivation and Objectives This paper is motivated by the need to reduce the burden on travel survey participant to infer trip activity information, the advances in data collection methods, and the availability of rich, yet not fully utilized, crowd-sourced data about land use and location-based data. This paper contributes to this motivation by investigating the use of crowdsourcing location-based data to automatically infer the travel activity or trip purpose given that the trip destination location is known. By automatically inferring activities, we anticipate that the survey burden can be reduced significantly as participants will not be required to recall and record activities, a step that is possible to identify automatically. The activity inference method presented in this paper can be seamlessly applied regardless of the data collection method (e.g. GPS-assisted or web survey) as long as the following requirements are met: 1) there are reasonably accurate trip destination location traces - which can be either collected in real time or part of a dataset that was collected in the past ; and 2) there is available of location-based data - which is typically the case in any area where people have access to Internet via Foursquare. The challenge that we address in this paper is how to infer activity or trip purpose given destination location traces of personal trips. To address this challenge, this paper investigates using location-based data sources such as Foursquare which provides rich land use information that can be used to infer the activity. For example, if the land use around a specific destination location is mostly shops or a major shopping mall this will increase the likelihood that the activity is shopping. However, inference is not that simple in reality
Abdulazim, Abdelgawad, Habib and Abdulhai
3
because of the mixed-use nature of many urban cities, in other words, also a trip to a shopping mall can be a business trip for someone who is working in a shop in the same area. This approach is supported by many studies that suggest a strong correlation between activity-travel pattern and the land use #CITE, hence acquiring rich land use data from location-based social network such as Foursquare could contribute to address this challenge. Another advantage of this approach is that social network data is relatively easy to obtain, will continue to grow, and mostly free via Application Programming Interfaces (APIs), i.e., data can be queried by applications via web services. Paper Structure The reminder paper is divided into four main sections: first, the literature review which surveys the related work such as applications of crowdsourcing location-based data and techniques for inferring trip purpose (throughout the paper the term activity and trip purpose are being used interchangeably to emphasis that the proposed method can be used to determine the trip main purpose and to some extent to infer activities that take place in close vicinity). Second section explains how location-based data can be acquired from services such as Foursquare, also it discusses preprocessing techniques for trip destination traces before it can be used as input to activity inference algorithms. Third section presents different variations of activity inference algorithms and shows how Foursquare data is being used. Fourth section compares the performance proposed inference algorithms on a case study in the Greater Toronto Area (GTA); insights and limitations are also discussed in the same section.
LITERATURE REVIEW Finding innovative ways to incorporate emerging technologies to reduce survey burden and hence enhance the data quality and extend the collection period is an active and growing research area. Related studies can be categorized into three main areas. First, finding innovative data collection modes that replaces traditional pen and paper travel diary. Computer-assisted, web, GPS, handheld devices and recently smartphones are examples of such technologies (4). Second, and more recently, there has been growing effort to utilize different data sources such as crowdsourcing and social networks, including Foursquare, to infer travel activities. Third, many activity inference techniques have been proposed that uses heuristics, algorithms or machine learning to automatically identify trip purpose (5) (6). In this section we focus our literature review on: 1.
Applications of crowdsourcing and Foursquare data
2.
Techniques for inferring trip purpose
Crowdsourcing - by definition - represents the act of a company or institution to employ the crowd to perform a task that could have alternatively been conducted by an assigned group of employees, and outsourcing this task (or function) to the public/community in the form of an open call. In the context of travel activity data, crowdsourcing platforms has been used to collect macro data for an entire city or a roadway network; such data could be used to monitor traffic, and to observe overall transportation dynamics and movement patterns in a city. For example, Mobile Millennium (7) is a recent project that demonstrated the benefit of GPS-enabled smartphones in real time traffic monitoring that is currently implemented in San Francisco and the Bay Area. WikiCity is another project that captures, in real-time, city dynamics and movement patterns of the people (8), which is currently implemented in major cities (e.g., Rome,
Abdulazim, Abdelgawad, Habib and Abdulhai
4
Copenhagen and Amsterdam) to visualize real-time people and transportation movements and areas of intense crowding (e.g. massive gathering events). Foursquare and other social network data sources has been used recently in many interesting applications. For instance, a recent study (9) used Foursquare data to estimate Origin-Destination (OD) matrix near Austin, Texas with promising results. Data from Foursquare and Twitter provides overall spatial distribution of activities in urban cities that form a good seed to build models to simulate activity-travel patterns in urban cities. Unfortunately the literature body that is related to this work is still limited, but in recent years there is an increasing interest to utilize the power of crowdsourcing and BigData in solving transportation problems. This work, therefore, is geared to contribute to this area by introducing a method to acquire, process and store such data as well as proposing algorithms that can utilize such data to infer activity-travel.
ACQUIRING LAND USE FROM LOCATION-BASED SOCIAL NETWORKS This section describes a general method to acquire location-based land use data for any study area where the survey is conducted, from social networks including Foursquare. Similar to other methods reviewed in the literature section, activity inferring algorithms that are described in the next section requires land use data as an input. Therefore, we developed a systematic method to acquire land use data for a study area which can be applied to Foursquare and similar services. These services generally expect location coordinates (e.g. latitude and longitude) and a query range (e.g. a circle diameter or a bounding box). For example, it is possible to retrieve available venues or points of interest within 500 meters of a center latitude and longitude point by querying services such as Foursquare, YellowPages or Yelp (10). Unlike YellowPages - that mostly contain business listings, and Yelp - that focuses on business listings and particularly restaurants; Foursquare contains a rich land use data with a wide range of venues not only business listings. The focus of this paper is therefore geared to obtain land use data from Foursquare. The method described hereafter is generic and can be used with most of the location-based social network (LBSN) data providers.
Query Limitations To query most of the LBSN services, a registration process is needed in which an API or authentication key is issued to query the service. For the service to protect its server resources, there are two limitations that are generally imposed on applications that query the LBSN service. First, result size limitation which caps the maximum number of records returned by a single query. Second, rate limitation which restricts how frequently an application can query the service per time unit (e.g. a maximum 5000 requests per hour).Given these two limitations, obtaining land use data for a large urban area, e.g. Greater Toronto and Hamilton Area (GTHA), is not a trivial task. To give a concrete example, Foursquare rate limits - at the time of writing this paper - are 5000 requests per hour for venues and for every query, and a maximum of 50 venues can be returned. If we define a bounding box (a query box represented by the latitude and longitude of northeast and southwest corners) for the entire GTHA, the size limitation would result in at most 50 records, which does not represent all the venues within the query boundary box. On the other hand, if we create many small boundary boxes (e.g. a square of 100 meters length) that covers the entire GTHA and query Foursquare with every boundary box, we will be faced with the rate limitation that we would require hundreds of thousands or millions of queries
Abdulazim, Abdelgawad, Habib and Abdulhai
5
to retrieve venues across the entire study area. Given the 5000 query per hour limit it could take many days or weeks to obtain land use for such large study area. It is noteworthy, that within such large study area we recognize that many empty or unpopulated spaces (that have no venues at all) exist, and thus querying them with such a small boundary box is a wasted effort. Furthermore, it is clear that querying using a boundary box is better in this case than using a query circle (i.e. a center point and a diameter) to avoid overlaps that could retrieve the same venue multiple times or gaps between querying boundaries that could lead to venues not being retrieved at all.
Adaptive Grid Algorithm for Automatic and Effective Queries To address the query rate and result size limitations, we designed an algorithm to represent the size of the query boundary box to be adaptive i.e. it should be smaller for dense areas and large for unpopulated or low density areas. For example, in dense areas where many venues are expected, a small boundary box can be used (e.g. 100 meter square); while in unpopulated areas a much larger query box can be used (e.g. 2 kilometer square). We consider the size of the smallest boundary box to be sufficient to get a good representation of land use data given the maximum result size limitation. For example, in the case of Foursquare, setting the smallest query boundary box to a 100 meter square area is reasonable as it will provide a maximum of 50 venues according to the result size limitation. For this algorithm to work, a density estimation of the study area is required to identify areas where more venues are likely to exist and rural or unpopulated areas. Examples of sources for such density estimation include: -
Population density from census data. It is expected that in high dense areas more venues (e.g. shops and services) will exist to serve the population; and Parcel/building level address data (e.g. postal code), which we use in this paper, where the postal code usually represents a building. So the number of postal code points within an area can be a good density estimate for how many venues are expected in this area.
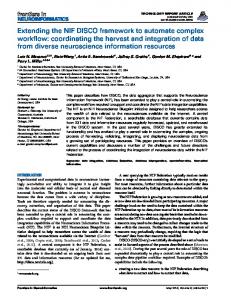
The algorithm proposed here generates an adaptive size grid that covers the study area, each cell of the grid (i.e. boundary box) can be used to query LBSN services and retrieve land use data within this cell. As an input, the algorithm uses a spatial database that contains the study area and density estimation (e.g. postal code points). The algorithm results in a grid with all the boundary boxes that covers the study area which is used directly to query LBSN services. There are few parameters that controls the algorithm including the min_cell_size, max_cell_size, and the maximum_density within a grid cell. Error! Reference source not found. shows the output grid of the algorithm, the postal code data that was used as density estimator and the result Foursquare venues that was queried with the generated gird. Postal code data used here were obtained from a commercial dataset (11), but it might be possible find useful data in OpenStreetMap free datasets (12)
To demonstrate the benefit of this adaptive algorithm, a complete non-adaptive grid with cells of a 100m length to cover the entire GTHA will have more than 885900 cells; that is translated to the same number of queries to the LBSN service. Given Foursquare hourly rate limitation of 5000, it will take more than a week to obtain land use data for the GTHA. With the adaptive algorithm a total of 85400 cells will
Abdulazim, Abdelgawad, Habib and Abdulhai
6
be generated that requires only 17 hours. Moreover, this can be enhanced even more by using the collected Foursquare data as density estimator to regenerate the grid again (for future acquisition of the land use data or to refresh the collected data) we were able to obtain a grid with only 10800 cells that requires only 2 hours to obtain land use data for the GTHA from Foursquare. The benefit not only in the query runtime, but also having a Shapefile or Spatial database with less records make it much faster to manipulate or process (e.g. clip the grid with the study area to only have a grid that just covers the study area of interest). Error! Reference source not found. demonstrates how the grid generation can be improved by feeding back the collected Foursquare data as density estimator for regenerating a new grid. Implementation and Technical Details The grid generation algorithm as described in Figure 3 starts by generating a regular grid that covers the entire study area using QGIS software (13), which is a powerful open-source GIS processing and visualizing tool. The length of each square cell in the grid is equal to the max_cell_size parameter. Because the generated grid has a regular rectangle shape, parts of the grid might be outside the range of the study area, therefore, the next step is to clip the generated grid with a polygon that represents the study area. It was not possible to use the standard clipping feature of QGIS because the cells at the border of the study area will be clipped in irregular shapes, and it is needed to maintain their square regular shape to be able to query the LBSN service (i.e. bounding box). To achieve this, PostGIS (14) which is a spatial extension to PostgresSQl database was used. The script to clip the generated grid was simply to delete all cells that does not spatially intersect with the study area polygon, hence cells at the border will remain complete squares. The algorithm starts by dividing the study area into coarse grid where each cell size equals to max_cell_size. Iteratively picks a cell and gets the density estimation for this cell (e.g. number of postal code points within this cell) and if it is greater than maximum_density, the algorithm divides this cell into four equal cells only if the cell size is greater than min_cell_size. The algorithm stops when there is no more cells are eligible to be divided. This implementation was written as python script that runs inside the PostgresSQL database. The next section discusses how the collected land use data can be used to infer activity-travel, followed by the case study section which presents preliminary results of applying the proposed framework on a real dataset.
INFERRING TRAVEL ACTIVITY Spatiotemporal Nature of Activity Data The ultimate goal of collecting travel activity data is to infer the joint spatiotemporal distribution of travel activities across the study area. Inferring activities given such distribution is possible by conditioning the joint spatiotemporal distribution on the location and time, then infer the most likely activity. Therefore, inferring travel activity without explicitly asking survey participants specific questions about location and time clearly requires another source of data. Unfortunately such data source is not commonly available as it requires conducting a large-scale activity-travel diary survey for an extended period; which as discussed earlier is not feasible using traditional survey methods due to the significant survey burden.
Abdulazim, Abdelgawad, Habib and Abdulhai
7
Alternatively, the approach we propose in this paper is to estimate the activity distribution from the land use as they are often correlated. The ultimate goal of the proposed framework is to address the survey burden barrier by collecting a long-term personal travel diary that can be used later as a better estimate for the spatiotemporal distribution of activities; hence, enhancing the inference algorithm, and reducing the dependency on external LBSN data sources such as Foursquare. Mapping between Location Classification and Activity Inferring activity from land use requires a mapping from land use classification to activity. Although this mapping seems intuitive, it is very difficult due to two reasons. First, land use data can have numerous classifications (e.g., shop, bank, residence, gym, college, restaurant and doctor’s), while activity types that we are interested to infer are typically limited to 5-10 activities (e.g., work, home, school, recreational and services). Second, the difficulty of such mapping varies to a large extent; for example, a building classified as college/university will most likely be mapped to a school trip but it could also be mapped to a work trip if the trip maker is a professor or is older than average students’ age. While these examples suggest that land use information only might not be sufficient to infer activities, and express a need for acquiring data such as socioeconomics (e.g. occupation and age), time, duration and frequency of the trip; it is our approach that strives to infer activities from land use information only. This challenge was realized due to the common issue of lacking a detailed activity-travel diary dataset with a sufficiently large sample size. The approach introduced relies on conducting an initial wave of data collection in a particular study area, then use the collected activity-travel diaries to improve the inference accuracy for consequent data collection waves. Thus, the proposed framework follows a continuous improvement approach in which collected data will be fed back to the framework to improve accuracy and data quality over time. We present an example to illustrate our approach of continuous improvement that uses the initial mapping to refine the inference accuracy over time. This is simply conducted by constantly observing what kind of activities a person typically do at a specific location. For example, if a particular location is classified as a post office, the initial mapping suggests that most likely a service trip will be made to this location. But this assumption might be incorrect if this particular post office location is a distribution center and does not serve customers, consequently majority of trips to this location should be classified as work trips. Applying the continuous improvement approach, with enough collected data, the mapping rule for this location will be modified from service activity to work activity. The aforementioned example refine the mapping for a particular location, but this can be generalized if a particular mapping rule was initially incorrect, e.g. mapping gym locations to a shopping activity, in this case the mapping rule for the gym classification will be updated in general not for a particular location. In the case of Foursquare a detailed three-level hierarchical classification tree exist for venues with more than 300 categories. The top level of the tree has nine categories as shown in Error! Reference source not found.. As discussed earlier, these classifications have to be mapped to activity types. The mapping process from venue classification to activity was performed by developing a set of rules based on reviewing all Foursquare categories, and finally map it to most likely activity. The full mapping list includes more than 150 mapping rules that is prohibited to be presented within the paper limit, however, we summarize the results of some top level categories, including all its children categories in Error! Reference source not found..
Abdulazim, Abdelgawad, Habib and Abdulhai
8
Inference Algorithms Land use data and mapping rules are the key inputs for the activity inference algorithm. The inference goal is to determine the activity given a trip destination location. In this paper we investigated three algorithms for activity inference all of which depend on developing a distribution of land use nearby the given trip destination, then find the most likely venue where the activity can take place. - Algorithm 1: The Simple Algorithm, uses a simple distribution mode within a given distance (a parameter) as the selection criterion for the most likely venue. To illustrate, given a destination location, the simple algorithm will get all Foursquare venues within a prespecified distance parameter (e.g. 200 meters) and group them by the high-level land use category (e.g. shop, school and residence), then select the most frequent category as the possible activity location. Using the mapping rules explained earlier, the algorithm directly convert the land use category to activity. For example, if there are ten venues with shop category and three venues with residence category, the algorithm will classify the activity as shopping activity. The issue with this algorithm is that it considers all venues to have the same weight and only counts matter, which can be problematic in some cases. For example, there might be a one university building and three restaurants, however most trips to this location are school trips. - Algorithm 2: The Check-in Algorithm, tries to address this issue by assigning a weight to each venue and select the most likely venue for the activity according to this weight. The weight we propose is based on the check-in and unique user counts which are reported by Foursquare. The check-in counts is simply how many people announced their arrival to this venue, and the user count is for unique users visited this venue. Following the same example, with this algorithm we might find that the university building has much more check-in and user count than the three restaurants, hence the algorithm will infer trips to this location to be school trips. Yet this algorithm addresses one limitation of the simple algorithm by assigning a weight based on user counts, it still has the same property - as the simple algorithm – which is considering a fixed distance to retrieve nearby venues but the number of retrieved venues is variable. However, it is still possible that within the specified distance, particularly for small distances; there might be no venues at all. A limitation that the third algorithm attempts to address. - Algorithm 3: The Nearest Neighbor Algorithm, which implements a K-nearest neighbor (KNN) approach in which the K-parameter is how many nearest venues should be used to determine the activity regardless of the distance. This approach can be particularly useful in the case where the location accuracy of destination trip is high which make it the nearest venue, or K-venues, is the most likely location where the activity occurred. Unlike the previous two algorithms, where number of venues within the specified distance parameter is variable, which can be very large number in dense areas - in the KNN approach this number is fixed (i.e. K parameter). The benefit of having a fixed K is that the inference algorithm runtime depends on the number of venues used to infer the activity, therefore with a fixed K the algorithm performance is more predictable and controllable. Rather suggesting which one is the superior algorithm, we believe that answering this question requires further investigation and testing with different datasets. However, we anticipate that there might be a situation where each algorithm can be superior, therefore we presented the properties of each algorithm to provide guidance that helps during practical implementation of the proposed inference framework.
Abdulazim, Abdelgawad, Habib and Abdulhai
9
CASE STUDY AND RESULTS Evaluating the performance of the activity inference algorithms requires a personal travel diary dataset in which trip purpose is explicitly collected from participants (i.e. ground truth activity). The ultimate dataset should have detailed activity classification e.g. have 7 or more activity type, sufficiently accurate trip destination location and a sufficiently large sample in terms of data collection period and number of participants. Such dataset was not available for the study area (GTHA), however we have used a dataset that was sufficient enough to provide a preliminary performance evaluation for our proposed activity inference framework. This dataset was collected during a program called Shuttle (15) that aims to influence drivers to reduce their carbon footprint by reducing driving distance and/or adapting a more ecofriendly driving behavior. The shuttle program had three phases: 1) collecting baseline driving behavior for 2-3 weeks; 2) provide eco training for drivers within a week; 3) collect driving behavior for another 2-3 weeks during which drivers are challenged to cut their driving distance or fuel consumption by 10%. The Shuttle dataset was collected in the fall of 2012, contains a total of 11,590 trips made by 60 drivers. An on-board diagnostic device (OBD) with a screen, GPS and GSM network was used for the data collection. The device was attached to the driver’s vehicle and was able to read engine sensors in real time and calculate trip fuel consumption. After every trip, drivers select one of activity types that were displayed on the OBD’s screen. GPS traces, trip purpose and all other data were transmitted over GSM network to Shuttle server. There were six activity types that driver select from: 1) Leisure/Family/Friends, 2) Work/Business, 3) School/Daycare, 4) Community Service, 5) Shopping/appointment/errand and 6) None. Instead of selecting the most likely activity given a set of nearby venues, i.e. using one of the three algorithms described earlier, it is possible to have an ordered list of top N most likely activities. Such ordered list provides flexibility to apply heuristic rules that might eliminate the most likely activity in the list and favor the next one. For example, if the trip destination is a school building but the trip maker age is over 30 the trip is more likely to be a work not a school trip. The possible activities ordered list will most likely have school trip at the top of the list followed by a work trip, but given the above heuristic the school trip will be eliminated and the work trip will be the most likely activity. Activity classification was done using machine learning classifiers. Multiple algorithms were tested including neural network, support vector machine (16) and random forest (17) out of which random forest had the best performance with about 67% accuracy. The features, or independent variables, that were used to train the classifier include the top three most likely activities that were obtained using the check-in algorithm described in the activity inference section. We could stop at this point and only classify activities using the land use information in which case we might not need to apply machine learning and one of the inference algorithms described earlier could be sufficient. However, we wanted to evaluate how the inference accuracy will change when adding more variables such as time and trip distance. Therefore, the output of the check-in inference algorithm is used along with other variables as input to machine learning classifier. As expected the inference accuracy increase significantly when adding more variable such as time and distance. What was unexpected, yet was revealed by the results, is that trip distance and time (just the hour of day) each has more predictive power than land use i.e. are better predictors for the trip purpose. Accuracy was estimated on independent testing set (33% of total data size), every row in Table 2 represents the result of a complete experiment, executed using Weka machine learning software (18), in which the classification was done using the one or more variable stated in the first column. The activity_1 variable means we only pick the top most likely activity (the output of the check-in inference algorithm)
Abdulazim, Abdelgawad, Habib and Abdulhai
10
while the variables activity_1_2_3 are the top three most likely activities. The first classifier, i.e. ZeroRule, which uses a very basic and naïve rule which is classifying all the data by the most frequent class (i.e. distribution mode). For example, in this particular dataset Shopping was the dominant class that represents 40.79% of the data which explains why the accuracy of this naïve rule is the same. The ZeroRule, is used as a baseline to test if other classifier are statistically more significant i.e. have better accuracy. The key point in Table 2 is that trip distance and time are promising predictors to infer activity and sometimes are more powerful than land use alone, i.e. in row 1, using the top activity alone (which is derived directly from land use) was not sufficient and statistically not better than the ZeroRule, while using distance alone as predictor is statistically better than the ZeroRule. There are many factors that affected the inference accuracy given the available dataset. First, the activity classification was not detailed enough and some different activities were grouped together such as “shopping/appointments/errand” is considered the same activity in the Shuttle dataset. There was no option in the data logger that used in Shuttle to select “Home“ as the trip purpose and participants were instructed to select the activity for “Home” trips based for on their last activity (i.e. where they are coming from). This lead to some trips will be classified as “Shopping” or “Work” while in fact they are “Home” trips. Despite these challenges in the dataset, the preliminary results are promising and suggests that it is possible to leverage the power of crowdsourcing data sources and use it to infer trip purpose automatically.
SUMMARY AND FUTURE WORK The focus of this paper is to introduce a framework for inferring activity-travel in order to reduce survey burden on participants. The first component of the framework is a practical method to acquire land use data from location-based social network (LBSN) services such as Foursquare, which contains much more dynamic information than traditional Points of Interests (POI) maps, also it is constantly being updated by millions of users. The adaptive grid generation algorithm presented here significantly reduces the time and resources required to obtain land use data for a large city area. The second component consists of three inference algorithms that utilizes the land use data. The entire framework was tested on a real dataset collected in the Greater Toronto and Hamilton Area (GTHA) with the highest inference accuracy obtain was 67% using Random Forest machine learning classifier. Accuracy is expected to improve significantly if we have a clean dataset with detailed activity diary of sufficiently large size in terms of number of days and participants. In the near future, our proposed framework will be used in another data collection project in the GTHA that we expect to have a better dataset that will be used to further enhance the framework.
Abdulazim, Abdelgawad, Habib and Abdulhai
11
References 1. Review of GPS Travel Survey and GPS Data-Processing Methods. Shena, Li and Stopher, Peter R. 2014, Transport Reviews: A Transnational Transdisciplinary Journal, pp. 316-334. 2. Foursquare. [Online] https://developer.foursquare.com/. 3. YellowAPI. [Online] http://www.yellowapi.com/?locale=en_CA. 4. Transportation Impacts of Information Provision & Data Collection via Smartphones. Vautin, David A. and Walker, Joan L. Washington, D.C : s.n., 2011. Transportation Research Board 90th Annual Meeting. 5. Elimination of the Travel Diary: An Experiment to Derive Trip Purpose From GPS Travel Data. Wolf, Jean, Guensler, R. and Bachman, W. Washington, D.C : s.n., 2001. Transportation Research Board 80th Annual Meeting. 6. Deducing Mode and Purpose from GPS Data – Case Studies. Stopher, Peter, FitzGerald, Camden and Zhang, Jun. 2008. Transportation Research Board 87th Annual Meeting. 7. Mobile Millennium. [Online] http://traffic.berkeley.edu. 8. Biderman, Assaf, et al. wikicity [*]. senseable.mit.edu. [Online] http://senseable.mit.edu/wikicity/. 9. Urban Travel Demand Analysis for Austin, Texas, Using Location-Based Social Networking Data. Jin, Peter J, et al. s.l. : Transportation Research Board Annual Meeting 2013, 2013. 10. Yelp Developers. [Online] http://www.yelp.com/developers. 11. Platinum Postal Suite: CanMap Multiple Enhanced Postal Code. v2011.3, Markham : DMTI Spatial Inc., 08 15, 2011. 12. Open Street Map. [Online] http://www.openstreetmap.org/. 13. [Online] http://qgis.org. 14. PostGIS. [Online] http://postgis.net/. 15. The Shuttle Challenge. [Online] http://www.shuttlechallenge.ca/. 16. Bishop, Christoper M. Pattern Recognition and Machine Learning. Pattern Recognition and Machine Learning. NJ, USA : Springer-Verlag New York, Inc, 2006. 17. Random forests. Breiman, L. s.l. : Kluwer Academic Publishers, 2001, Machine Learning, Vol. vol. 45, pp. 5–32. 18. The weka data mining software: An update. Hall, M., et al. 1, 2009, SIGKDD Explorations, Vol. 11.
Abdulazim, Abdelgawad, Habib and Abdulhai
Adaptive grid generated by the algorithm
Postal code points that was used as density estimation to adapt the generated grid size
Foursquare venues that was queried using the generated grid Figure 1 The output of the Adaptive Grid Generation algorithm and the queried Foursquare data given this grid
12
Abdulazim, Abdelgawad, Habib and Abdulhai
13
Initial grid generated from postal code (density estimator) with data points represent Foursquare venues
Improved grid generated from using Foursquare data (queried by the above initial grid) as density estimator which clearly showing much less cells with yet good coverage
Figure 2 Comparing the effect of using postal code and Foursquare data as density estimator to generate the grid
Abdulazim, Abdelgawad, Habib and Abdulhai
Figure 3 Adaptive Grid Generation Algorithm
14
Abdulazim, Abdelgawad, Habib and Abdulhai
15
Table 1: The high-level mapping between Foursquare classification and activity
FOURSQUARE CLASSIFICATION Arts & Entertainment College & University Food Great Outdoors Nightlife Spot Professional & Other Places Residence Shop & Service Travel & Transport
ACTIVITY Recreational/Social School Mostly shopping Mostly Recreational/Social Recreational/Social Varies Home or Social Varies Varies
Abdulazim, Abdelgawad, Habib and Abdulhai
16
Table 2 Comparing the classification accuracy with different subsets of variables i.e. predictors
Row 1 2 3 4 5 6 7
Variable activity_1 distance hour activity_1_2_3 activity_1_2_3_distance activity_1_2_3_hour all_variables
Classifier ZeroRule 40.97% 40.97% 40.97% 40.97% 40.97% 40.97% 40.97%
MLP-NN 40.81% 51.72% 48.31% 53.59% 55.80% 53.59% 58.60%
SVM 40.39% 51.36% 41.75% 45.04% 52.68% 45.04% 53.48%
RForest 40.11% 51.36% 51.48% 57.67% 61.71% 57.67% 67.65%