Oct 21, 2015 - The outcome of the experiments is in the form of measurements, ...... WBANs, authorization is required to allow users such as patients or ... impersonation (KCI), unknown key-share (UKS) and Denning-Sacco attacks [107,.
An Inference System Framework for Personal Sensor Devices in Mobile Health and Internet of Things Networks
by
James Jin Won Kang MEM, BE
Submitted in fulfilment of the requirements for the degree of Doctor of Philosophy
Deakin University January 2017
DEAKIN UNIVERSITY ACCESS TO THESIS - A
I am the author of the thesis entitled An Inference System Framework for Personal Sensor Devices in Mobile Health and Internet of Things Networks submitted for the degree of Doctor of Philosophy. This thesis may be made available for consultation, loan and limited copying in accordance with the Copyright Act 1968.
'I certify that I am the student named below and that the information provided in the form is correct' Full Name: James Jin Won Kang Signed: Date: 6 January 2017
DEAKIN UNIVERSITY CANDIDATE DECLARATION
I certify the following about the thesis entitled An Inference System Framework for Personal Sensor Devices in Mobile Health and Internet of Things Networks submitted for the degree of Doctor of Philosophy.
a. I am the creator of all or part of the whole work(s) (including content and layout) and that where reference is made to the work of others, due acknowledgment is given. b. The work(s) are not in any way a violation or infringement of any copyright, trademark, patent, or other rights whatsoever of any person. c. That if the work(s) have been commissioned, sponsored or supported by any organisation, I have fulfilled all of the obligations required by such contract or agreement. d. That any material in the thesis which has been accepted for a degree or diploma by any university or institution is identified in the text. e. All research integrity requirements have been complied with.
'I certify that I am the student named below and that the information provided in the form is correct'
Full Name: James Jin Won Kang Signed: Date: 6 January 2017
ACKNOWLEDGEMENT I would like to express my sincerest gratitude to Dr Henry Larkin and Dr Tom H Luan for their continuous support, patience and motivation during my PhD study and research. Their guidance is what made this thesis possible. Thank you to my family – my wife and children, who are always understanding and from whom I received encouragement and support throughout this study.
James Jin Won Kang 6 January 2017 Melbourne, Australia
LIST OF PUBLICATIONS The following shows the list of published works in book chapters, journal papers and conference proceedings over the course of the program. Book Chapters Kang, J. J., & Adibi, S. (2015). A Review of Security Protocols in mHealth Wireless Body Area Networks (WBAN). In W. Zhou, & R. Doss (Eds.), Future Network Systems and Security 2015 (FNSS 2015) Vol. 523 (pp. 61-83). Paris, France: Springer International Publishing. doi: http://dx.doi.org/10.1007/978-3-319-19210-9_5 Kang, J. J., Larkin, H., & Luan, H. (2016). Enhancement of sensor data transmission by inference and efficient data processing. In L. Batten, & G. Li (Eds.), Applications and techniques in information security (Vol. 651, pp. 81-92). Berlin, Germany: Springer. doi:10.1007/978-981-10-2741-3_7 Journal Papers Kang, J. J., & Larkin, H. (2016). Inference of Personal Sensors in the Internet of Things. International Journal of Information, Communication Technology and Applications, [S.l.], v. 2, n. 1, p. 1-23, jan. 2016. ISSN 2205-0930. doi: http://dx.doi.org/10.17972/ijicta20162125 Kang, J. J., Luan, T., & Larkin, H. (2016). Data Processing of Physiological Sensor Data and Alarm Determination Utilising Activity Recognition. International Journal of Information, Communication Technology and Applications. [S.l.], v. 2, n. 1, p. 108131, sep. 2016. ISSN 2205-0930. doi: http://dx.doi.org/10.17972/ijicta20162132 Conference Proceedings Kang, J. J., Adibi, S., Larkin, H., & Luan, T. (2016). Predictive data mining for Converged Internet of Things: A Mobile Health perspective. In Telecommunication Networks and Applications Conference (ITNAC), 2015 International (pp. 5-10). IEEE Xplore: IEEE. doi: http://dx.doi.org/10.1109/ATNAC.2015.7366781
Kang, J. J., Luan, T., & Larkin, H. (2016). Inference System of Body Sensors for Health and Internet of Things Networks. International Conference on Advances in Mobile Computing
&
Multimedia
(MoMM),
2016.
(pp.
92-96).
doi:
http://dx.doi.org/10.1145/3007120.3007145 Kang, J. J., Luan, T., & Larkin, H. (2016). Alarm Notification of Body Sensors Utilising Activity Recognition and Smart Device Application. International Conference on Advances in Mobile Computing & Multimedia (MoMM), 2016. (pp. 103-107). doi: http://dx.doi.org/10.1145/3007120.3007153
ABSTRACT Smartphone technology has become more popular and innovative over the last few years, and has led to the prevalence of wearable devices embedded with body sensors for fitness tracking and various smartphone features. Internet of Things (IoT), which can interact with wearables and personal sensor devices (PSDs), is emerging with technologies such as mobile health (mHealth), the cloud, big data and smart environments like smart homes. It may also provide enhanced services utilising health data obtained from physiological sensors. When these sensors are converged with IoT devices, the volume of transactions and traffic are expected to increase immensely due to the increased demand of health data from the IoT network. These additional demands will affect the existing mHealth services. Health service providers may also demand more data to enhance their services such as real-time monitoring and actuation of sensors alongside the existing monitoring of traffic. Both of these situations can cause rapid battery consumption and consume significant bandwidth. Some PSDs are implanted on or inside the body, and may require invasive surgical operations to replace batteries, such as for a heart pacemaker. It is therefore crucial to save and conserve power consumption in order to reduce the frequency of such procedures as well as health data transmission when needed. Due to the advancement of PSD hardware capacities, it is possible to have greater computational power which can allow the hosting of an inference system on sensor nodes. There has not yet been any research into managing and controlling data processing and transmission to reduce transactions by applying intelligence onto body sensors. This thesis provides a novel approach and solution to reduce data transactions in sensors and allow for the transfer of critical data without failure to medical practitioners over IoT traffic. This can be done via an inference system to transfer health data collected by body sensors efficiently and effectively to mHealth and IoT networks. The results from the experiments to reduce bandwidth and battery resources with heart rate sensors show a possible savings in resource usage of between 66% and 99.5%. Battery power can be saved by 3.14 Watts in the experiments if the transmission of a single 1KB data point is reduced, and by 7.47 Watts if the transmission of 628 data points totalling the size of 120KB is reduced. The accuracy of data inference between the originally sensed data and the data transmitted after inference can be maintained
7
by up to 99% or more. Such savings have the potential of making always-on mHealth devices a practical reality. This thesis contributes a low-overhead approach to mHealth sensors by inferring the processing and transferring of data as well as utilising an activity recognition application for enhanced health alarm notification.
8
TABLE OF CONTENTS Acknowledgement .................................................................................................... 4 List of Publications .................................................................................................. 5 ABSTRACT.............................................................................................................. 7 Table of Contents ..................................................................................................... 9 List of Figures ........................................................................................................ 11 List of Tables .......................................................................................................... 14 List of Algorithms .................................................................................................. 15 List of Equations .................................................................................................... 15 1 1.1 1.1.1 1.1.2 1.1.3 1.1.4 1.1.5 1.2 1.3 1.3.1 1.3.2 1.4 1.5 1.6 1.6.1 1.6.2 1.6.3 1.6.4 1.7
INTRODUCTION ................................................................................... 16 Definitions of Mobile Health Network Entities ........................................ 18 Wireless Sensor Network (WSN) ......................................................... 19 Wireless Body Area Network (WBAN) ............................................... 20 Patient Terminal (PT) ........................................................................... 20 Monitoring Centre (MC) ....................................................................... 21 Caregiver Terminal (CT) ...................................................................... 21 Research Motivation .................................................................................. 21 Research Problems .................................................................................... 26 Background of Research Proposal ........................................................ 26 Aim and Research Questions ................................................................ 27 Methodology.............................................................................................. 29 Research Objectives .................................................................................. 33 Research Contributions ............................................................................. 35 Sensor Data Processing ......................................................................... 35 Data Transmission ................................................................................ 36 Alarm Notification utilising Activity Recognition ............................... 36 Experimental Verification..................................................................... 37 Thesis Organisation ................................................................................... 37
2 2.1 2.2 2.3 2.4 2.5 2.6 2.7 2.7.1 2.7.2 2.7.3 2.7.4 2.7.5 2.8
LITERATURE REVIEW ....................................................................... 39 Introduction ............................................................................................... 39 Interfaces and Routing between Wireless Body Area Network and Internet of Things .................................................................................................... 42 Health inference and prediction analytics ................................................. 45 Device and data management .................................................................... 47 Security in Mobile Health ......................................................................... 48 Activity Recognition ................................................................................. 52 Security in Wireless Body Area Network ................................................. 55 Layered Approach of Threats and Attacks ........................................... 56 Security Services ................................................................................... 58 Security Mechanisms ............................................................................ 60 Security of Application and Communication Protocols ....................... 66 Conclusion ............................................................................................ 70 Chapter Summary ...................................................................................... 72
3
INFERENCE SYSTEMS OF DATA PROCESSING .......................... 73
9
3.1 3.1.1 3.1.2 3.1.3 3.1.4 3.2 3.3 3.3.1 3.3.2 3.3.3 3.4 3.4.1 3.4.2 3.4.3 3.5
Introduction ............................................................................................... 74 Blood Pressure (BP) .............................................................................. 75 Heart Pulse Rate (HR) .......................................................................... 76 Body Temperature (BT) ........................................................................ 76 Respiration Rate (RR) ........................................................................... 76 Problem Overview ..................................................................................... 76 Detailed Design ......................................................................................... 78 Data Collection and Creation ................................................................ 79 Optimisation and Situation Determination ........................................... 83 Alarm Determination ............................................................................ 88 Experiments and Evaluation ...................................................................... 92 Testing .................................................................................................. 92 Discussion ............................................................................................. 97 Conclusion .......................................................................................... 116 Chapter Summary .................................................................................... 117
4 4.1 4.2 4.3 4.4 4.4.1 4.4.2 4.4.3 4.5
INFERENCE SYSTEMS OF DATA TRANSMISSION ................... 118 Introduction ............................................................................................. 118 Problem Overview ................................................................................... 119 Detailed Design ....................................................................................... 120 Experiments and Evaluation .................................................................... 125 Testing ................................................................................................ 125 Discussion ........................................................................................... 130 Conclusion .......................................................................................... 138 Chapter Summary .................................................................................... 138
5 5.1 5.2 5.3 5.3.1 5.3.2 5.3.3 5.4 5.4.1 5.4.2 5.4.3 5.5
ENHANCEMENT OF ALARM NOTIFICATION USING ACTIVITY RECOGNITION APPLICATIONS................................ 140 Introduction ............................................................................................. 140 Problem Overview ................................................................................... 143 Detailed Design ....................................................................................... 144 Activity Determination ....................................................................... 145 Algorithm Creation ............................................................................. 147 Alarm notification utilising AR and smart device application ........... 151 Experiments and Evaluation .................................................................... 155 Testing ................................................................................................ 155 Discussion ........................................................................................... 159 Conclusion .......................................................................................... 164 Chapter Summary .................................................................................... 164
6 6.1 6.2 6.2.1 6.2.2 6.2.3 6.2.4 6.2.5
CONCLUSION AND FUTURE RESEARCH DIRECTIONS ......... 166 Conclusion ............................................................................................... 166 Future Research Directions ..................................................................... 168 Privacy and security ............................................................................ 168 Prediction of personal life expectancy ................................................ 172 Data integrity and accessibility ........................................................... 174 Data and network management ........................................................... 175 Data processing and mining in cloud .................................................. 175
REFERENCES .................................................................................................... 177
10
LIST OF FIGURES Figure 1.1 Interfaces of Health and IoT network from WBAN. Interface (b) and (d) are new while (a) and (c) are already existing. A PSD can be any device with sensor functions attached on or inside a body to collect health data ................. 18 Figure 1.2 Horizontal (end to end network) and vertical (layered) approach of mHealth Network Security Threats. Threat points can be on any node or layer 19 Figure 1.3 Data inference flow for an application. Monitoring Centre (MC) collects and creates meaningful information to feed back to sensors, which continuously adjust the thresholds and utilise the results for inference ............. 23 Figure 1.4 PSD interfaces to mHealth and IoT networks, which require health data to provide their own applications and services for the user and surrounding environments ....................................................................................................... 24 Figure 1.5 Test data creation for solution verification tests. Test data simulated for interfaces, and experimented by actual sensor data captured by sensor devices ............................................................................................................................. 33 Figure 1.6 Network domains and Example of Information flow ............................. 35 Figure 2.1 ISO/IEEE P11073 PHD (personal health device) protocols. Security is not included in the PHD suite whereas PHD is focused on data exchange between the agent (sensor/server) and manager (PT/client) .............................. 45 Figure 2.2 Bluetooth Packet Capture (No Compression or Encryption). Contents can be shown ....................................................................................................... 69 Figure 2.3 Bluetooth Packet Capture (Compressed and AES 256 Encrypted). Contents cannot be shown as it is encrypted and compressed ........................... 69 Figure 3.1 Information flow of Inference system consisting of data processing and data transmission ................................................................................................ 74 Figure 3.2 Inference of Data Processing ................................................................ 79 Figure 3.3 Data discrepancy between two sensors recording BPM across the same timeframe ............................................................................................................ 85 Figure 3.4 Result of Inference and optimisation for multiple sensors for heart rate monitoring with a few sensed out of the normal range of data........................... 86 Figure 3.5 Test Network Topology for sensed data capture, transfer and export. Cloud servers are in production network provided by Intel and Fitbit, which collects sensed data via the PT and provides export functions to the PC when requested for data processing ............................................................................. 93 Figure 3.6 Raspberry Pi3 ports configuration ........................................................ 93 Figure 3.7 Body Temperature Inference result for exercise mode (real data) on a minute basis. 5% VR inference vs Baseline (Original data) ............................... 95 Figure 3.8 Respiration Inference result for exercise mode (real data) ................... 96 Figure 3.9 Various Inference VR (variance rate) applied to process HR data result for exercise mode ................................................................................................ 97 Figure 3.10 Differences between the original and inferred value ........................... 99 Figure 3.11 Comparison of different VR for HR (BPM). Gaps between the original and each VR applied depicts the differences, e.g. more gaps during stable period (54 to 64 minutes data points)........................................................................... 101 Figure 3.12 Sleep monitoring with multiple sensors on a minute basis showing lost data sections, e.g. Sensor 1 lost (A) and Sensor 2 (B, C & D), which needs to be inferred .............................................................................................................. 104
11
Figure 3.13 Averaged sleep monitoring data on a minute basis after inference to fill the gaps from the data loss .......................................................................... 104 Figure 3.14 Inferred HR and BT of sleep monitoring data on a minute basis. Whilst BT represents the original well, HR results shows gaps. This can be improved by applying beacons............................................................................................... 105 Figure 3.15 Original data of Walk monitoring with long interval (minutes) sensing (2x HR, BT and GSR sensors) ........................................................................... 106 Figure 3.16 Averaged HR from two HR sensors to be ready for inference. BT and GSR results can be used along with HR for analysis of activity when required ........................................................................................................................... 106 Figure 3.17 Inferred Walk monitoring after having applied the inference. It shows that resultant data points were reduced by the inference ................................. 107 Figure 3.18 Duplication removed (original DP: 7592, inferred DP: 1308). It significantly reduces data points whilst still representing the original fairly well ........................................................................................................................... 109 Figure 3.19 Fine inference applied (baseline DP: 1308, inferred DP: 69). Results show a large saving in data points however, compromises by showing a rough graph due to using baseline 2 ........................................................................... 109 Figure 3.20 Fine inference and beacon applied (baseline DP: 1308, inferred DP: 107). Adding beacons corrects the roughness .................................................. 110 Figure 3.21 Beacons (long interval) without inference algorithm still represent the original without much distortion....................................................................... 110 Figure 3.22 Fine inference without beacon (original DP: 7592, inferred DP: 1308). Much improved when utilising the original baseline 1 ......................... 111 Figure 3.23 Coarse inference without beacon (original DP: 7592, inferred DP: 483). It shows distortion without beacons. Arrow shows data distortion when compared to Figure 3.22 ................................................................................... 111 Figure 3.24 Coarse inference with beacons (original DP: 7592, inferred DP: 513). It improves a lot by applying beacons in comparison to Figure 3.23 .............. 112 Figure 3.25 Short interval with beacons added (original HR DP: 1806, 70 beacons) ............................................................................................................ 113 Figure 3.26 Short interval with fine inference (original DP: 1806, inferred DP: 450) ................................................................................................................... 113 Figure 3.27 Short interval with fine inference and beacons (original DP: 1806, inferred DP: 498). Applying beacons improves the results significantly with a minimal addition of DPs ................................................................................... 114 Figure 3.28 Short interval with coarse inference (original DP: 1806, inferred DP: 140). Data are distorted a lot without beacons ................................................ 114 Figure 3.29 Short interval with coarse inference and beacons (original DP: 1806, inferred DP: 204). Adding 100 DPs of beacons improves the results with coarse inference reducing approximately 60% of data as compared to the fine inference ........................................................................................................................... 115 Figure 4.1 Inference of Data Transmission ........................................................... 118 Figure 4.2 Data transmission interval with inference applied. The green dots depict a regular sensing frequency .............................................................................. 122 Figure 4.3 Information flow between PT and sensors ........................................... 126 Figure 4.4 Interface protocols between PT and sensors ....................................... 127 Figure 4.5 Multiple sensors data and data inference result of HR sensors .......... 130 Figure 4.6 24 Hourly data inference ..................................................................... 130
12
Figure 4.7 2 Hourly data inference measured with activities in sequence to practice a real exercise situation followed by a resting period ...................................... 132 Figure 4.8 10% variance rate applied for HR as data inference on a minute-byminute captured samples, which shows rough results ...................................... 132 Figure 4.9 Data captured by ‘seconds interval’, which shows a vastly significant difference to those captured every minute. It captures lost data from a minuteby-minute sample previously shown in Figure 4.8 ........................................... 133 Figure 4.10 Inference of data transmission using inferred result of data reduction for 40 min HR data............................................................................................ 134 Figure 4.11 Effect of Variance Rate on Efficiency, Savings (data reduction) and Accuracy............................................................................................................ 135 Figure 4.12 Data transfer from sensors (Wireshark capturing) ........................... 136 Figure 4.13 Compressed data for transmission from sensor to PT (smartphone). When data are compressed and encrypted, they require more bandwidth as the size increases (Refer to Table 2.4) .................................................................... 136 Figure 5.1 Overall Network Architecture for AR and Health service provider networks ............................................................................................................ 141 Figure 5.2 AR demonstration using smartphone app and Matlab codes as shown in Appendix D. 3-axis accelerometer sensors in an Android phone are used as shown in different colours ................................................................................. 147 Figure 5.3 Physiological data variance for activities. BT, HR and RR gradually increase during exercises .................................................................................. 149 Figure 5.4 Multiple sensor data showing the gap between two devices................ 149 Figure 5.5 Smart device app screen menu selection flow...................................... 153 Figure 5.6 General Inquiry.................................................................................... 154 Figure 5.7 User Response. The heart rate of 127 BPM could be normal or abnormal depending on the activity of the user, e.g. resting or exercising ...... 155 Figure 5.8 Sensor Data Export Network Topology ............................................... 156 Figure 5.9 Averaged measurement values for activities ....................................... 157 Figure 5.10 Heart rate data sensed per second .................................................... 158 Figure 5.11 Respiration rate ................................................................................. 158 Figure 5.12 Body temperature ............................................................................... 159 Figure 5.13 Heart rate BPM results for each activity ........................................... 162 Figure 6.1 Health Status and personalised Life Expectancy ................................. 172
13
LIST OF TABLES Table 1.1 Examples of some biomedical applications ............................................. 24 Table 1.2 Wearable Watch specification with embedded sensors ........................... 25 Table 2.1 Summary of Reviewed Literature ............................................................ 40 Table 2.2 Security Service Categories within mHealth Networks. Privacy is a unique trait and always applies to any health related networks. Thus ‘privacy’ is the main security aspect in this thesis ................................................................. 60 Table 2.3 Summary of Suite B and E Algorithms, which are becoming popular to government and industry areas ........................................................................... 65 Table 2.4 Packet size comparison with and without encryption. Encryption more than doubles the data size ................................................................................... 70 Table 3.1 Proposed priority of requestor networks and devices. Priority and service classes are defined by network/service operators .................................. 80 Table 3.2 Frequency of Data requests for inference of requestors ......................... 81 Table 3.3 Battery levels for alarming and User priority, which determines alarm levels and service provision for requestors who may have different priorities in the registration table ........................................................................................... 81 Table 3.4 Multiple Sensors for Body Temperature Showing an Example of Discrepant Data Value Readings or Measurement, in Comparison to Other Values .................................................................................................................. 84 Table 3.5 Distance of Each Data Point from the Averaged (mean) Value .............. 85 Table 3.6 Situation determination to define the threshold of the activity from each type of data as recommended by a physician ...................................................... 87 Table 3.7 Example of Application Data. Data will result in an inferred value based on the threshold table. The weight is defined based on the attributes and multiplied with the inferred value to result in the points .................................... 88 Table 3.8 Alarm Threshold of Sensed Data suggested by a medical practitioner for a general purpose................................................................................................ 88 Table 3.9 Data savings for various VR for 24 hours samples ............................... 100 Table 3.10 Summary of Minute-by-minute Walk Monitoring ................................ 105 Table 3.11 Summary of Second-by-second Sleep Monitoring ............................... 108 Table 3.12 Summary of Walk Monitoring with Second ......................................... 112 Table 3.13 Results of data reduction process inference ........................................ 117 Table 4.1 Example of a Range Criteria for Body Temperature ............................ 121 Table 4.2 Frequency Rate ...................................................................................... 121 Table 4.3 Example of Interval Parameters to determine the interval value and frequency. .......................................................................................................... 123 Table 4.4 Percentage of Data Reduced and the Efficiency Rate for Sampled Data (Heart Rate) ...................................................................................................... 133 Table 4.5 Inference Rate for 24 hour HR data (seconds) to compare variance rates (VR) related to efficiency and accuracy as the VR significantly affects the result ........................................................................................................................... 133 Table 4.6 Data transmission bandwidth and power consumption comparison for data exchange to transmit sensed data from sensors ........................................ 137
14
Table 5.1 Example of Activity Inference. Physiological data are used along with AR to determine the activity with different weightings allocated for each sensor.. 146 Table 5.2 Resting heart rate for men [148] ........................................................... 154 Table 5.3 Measurement Condition ........................................................................ 156 Table 5.4 Averaged measurement value ................................................................ 157 Table 5.5 Test results of Basis HR BPM threshold ranges.................................... 161 Table 5.6 Average Fitbit HR BPM for activity ...................................................... 162 Table 5.7 Trained AR from user feedback for alarm verification requests ........... 163 Table 5.8 Adjusted average measurements ........................................................... 163
LIST OF ALGORITHMS Algorithm 1 Application threshold for each application attribute for alarming ..... 89 Algorithm 2 Battery power threshold for alarming levels ....................................... 90 Algorithm 3 Requestor priority based on registration table, which results in priority of users ................................................................................................... 91 Algorithm 4 Evaluation Algorithm of Data Processing Results ............................ 102 Algorithm 5 Activity and Alarm determination ..................................................... 150
LIST OF EQUATIONS Equation 1 Efficiency Rate ...................................................................................... 31 Equation 2 Savings Rate .......................................................................................... 31 Equation 3 Efficiency and Savings Rate Relationship ............................................. 31 Equation 4 Accuracy Rate ....................................................................................... 32 Equation 5 Frequency Rate A .................................................................................. 81 Equation 6 High end gap areas ............................................................................... 98 Equation 7 Low end gap areas ................................................................................ 98 Equation 8 Area of difference between original and inferred data ......................... 98 Equation 9 Frequency Rate T ................................................................................ 120 Equation 10 Interval time calculation ................................................................... 122 Equation 11 Standard deviation ............................................................................ 124 Equation 12 Heart Rate Karvonen Formula [147] ............................................... 147 Equation 13 Health status ..................................................................................... 173
15
1
INTRODUCTION
The rapid popularity of smart devices such as wearables have led to an increasing demand for health related services and applications along with emerging technologies such as the Internet of Things (IoT), big data and the cloud. For example, sensors can monitor the cardiovascular system using electrodes on the chest for capturing electrocardiography (ECG), whilst Peizo sensors on the wrist can measure blood pressure as well as optical sensors on the toe and earlobe to measure pulse rate. Implantable medical devices such as pacemakers, cardiac defibrillators, glucose sensors, drug delivery systems and neuro stimulators can have smart functions to communicate wirelessly with external devices [1]. In addition, fitness tracking devices and smart watches are being popular for the use in health status monitoring and services, which can connect and provide IoT applications. As a result, industries such as the healthcare industry are embracing mobile technology to support and integrate with these technologies to provide secured and efficient services demanded by other networks. This has resulted in new applications such as mobile health (mHealth) converged with IoT. Furthermore, health service network operations will want to manage their customers’ devices to provide better managed services as well as physicians, who will want to access their patients’ device for real-time monitoring or actuation when needed. All these demands will cause additional transactions and workloads on wireless personal area networks (WBAN) consisting of personal sensor device (PSD) and smart devices such as smartphones, which will consequently affect the performance and battery power of PSDs such as physiological sensors, biomedical sensors, monitoring devices (e.g. heart rate, body temperature, respiratory and glucose monitoring etc.) and wearables. Current PSDs neither profoundly interact with IoT networks nor intelligently provide data to health networks. Instead, they are passive and simply provide sensed data on a regular basis or on demand due to typical sensors having hardware and size limitations. However, this is now being changed due to the introduction of smartphones interacting with wearables, allowing sensors access to more powerful resources and a greater capacity to provide health information demanded by wellbeing requests. As this is a new area of demand, i.e. sensors interacting with IoT devices which will use health data, there have not been many
16
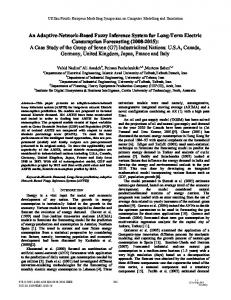
works done on how to efficiently transfer sensor data to external networks. It is to be expected and envisaged that traffic and transactions of data requests to PSDs will be enormously increased by IoT networks, as Gartner forecasted that 20.8 billion ‘things’ will be connected by 2020 [2]. This thesis proposes an inference system in sensors to determine and ensure whether it can manage data between PSD networks (e.g. WBAN) and external networks (e.g. IoT or healthcare), such that critical information is always transmitted. This includes designing, implementing and verifying intelligent functions on sensors to provide inferred decision making on what and how to transfer data to requestors 1 . For example, sensors can treat transactions differently from physicians or a smart lightbulb with prioritised transfer with quality of service (QoS) by using algorithms which use processed information analysed by big data in a cloud monitoring centre. As the contribution, sensors will process and transmit sensed data intelligently and be able to provide an optimised data transfer mechanism controlling workload and traffic. Sensors should also provide real-time tracking of mHealth user’s health status and future predictions of their wellbeing such as alarming of health conditions to caregivers before a dangerous health situation occurs. This is possible when a PSD is intelligent enough to send a warning message to the patient’s doctor or caregiver by checking and inferring from the pre-defined threshold database, and prioritising this task to other IoT traffic. Furthermore, these sensor data can be utilised along with activity recognition (AR) data which currently uses accelerometer devices in order to enhance the accuracy of situation determination for alarming. Figure 1.1 shows both existing and new interfaces between mHealth and IoT networks.
1
Requestors are those who request health data of sensors such as caregivers in mHealth and IoT devices.
17
IoT
eHealth interface (Internet)
Health network
New IoT interfaces (e.g. RFID, M2M)
mHealth interface (cellular/WLAN/3G/4G/5G)
PSD (personal sensor device, e.g. sensors, monitoring devices)
WBAN Figure 1.1 Interfaces of Health and IoT network from WBAN. Interface (b) and (d) are new while (a) and (c) are already existing. A PSD can be any device with sensor functions attached on or inside a body to collect health data
Health services will be one of the most beneficial areas to emerge from IoT technologies, together with the cloud and big data. However, it has its own unique traits and requirements against other IoT services and traffic in terms of security, priority and urgency in transferring data and content processing. For example, transmitting signals and data related to changing the temperature in a house or turning on a heater switch cannot be treated with the same priority as transmitting information of vital physiological signs of the home owner to their physician or caregiver for urgent attention.
1.1
DEFINITIONS OF MOBILE HEALTH NETWORK ENTITIES
This section describes each network entity and defines their functionality in mHealth as they play key functional roles in the proposed solution. There are various network elements to be discussed for the system model within WBAN and across the public networks such as Internet and cellular networks. As mHealth is dealing with personal information and health data, it is essential to consider privacy aspects in this thesis. Therefore, the general system model as shown in Figure 1.2 is approached from the perspective of security. Security is considered as top priority in monitoring centre (MC) networks for health data processing and medical monitoring systems. WBANs, which are used for mHealth applications, also require proper security mechanisms in order to protect the individual’s data and WBAN devices from malicious attackers. While attacks on
18
devices on the human body are a possible risk, there are also large-scale risks such as attacks on MC networks or caregiver terminal (CT) databases, which have the potential capabilities to cause major damage to a large number of people. Security attacks can be approached from a Network (horizontal) and Protocol (vertical) perspective. The vertical approach looks at the threats and protocols from the open systems interconnection (OSI) 7 layers whereas the horizontal approach looks at the mHealth network consisting of five sub networks including Wireless Sensor Networks (WSN), WBANs, PTs, MCs and CTs. Data traffic flows from the sensor devices in the WSN to the CT across the WBAN/PT and the MC. These areas are explained in the next subsections and are also summarised in Figure 1.2. WBAN (BT-LE, ZigBee, ANT+, NFS)
Wireless/Cellular network (3G, 4G, WLAN/wifi)
Threat point
Monitoring centre [MC]
WSN 1
Sensor aggregation node Patient terminal [PT]
Caregiver terminal [CT]
Health network
Horizontal
WSN 2
Sensor
ad Re
Re ad
/W rite
Threats
Vertical
OSI layers Application (e.g. https/ IEEE 11073 PHD) Transport (e.g. AES 256 Encryption) Network (e.g. IPsec) Datalink (MAC) Physical (Chipset)
Figure 1.2 Horizontal (end to end network) and vertical (layered) approach of mHealth Network Security Threats. Threat points can be on any node or layer
1.1.1
Wireless Sensor Network (WSN)
A WSN is normally consisted of sensors, monitoring devices and a sensor aggregation node [3]. Monitoring devices include sensors that are implanted inside or
attached
on
the
body
such
as
neuro-stimulators,
insulin
pumps,
electrocardiography (ECG), electroencephalography (EEG) and electromyography (EMG) sensors, cochlear implants, gastric stimulators, neuro stimulators, drug delivery system and cardiac defibrillators [1, 4]. Sensor aggregation node is a cluster of various sensors which connects with a PT to send and receive messages through a point to point, point to multipoint or various routing protocols. Due to the limited resources of the sensor nodes such as less computing power and low source of battery
19
power, typical security mechanisms cannot be used in WSNs. For this reason, the security mechanism of WSNs should be designed with consideration for the constraints of the resources available. Smartphone apps are becoming popular in the health sector and Apple iOS and Android devices occupy 94% of mobile devices used in the healthcare industry [5]. Some intelligent sensors are now being introduced in the market included in wearable devices such as Apple Watch and Samsung Gear S2. Wrist devices allow checking of blood pressure, blood oxygen saturation, body temperature and heart rhythm to be checked. Some Samsung Galaxy smartphones allow for heart rate tracking by simply scanning the finger. Some smartphones and associated devices include embedded sensors such as accelerometers, magnetometers and gyroscopes and devices with these features are estimated to reach a total of 515 million units by 2017 [6]. For example, a tiny electrode sensor can be inserted under the skin to measure tissue fluid glucose levels and can be transmitted via a wireless radio frequency to a monitoring device. The communication can be done by Bluetooth Low Energy (BT-LE) [7]. 1.1.2
Wireless Body Area Network (WBAN)
IEEE 802.15.6 specifies communication standards for low power wireless sensor devices worn on or implanted inside the human body that will communicate with health information collection devices [3]. A WBAN consists of the WSN and PTs (e.g. smartphones) with signalling protocol stacks and application. It accommodates approved frequency bands of national medical authorities as well as industrial scientific medical bands with data rates of up to 10 Mbps that can support quality of service (QoS) [8]. The security of WBANs is discussed in detail in the security mechanisms section. 1.1.3
Patient Terminal (PT)
The PT is equipped with mHealth application and database collection and storage functions. It has the ability for mobile communication as well as monitoring devices such as oximeters heart pulse monitors and blood pressure monitors which collect information from sensors. As some PTs such as smartphones allow for greater computing power and capacity of applications, it is possible to implement stronger and more resilient security mechanisms in PTs. Sensors are more focused on simplified functions which result in less security functions being implemented in
20
WSNs. In this thesis, PT mainly refers to processing units such as smartphones rather than PSDs (sensors and monitoring devices) which have less computational capacity. 1.1.4
Monitoring Centre (MC)
The MC including health data processing function and storage centre can be located on a cloud network. A physician can access it to obtain the patient’s data. Typical security network designs such as hardware and software firewalls, DMZ (Demilitarised Zone: subnet for external network facing) and checkpoints for MCs can be implemented. In order to secure the collected and processed data in the server, it requires additional security measures such as separating the patients’ personal information and health data (isolation), hardening, network separation, air-gapping and physical security which restricts access to the server and limits it to trusted staff [9]. 1.1.5
Caregiver Terminal (CT)
The CT has the database of a physician and can connect to the MC to obtain the patient’s data. The physician’s system decides on how to store the patient’s data. One possible security option is to switch the caregiver network offline during periods of no data transaction between the MC and the CT. Another option is to switch it to be selectively online, such as only being online during business hours, and turned offline after hours. A general rule of online and Internet security may be applied to workers in the physician’s office environment such as the mandatory installation of firewall software on every computer with regular updates. Education and training of staff would also be an effective defence against attacks at the caregiver’s network. Health information should be separated from the CT network after it has been used to avoid threats.
1.2
RESEARCH MOTIVATION
Mobile health (mHealth) is a branch of the electronic health (eHealth) area of which it has evolved from as well as wireless sensor networks (WSN) and the IoT [10]. Little research has been conducted between mHealth and IoT due to the limitations and constraints of PSD hardware resources such as battery power and computational capacity as they are equipped on or implanted on the body [11]. In recent times, the innovation of wearable devices has changed the direction of the industry and the
21
wearables market. Apple launched the Apple Watch in mid-2015 and other major players such as Samsung, LG, Motorola, Fitbit, Intel and Google also developed or made plans to develop similar products. These mobile devices are powerful and well integrated with smartphones and smart devices, which make it easy to communicate with IoT for its smart functions and powerful resources (i.e. CPU, memory, interfaces, battery and apps). It is obvious that sensors and monitoring devices will be equipped with more capacity to solve the problems of additional traffic that burdens PSDs. Infectious diseases such as the Middle East Respiratory Syndrome (MERS) and the Zika virus affect human health and quality of life in many countries. The World Health Organization (WHO) reports that the global case count for MERS was 1,651 laboratory-confirmed cases as of 10 March 2016, including 590 deaths with a fatality rate of 36% since the first cases were reported in September 2012 [12]. In the Republic of Korea, the MERS outbreak resulted in 186 infected people, including 38 deaths. This emerging epidemic nearly paralysed the country resulting in 2208 school closures, 16000 people quarantined for health monitoring and over 100,000 scheduled tourists cancelling their trip from nearby countries. Preliminary expert forecasts reported a GDP decline of at least 0.2-0.3% in June 2015. It took 6 weeks to control the disease, which was initially brought to the country by a 68 year old man who travelled from the Middle East. Vigilant monitoring will be crucial to end the MERS outbreak [13]. This case could have been better managed with mHealth monitoring system converged with IoT as the disease has symptoms of fever and coughs that may be monitored by sensors during quarantine. Infected patients visited several hospitals for medical shopping and visited other places during the selfquarantine period at home. The government had no information of their movements other than to call them on a daily basis to manually ask about their symptoms and location.
Pandemics are regarded as a national security that may cause more
casualties, especially during a time when globalisation allows for disease to spread widely and more rapidly than in the past. Thirty four percent of all deaths worldwide are now attributable to infectious disease, while war only accounts for 0.64 percent of deaths [14]. When a case requires the monitoring of a large volume of people and geographic area such as a small town, a city, a country or across borders, it may cause network congestions from a continuous stream of data. Thus it will be crucial to minimise the size of data from personal sensor devices when transmitting to the
22
monitoring centre (MC). It is vital to consider how best to handle the prioritisation of traffic between sensors and IoT devices and between sensors and the MC. As the merging of IoT traffic with existing mHealth traffic will create additional transactions, it is also required to manage and control PSDs of which functions such as registration, device status, traffic measurements, software updates and battery checks are essential. This requirement will be an additional burden to PSDs which generally have limited resources to be carried by a human body. It is proposed to implement intelligent functions on PSDs and smart devices to provide inferred decision making on what and how to transfer data to requestors. These tasks need to consider and reflect QoS and security requirements into the inference system to adopt smart algorithms when making a decision, along with taking into account information processed and analysed by big data in the cloud monitoring centre. Figure 1.3 illustrates an example of the data flow of inference and its application e.g. prediction of health status. Health data received from the sensor are processed and resent to the same sensor based on the knowledge base built and maintained by the sensor for future decision making. Another example is that the sensor uses the information of past requests received and stored from an IoT device so that it can decide the priority of what information to transfer and how often. Generic Big data Personal data inferred
data Sensor node
X
+
Z
Health status/Life expectancy Present and predicted
Smartphone
MC
Figure 1.3 Data inference flow for an application. Monitoring Centre (MC) collects and creates meaningful information to feed back to sensors, which continuously adjust the thresholds and utilise the results for inference
Figure 1.4 as well as Figure 1.2 show interfaces to the Health network including caregiver terminal (CT) and monitoring centre (MC) and possible IoT networks. The WBAN includes PSDs (sensors and monitoring devices) and the patient terminal (PT) such as smartphones. As shown in the figure, there can be many IoT devices and networks which may demand and request health data. Some places are new environments with first time connections whilst other environments are frequently visited places such as the home or office. The inference system analyses the situation
23
by considering factors of time, geographical location and the environment to react to the requests.
Health network
MC Doctor (CT) Smart home mHealth interface (cellular/WLAN/3G/4G/5G)
New IoT interfaces (e.g. RFID, M2M)
WBAN
PT Shopping centre
Smart city
PSD (sensors, monitoring devices)
Smart car
Office
transport
Figure 1.4 PSD interfaces to mHealth and IoT networks, which require health data to provide their own applications and services for the user and surrounding environments
While a single sensor device can collect data for its own purpose, e.g. body temperature sensor attached on a body or smart clothing, there can be multiple sensors equipped in a monitoring device which can provide biomedical applications. There are monitoring devices for medical applications consisting of multiple sensors equipped on or implanted inside a body, and some of these sensors are included in smart wearable devices. This makes the role of wearables popular in the area of medicine as well as physiological health activity. Table 1.1 shows some biomedical applications which are typically used in the health area and equipped in PSDs. Physiological sensors are now being popular and most wearables are sold for this purpose rather than for medical reasons. Table 1.1 Examples of some biomedical applications
Biomedical Applications [3, 15] Blood Pressure
Electrocardiography (ECG)
Heart Pulse Rate
Electromyography (EMG)
Respiration
Electroencephalogram (EEG)
Glucose Monitoring
Motion Detection
Thermometer
Cochlear Implant
Blood Oxygen – Pulse Oximeter (SpO2)
Artificial Retina
Weight-Scaling
Sleep Monitor
24
Table 1.2 below shows the system capacity and specifications of popular smart watches released in 2015 and 2016, including details of embedded sensors to capture physiological data. Table 1.2 Wearable Watch specification with embedded sensors
[16-20] Apple Watch Series
Samsung Gear S3
2nd Edition
9/2015
3/2016
(Announced) Processor Apple S2Dual-core
Dual-core 1GHz
Quad-core
Quad-core 1.2GHz
chip
Samsung Exynos
1.2GHz Cortex
Cortex A7
A7 Qualcomm
Qualcomm
Snapdragon 400
Snapdragon 400
Classic August 2016
nd
LG Watch Urbane
360 (2 Gen)
2 Released September 2016
Motorola Moto
(Announced)
Memory undisclosed
768MB
512MB
768MB
Battery undisclosed
380mAh
300mAh
570mAh
Storage undisclosed
4GB
4GB
4GB
Sensors Accelerometer,
Accelerometer,
Gyroscope,
Gyroscope,
Gyroscope, Heart
Gyroscope, Heart
Accelerometer,
Accelerometer,
Rate, Barometer,
Rate, Barometer,
Heart Rate,
Compass, Heart
Ambient light,
Compass
Compass,
Rate, Barometer,
Pedometer,
Proximity
Compass
Gyroscope Comms Wi-Fi 802.11b/g/n
Wi-Fi 802.11b/g/n
Wi-Fi 802.11b/g/n
Wi-Fi 802.11b/g/n
2.4GHz,
Bluetooth 4.1,
Bluetooth 4.0, LE
Bluetooth 4.1, LE
Bluetooth 4.0,
GPS, NFC
GPS, NFC
Therefore the industry is now ready to leap up to converge with PSDs which can be equipped with more hardware improved features and play a key role with its intelligence and powerful capacity. Better and improved health services can be provided by connecting to IoT which will demand human health data to provide personalised and optimised services to health users. The application of this solution will expand to almost all areas such as the home, office, factory, city, public transportation and vehicular informatics. In other words, they can benefit every environment where people can connect their PSDs with the IoT, which will process and utilise health data to convert into and create valuable information used to contribute to a better quality of human life.
25
The major outcomes and benefits of this research which may contribute to health service providers and network operators for their applications and future benefits are as below: • Real-time and predictive health status of mHealth users based on data analysis and processing in the cloud • Efficient health data transfer to IoT networks based on inference system with secure interfaces, e.g. controlled data transfer and congestion control • A solution for a centralised management system for the management and control of mHealth devices for registration, traffic measurement and device status monitoring
1.3
RESEARCH PROBLEMS
The background, aim and research questions of this study are summarised below. 1.3.1
Background of Research Proposal
There are major problems envisaged in the mHealth domain with the convergence of mHealth with IoT technology and networks [21, 22]. • Sensors are currently passive and programmed to transfer data on a scheduled basis without discerning the situation of priority or the importance of the data. This may cause battery power issues which is a constraint for functionality, actuation and urgent monitoring function. • Currently, sensors are not managed by a network operation, and work in isolation for tasks such as device registration and status monitoring [23]. This includes an alarm for low battery levels and malfunctions, security attacks and statistics. When this function has been implemented, it will cause additional transactions and increase the burden to PSDs. • Personal sensor data volume will increase significantly for sensors to provide health information to IoT networks (e.g. additional data demanded from IoT devices) [24, 25].
26
• There is no functionality or intelligence on PSDs to manage and control the external demand, which will overload the device capacity and eventually malfunction with risks of being a target of attack. 1.3.2
Aim and Research Questions
The primary aim of this research is to determine if an inference system applied to PSDs is capable of transmitting data more intelligently than from current passive systems. The overarching research question is to determine whether a resource constrained sensor in a wireless personal area network can provide data to external networks consistently and reliably regardless of traffic load. More specifically, the research questions for this study were: 1. Is it possible to reduce bandwidth requirements of mHealth sensors while maintaining communication of critical events? (This is answered in Chapter 3) 2. Is it possible to ensure the inference system can manage data transfer to a monitoring centre so that critical information is always transmitted? (This is answered in Chapters 4 and 5) 3. Is it possible to manage duplicated transaction and/or inconsistent data with multiple sensors triggered by the same IoT device? (This is answered in Chapter 3) 1.3.2.1
Research Question 1: Is it possible to reduce bandwidth requirements of mHealth sensors while maintaining communication of critical events?
Handling personal sensor data is different from other data due to the traits and constraints of sensor devices and the nature of the data context. Personal sensor data are mostly small in size, such as text and numbers for temperature, heart rate, blood pressure and respiratory values and these have an intrinsically limited range. For example, the human body temperature must realistically remain within the range of 35 to 45 degrees Celsius. When PSDs connect and integrate with smart devices such as a smartphone, they can share significant computational work with its counterpart. For example, the Apple iPod relies most of its management functions on a PC through the iTunes software, whilst the iPod itself provides a basic interface and media playback application to the user. By transferring data from sensors to smartphones,
27
PSDs are able to access the greater computational capacity of PTs. By inferring in sensors which can reduce the transactions, the interval of data transfer can also be adjusted to a longer interval than scheduled when the data have continuously been within the normal threshold value range. Reducing the transfer frequency can save battery power of PSDs. For example, when a PSD is off, the radio consumes less than one micro amp of power. When receiving data, it consumes 10 milliamps (x10000 to sleep). When transmitting, it consumes 25 milliamps [26, 27]. Since typical sensors have been regarded as a resource constraint, they typically do not have additional computational resources added. However, recent wearable devices have demonstrated that they are capable of having computational capacity to implement intelligent functions to improve the data processing prior to transmission to PTs. One primary aim of this thesis is to investigate and answer the research question: can bandwidth requirements of mHealth sensors be reduced while maintaining the communication of critical events? 1.3.2.2
Research Question 2: Is it possible to ensure that the inference system can manage data transfer to a monitoring centre so that critical information is always transmitted?
If a PSD loses connection to its PT e.g. if a smartphone is left at home or is out of range of cellular network coverage, it could be a serious problem if a life threatening situation arises as critical information is not able to be transferred. With PSDs implemented with machine-to-machine (M2M) interface through WBANs (which enables devices in networks to exchange data and take actions without human assistance [28] and the use of IPv6 modified for IoT), each sensor device can connect directly to any IoT device until it changes over to the mHealth WBAN for a more stabilised connection. In this case, the inference system may have increased reliability if it is able to transmit critical information to more than just the MC. The inference system uses the device’s communication protocol layer implemented by WBANs as well as applications to provide a high availability of critical health data to the MC. To support this, PSDs would need to adapt M2M communication when the current mHealth is not providing M2M availability. Thus, the roles of WBAN devices may benefit by being able to communicate with other mHealth sensors. Whilst the communication capability is provided by network operators interfacing mHealth and IoT through WBANs and/or M2M, this research
28
focuses on application functionality to prioritise requestors and responses. The aim is to investigate how to differentiate and implement priority of transactions between mHealth and IoT requests for the transfer of critical information with QoS. 1.3.2.3
Research Question 3: Is it possible to manage duplicated transaction and/or inconsistent data with multiple sensors triggered by the same IoT device?
Since there can be multiple sensors and monitoring devices on the user, it is a possibility that various sensors may capture and transfer the same type of information to the same IoT device. For example, a smart watch may capture the temperature on the wrist (e.g. 36 Celsius degree) whilst a sensor on a smart clothing may capture the same information on the chest (e.g. 39 Celsius degree). Therefore, it is important to consider that the IoT device, which the sensors are transmitting to, may not be able to discern that the two sensors are sensing from two different locations of the body. This can be critical in an emergency situation where a mHealth system needs to collect and differentiate between important vital signs in a life-threatening case. The aim of this question is to provide a solution for optimised data supplied by sensors so that the inference system can infer different situations.
1.4
METHODOLOGY
The outcome of the experiments is in the form of measurements, such as efficiency and accuracy comparing the original data with the processed data from the inference system. Therefore the quantitative data analysis is used for testing and assessing the solution including various types of data, i.e. nominal, ordinal, interval and ratio [29]. Whilst there is no definite figure for validating the research questions from the results, experiments show how accurate and efficient the solution is against the original data volume in terms of bandwidth and battery power consumption. For example, sensors assess the data request to see whether they are from a caregiver terminal or an IoT device (nominal), the captured data to see whether they are in a normal or an abnormal range (ordinal) as well as the frequency of data transfer decided (interval). This is done prior to sending out the personal sensor data such as weight, body temperature or blood pressure (ratio) to the requestor. The solution is verified by experimental testing of the sensor data and analysing the results. The detailed testing environment, network topology, procedures and results
29
are discussed in testing sections to compare performance both with and without implementation of the inference system. The following describes a brief introduction to the test methodology used for this research. As opposed to other projects which may show a clear pass or fail, this thesis may not have a defined pass or fail criteria as the interpretation of the results are medically subjective. Therefore, this thesis will focus on showing the efficiency rate obtained from implementing an inference system. This is because for results to be considered satisfactory, it may depend upon the context of its application and may need to be determined after review by a medical practitioner or a scientist. For example, results show that data were reduced by 93.2% as shown in Table 3.11 after inference (original data points of 7592 reduced to 513). This result could be considered satisfactory in many situations but could also be considered unacceptable in others. How to test
Test environment and network topology, test data, test tools, end to end testing, integration and interoperability testing, entry/exit criteria
How to evaluate
Show amounts of battery power saved after the inference, efficiency rate, and descriptive result record for further analysis. Accuracy and efficiency are used to evaluate the results of inferences (Refer to Section 3.4.2.1)
How success
to
prove
Compare test results with and without the solution applied followed by a result review process. The outcome will be shown using an efficiency and accuracy rate to show how efficiently the solution works to reduce data transmission and bandwidth to save battery power.
To create and analyse test data and set out the criteria for verification, it is planned to adopt the concept of the experimental design method originally formed by Fisher [30], which may be suitable to this project for the variability of individual health data. The goals of experimental design as defined by Kirk [31] aim to establish a causal relationship between the independent and dependent variables being investigated, as well as attempting to obtain the maximum amount of data with the least expenditure
30
of resources. The experiments can be characterised by: (1) using control methodologies such as assigning test subjects randomly to independent variables; (2) observation of dependent variables; (3) the use of independent variables. This approach can be applied to this experiment as the health data are related with activities and react to the condition of the user and the observed results can be assessed with normality, efficiency and accuracy. For example, vitals are independent of each other, however, they have their own unique traits for each activity. Each individual will also have their own range of normal, abnormal and critical temperature values, and the result shall be determined to how closely it represents the original data when they have been transmitted after inference. Therefore, the following calculations are proposed to be used in analysing the results to assess the outcome of inference system with efficiency and accuracy along with bandwidth and battery power savings, which is the ultimate goal. Whilst efficiency is generally defined to show the ratio between the actual output and the effective or designed capacity (or input and output ratio of energy), the main concern is to know how much capacity can be saved against the volume of transferred data. Thus, a new equation is proposed as shown in Equation 1 below to define how efficiently the data are transmitted by defining the difference of sensed data and transferred data against the actual transferred data volume. Efficiency Rate (ER) =
No of Sensed data − No of Transferred data No of Transferred data Equation 1 Efficiency Rate
To calculate the ER, data savings are measured from the total volume of the original data points versus the total of screened (reduced) data points. This can also be used to calculate ER using the below formulas as shown in Equation 2 as there is a relationship between two equations as shown in Equation 3, which is obtained from the two equations. Savings Rate (SR) =
No of Sensed data − No of Transferred data x100 Number of Sensed data Equation 2 Savings Rate
Efficiency Rate (ER) =
1 SR
1 − 100
Equation 3 Efficiency and Savings Rate Relationship
31
Whilst ER or SR can show how much data are saved or reduced, it does not represent how accurately the data have been produced and transmitted. To determine how closely the transmitted data is compared to the original data, it is required to calculate the accuracy as shown in Equation 4 below. Accuracy Rate (Ar) =
Sum of original DPs − Sum of differences x100 Sum of original DPs Equation 4 Accuracy Rate
Testing procedures and steps will be as below: 1. After an inference system has been designed, an experiment is conducted. 2. A base system is used that has no inference system to use as a comparison. Data are exchanged by existing sensor networks with WBAN protocols, e.g. Wi-Fi, ZigBee or Bluetooth connecting to a smartphone. 3. Algorithms are developed to compare performance metrics such as frequency of data transfer, transfer rate, transfer error rate, data size etc. 4. As health and IoT networks are beyond the scope, test data are manually created to simulate these networks in addition to experiments and testing using sensor devices, testing devices (e.g. Raspberry Pi3), PCs and smartphones for testing environment. Figure 1.5 illustrates an overall concept of how to test and verify the solution including testing areas to be conducted.
32
IoT network
Health network
Future interface
Smart things
Monitoring centre
Smart home, office, factory etc
Caregiver terminal
Experiment & Evaluation Test data generation
r te e
fa c
Ex is
c fa
tin
g
in
te r
Te st
in
ta
w
da
da
e
ta
st Te
Ne
WBAN PSD/sensors Smartphone Inference algorithm
Test data processing & transmission
Solution Successfully Tested Figure 1.5 Test data creation for solution verification tests. Test data simulated for interfaces, and experimented by actual sensor data captured by sensor devices
As an initial approach to designing the inference system and verification of solution, Bayesian networks and fuzzy logic based literatures are broadly reviewed to see how they can contribute to developing an inference logic and algorithm. The method includes testing to generate data within a virtual mHealth system using simulation, e.g. a programmed device to be a sensor, and a smartphone with an app installed. This includes collecting data from sensors and transferring to a data processing centre via WBANs and IoT networks by simulation, or another device programmed to be a MC. Some mathematical equations are used to validate efficiency. Software programs such as Wireshark and Matlab are used to capture and export sensor data and for analysis. Informed consent from all human subjects are obtained prior to all experiments, and the experiments comply with ethical clearance codes such as the Australian ‘National Statement on Ethical Conduct in Human Research’ [32].
1.5
RESEARCH OBJECTIVES
The objectives of this thesis include:
33
1. Review of current sensor network topology, interface protocols, inference of sensor network, applications and network architecture 2. Review mHealth and WBAN security of methodologies to be optimised for privacy with inference system at PSDs 3. Development and experimentation of algorithms to infer, process and transfer sensed data context at PSDs and the creation of test data to simulate monitoring centre in the cloud as well as IoT devices 4. Analyse and compare results of proposed solutions, and discuss their significance The following are out of the scope of this research. 1. External networks of WBANs including mHealth, IoT and public networks domain such as cellular, mobile network and Internet which are well exposed and covered by previous works. Thus, test data are simulated for mHealth and IoT requestors. 2. Communication protocols and layers of sensors, which are already specified by industrial standard bodies. This thesis proposes a solution which can be included in applications. 3. Sensor devices’ hardware capacity and performance to handle inference system as it is subject to design, and services and features that are required to be implemented in sensor nodes. 4. Interface and integration between WBANs and eHealth & IoT which have already been well researched. 5. Methodology of sampling, e.g. accuracy (rate) improvements. There are already existing methodologies of how to improve the reading and sampling of sensed data. This project aims to demonstrate the feasibility of saving bandwidth and battery power by an inference system, and not necessarily the best method of sensing, processing and transferring with the best accuracy. 6. Whilst security aspects of WBAN are reviewed in the scope, actual implementation of security is excluded as it is part of the communication protocol layer such as Bluetooth. It is currently under review by IEEE P11073 PHD work group as an application layer security. Since protecting the privacy of health data
34
is crucial in the context of mHealth (particularly when it is sent to the IoT network), privacy is discussed in Chapter 6 for future works. 7. While medical values used in this thesis were arbitrarily derived from consultation with a medical professional, they are used for general discussion purposes only and specific medical values used are not being recommended. Figure 1.6 depicts an overall network domains including data flows between PSDs which are within the scope, and the MC in the cloud for mHealth including public networks which are out of the scope. PSD/WBAN domain
Public network domain
Cloud domain Test data to feed back to PSD
signalling, e.g. actuation, monitoring mHealth network e.g. cellular, WLAN, Internet
mHealth network operator
data (scheduled, response to the query) mHealth user
New interface
IoT network
Inference system at PSD
Figure 1.6 Network domains and Example of Information flow
1.6
RESEARCH CONTRIBUTIONS
The contributions of this thesis are listed in the following categories. 1.6.1
Sensor Data Processing
It is proposed to design and implement an inference system on the sensor nodes to reduce the number of transactions and transmission frequency, which affects the resource capacity. By applying inference methods, the data volume can be significantly reduced. This can be done via the: • Removal of duplicated and similar data • Optimisation of inferred data to improve the error rate by identifying and excluding faulty readings
35
• Analysis of situation for real-time actuation when required 1.6.2
Data Transmission
After the inference process has reduced the data volume, it can be further inferred to reduce the transmission by analysing the sensor device status and requestors with priority. Furthermore, controlling the frequency of transactions can save power consumption significantly. As the outcome, PSDs will be able to provide optimised data by controlling the workload and traffic. This also provides real-time tracking of body sensor user’s location and their health status as well as future predictions of their wellbeing such as alarming of dangerous health conditions to caregivers before a dangerous health situation occurs. This can be achieved when a sensor device is intelligent enough to send a warning message to the patient’s doctor or caregiver by checking the data and inferring that there is a situation to be alarmed about. 1.6.3
Alarm Notification utilising Activity Recognition
Sensed data can be used to help define the recognition of human activity and situation status in addition to existing accelerometer sensors to determine the alarm status. It is required to determine whether they need to raise an alarm or not by knowing the situation as a sensed data can be considered to be normal or abnormal depending on the activity of the user. The situation of when to send the warning is pre-defined in the threshold database of its memory, which is used as a standard to check the data collected from the sensors against. The following contributions are made: • A new idea of inferring sensor devices to learn and notify of an alarm situation by comparing data with pre-defined threshold measurements prescribed by clinicians for individuals. • A verification method by interacting with users through the demonstration of a smart device application (user feedback app) so that the user can respond with the correct activity and situation with details of their activity, e.g. running for 30 minutes followed by resting for 20 minutes. • A framework by analysing actual data captured during an exercise utilising heart rate BPMs for each activity suggesting an idea of individualised threshold table by training data for each user. This can be prescribed by physicians or medical scientists with consideration for a user’s health history and conditions.
36
1.6.4
Experimental Verification
With the inference system implemented, the test results verified that 1) critical information is always transmitted over non-prioritised requests, 2) unstable, inconsistent or fluctuating sensed data are screened and inferred for proper meaning, and 3) number of transmissions are efficiently reduced. As the result, resource consumption (bandwidth & battery power) of PSDs has improved significantly compared to before the application of the inference system on the sensors. As shown in the Discussion section for example, 20 times the number of transactions can be saved. In summary, this thesis contributes to design and implement an inference system to evolve with novel ideas of: • Inferring data requestors, data processing, situation and data transmission to reduce transactions using algorithms. • Implementing intelligence on body sensors and devices to work with smartphones and smart devices. • Using sensed data to help define the recognition of human activity and situation status in addition to existing accelerometer sensors to determine the alarm status. • Using user feedback to verify and increase accuracy of user activities through smartphone applications.
1.7
THESIS ORGANISATION
The remainder of the thesis is organised as follows: Chapter 2 provides an in-depth analysis and overview of existing works using a table summarising previous researches done on related areas. As this research presents a novel idea, this chapter includes various areas as sub sections to identify possible works for further study. This includes interfaces, inferences in health informatics, management of device and data and activity recognition to handle alarming issues. An extensive survey is included for security aspects in WBANs since the data deal with private and personal information, which can be critical when exposed or attacked. As results, privacy and security aspects are included in the Future Research Directions section.
37
Chapters 3 and 4 present the inference system including sub sections of detailed design, experiments and evaluation, and discussions. This includes inference system of data processing in chapter 3 and data transmission in chapter 4 respectively. Chapter 5 discusses further from the chapters above as it is important to assess the situation of the user wearing body sensors to determine whether the sensed data are normal or abnormal for raising an alarm. To determine and flag an alarm, it is essential to understand values for normal human activity such as resting or exercising as the data can be quite different for each activity type. It is proposed to use AR data to discern alarm determination with verifying the alarm by user feedback processes. Chapter 6 concludes with a summary and future research directions which includes a possible application model using the physiological information. Prediction of personalised life expectancy is presented extensively as an application model utilising health data to predict an individual’s health status using customised health index based on big data.
38
2
LITERATURE REVIEW
This chapter reviews and discusses prior work in the areas of mHealth and its networks. The following areas have been included for review: WBAN interfaces to mHealth and IoT, health inference and prediction, device and data management, security in mHealth and activity recognition. PSDs transmit health information to external networks and therefore it is important to ensure ‘privacy’ is securely protected. Security in WBAN is not fully included in the IEEE P11073 PHD work group standards yet as s sub work group (IEEE PHD Cybersecurity) is still working on the cyber-security, whilst they specify how to securely exchange health data between sensors and their agents. Security matters are left to lower layers and the application layer in the OSI model as shown in Figure 2.1. Therefore, security aspects of the solution are extensively reviewed and surveyed in this chapter to investigate what should be done for the solution and to identify areas of future works to ensure personal information and privacy are efficiently and securely protected.
2.1
INTRODUCTION
Sensors have traditionally been passive devices. Smart sensors are now being deployed but wearables are limited in the role of biomedical sensors nodes. Instead they are mainly used for monitoring and capturing physiological data such as in accelerometers, gyroscopes and pedometers. Therefore, it is hard to find literature regarding the empowerment of PSDs with intelligence, as intelligence is yet to be implemented on PSDs. There are few ‘inference’ related works found in the IoT domain [33] but not in the emerging areas of PSD or mHealth networks. However, there have been many solid approaches and works done in the IoT network domain. As a by-product of the solution, there can be an application of using the result of big data analysis and processing for a personalised life expectancy that can be estimated on an individual basis. Therefore, literature on prediction algorithm and mechanisms are searched and reviewed to see how this research will affect the industry. Whilst there are many research works found regarding life expectancy of a country, region, race or on a disease basis, there have been no works done on regarding this metric at a personal level basis. In this regard, [21] was published with a novel idea of tracking and predicting a personal health status for individuals as well as intelligent
39
functionality of inference systems in sensor nodes to interface IoT networks. Since it is very sensitive to handle physiological data of human from the perspective of privacy and security, an in-depth research was conducted to survey security concerns, methodologies and possible solutions of WBANs to be used in this project. [9] was published as the outcome and it is concluded that confidentiality (‘privacy’ aspect) is the main area which requires high priority security measures whilst other aspects such as data integrity and availability can remain at the industrial standards levels. When applications such as mHealth and IoT have been implemented, network and service operators shall tend to manage the devices for remote and real-time operations such as software updates, statistics and measurements, provisioning, security and billing. Activity recognition is essential to determine the status of alarm before transmitting sensed data to requestors. Thus, this area has been included in the search. Therefore the following areas have been searched deeply and broadly and can be divided into the categories as in Table 2.1 followed by details of the findings in the next sections: Table 2.1 Summary of Reviewed Literature
Literature
Year
Title
Interfaces and Routing between WBANs and IoT Bragg
2012
Intelligent Transmission of Patient Sensor Data in Wireless Hospital Networks
Jara
2013
Interconnection Framework for mHealth and Remote Monitoring Based on the Internet of Things
Riazul
2015
The Internet of Things for Health Care: A Comprehensive Survey
Sebestyen
2015
eHealth solutions in the context of Internet of Things
Akyildiz
2015
The Internet of Bio-Nano Things
Santos
2014
Internet of Things and Smart Objects for M-health Monitoring and Control
Almogren
2015
Developing a Powerful and Resilient Smart Body Sensor Network through Hypercube Interconnection
Health inference and prediction analysis Banaee
2013
Data mining for wearable sensors in health monitoring systems: a review of recent trends and challenges
Poorani
2012
Sensor based decision making inference system for remote health monitoring
Zhu
2013
Predictive Analytics by Using Bayesian Model Averaging for Large-Scale Internet of Things
40
Engel
2014
Context-aware inference model for cold-chain logistics monitoring
Xiang
2011
Application of inverse first-order reliability method for probabilistic fatigue life prediction
Raftery
2013
Bayesian Probabilistic Projections of Life Expectancy for All Countries
Haghighi
2014
Situation-aware mobile health monitoring
Zan
2016
An Improved Symbolic Aggregate Approximation Distance Measure Based On Its Statistical Features
Device and data management Harahap
2014
A router-based management system for prediction of network congestion
Lin
2015
Easy Connect: A Management System for IoT Devices and Its Applications for Interactive Design and Art
Abu-Elkheir
2014
Hybrid data management system for mHealth
Zhengguo
2015
Recent Advances in Industrial Wireless Sensor Networks Toward Efficient Management in IoT
Bohli
2015
SMARTIE project: Secure IoT data management for smart cities
Security in mHealth Kang
2015
A Review of Security Protocols in mHealth Wireless Body Area Networks (WBAN)
Kodali
2014
Key management technique for WSNs
Knorr
2015
Security testing for Android mHealth apps
Jack
2013
"Broken Hearts": How plausible was the Homeland pacemaker hack?
Gentry
2012
Fully homomorphic encryption with polylog overhead
Shelat
2015
Minimizing Overhead for Secure Computation and Fully Homomorphic Encryption: Overhead
Activity Recognition Fujimoto
2016
Wearable Human Activity Recognition by Electrocardiograph and Accelerometer
Chernbumroong
2011
Activity classification using a single wrist-worn accelerometer
Chen
2016
An improved algorithm for human activity recognition using wearable sensors
Abdallah
2012
StreamAR: Incremental and Active Learning with Evolving Sensory Data for Activity Recognition
Miu
2015
Bootstrapping Personalised Human Activity Recognition Models Using Online Active Learning
Hong
2016
Toward Personalised Activity Recognition Systems With a Semi population Approach
41
Arnon
2014
Classification model for multi-sensor data fusion apply for Human Activity Recognition
Tang
2014
Highly Accurate Recognition of Human Postures and Activities Through Classification With Rejection
Orha
2015
Activity recognition using an e-textile data acquisition system
Dohn
2013
Human activity recognition on raw sensor data via sparse approximation
Zhang
2015
Improving activity recognition with context information
Lara
2013
A Survey on Human Activity Recognition using Wearable Sensors
Tapia
2008
Using machine learning for real-time activity recognition and estimation of energy expenditure
Gao
2015
AR-tracker: Track the dynamics of mobile apps via user review mining
Győrbíró
2009
An Activity Recognition System For Mobile Phones
Roggen
2009
OPPORTUNITY: Towards opportunistic activity and context recognition systems
Kim
2010
Human Activity Recognition and Pattern Discovery
Tran
2008
Human activity recognition with metric learning
Chen
2012
A knowledge-driven approach to activity recognition in smart homes
Wang
2009
A framework of energy efficient mobile sensing for automatic user state recognition
2.2
INTERFACES AND ROUTING BETWEEN WIRELESS BODY AREA
NETWORK AND INTERNET OF THINGS There are some interfaces between IoT and eHealth networks which usually allow for good resources in power and system capacity as they are fixed devices such as a CT (Computed Tomography) Scan machine and are not mobile like PSDs such as a pacemaker carried by a patient. This makes the mHealth system quite different from eHealth. Whilst there are many works on improving sensor networks to process data such as using middleware in a new global sensor network infrastructure [34], improving routing protocols [35-37] or acquisition of reading and modelling the accuracy of the sensor reading using algorithms [38], there have been little works performed in trying to minimise the data sampling and transmission from the sensors. Bragg et al [1] proposed a reinforcement learning protocol based queue management and scheduling
42
scheme, which uses data criticality and deadline to determine the scheduling priority in WBANs consisting of sensor devices and a patient data controller (PDC). To optimise the performance, a packet arrives and is placed onto a queue at a PDC, which is then followed by a scheduling. Consequently, they try to minimise packet drops using criticality-weighted drop rate. This approach can be further used to incorporate event detection through the use of sensory signatures. If the function of PDC can be implemented within PSDs, it will be useful to enhance the efficiency of data transmission to PTs or IoT. However, they do not assume that not every datum has to be transferred if it does not have to be. It is not necessary to consume bandwidth and power resources by sending all available data if there is an effective method of reducing the number of original data sent, such as in the Nyquist theorem, which only selects 8000 samples per second for voice signalling in the public switched telephone network (PSTN) [39]. Jara et al [40] presented an interconnection framework for mHealth and IoT which makes continuous remote monitoring for vital signs. They also show patient monitoring and supervision using a new protocol YOPAY [40] that introduces health monitoring and patient devices based on Internet capabilities. Between IoT and PSDs, they suggest the IPv6 over Low Power Wireless Personal Area Networks protocol to be used and RFID for patient identification. However, it does not cover the function of data control or inferring the context in sensor nodes, which are critical requirements when considering the large traffic estimated to be transmitted from IoT to mHealth PSDs. Borodin et al [41] suggested applications design from multi sources for health care monitoring systems such as ECG and Heartrate monitors which require interfaces between PTs and IoT. They discuss how to collect and transfer health data to MC, however, they do not show how those monitoring devices can interface to other networks such as IoT. Riazul Islam et al [42] proposed a comprehensive network architecture for eHealth in the IoT domain. They cover detailed interfaces including protocol levels, security and privacy requirements and features, IoT based eHealth technologies including architecture, application solutions, and even addressing IoT and eHealth policies and regulations. In other words, they provide an overall idea of how eHealth can benefit from converging with IoT. However, it lacks a low level approach for how mHealth
43
can interface to IoT to transfer health data in an efficient and secure way, which this research project proposes from the perspective of mHealth. Sebestyen et al [43] designed a communication model called CardioNet to connect eHealth systems to IoT. They provide a modular portable device prototype, gateway and protocol design, activity recognition with mobile devices and patient monitoring station on an open architecture embedded platform. They suggest an Internet based health care system that can be implemented with their proposed communications models in the context of eHealth. However, their solution does not consider the amount of traffic volume from PSDs to IoT as well as concrete interface mechanisms to securely transfer health data. Akyildiz et al [44] proposed a new paradigm to extend the IoT to the concept of Internet of Bio-Nano Things by stemming from nanotechnology tools allowing medical computing devices. This enables intra body sensing and actuation networks for the exchange of information, interaction and interfacing with the Internet using an efficient and safe technique. The IoT computing device can be in the form of an artificial cell and consists of a control unit (processor), memory, sensors, battery, actuator and transceiver. Santos et al [45] proposed to use RFID tags to identify mHealth users in an IoT network in a simple and secure way, and established a generic and ubiquitous ambient assisted living framework. They also suggest focusing on security protocols at the application level secure channel, which is a rare case as most of mHealth application protocols such as IEEE PSD P11073-20601 [46] rely on security features on lower layers as in Figure 2.1. E.g. transport layer of communication protocols without providing security at the application layer but focuses on the exchange of health data. Almogren et al [47] proposed an intelligent network design for body sensor networks based on hypercube backbone structure called Smart BodyNet. It aims to operate with minimal sensor node loss and reduced overhead for smoother functionality even if the sensors failures. It is achieved by improving routing, building and operating of the network to reduce power consumption.
44
Device specialisations (3 domains) IEEE 11073 PHD
PHD security relies on lower layer
Health application (app)
Disease management 10400-10439
Health and Fitness 10440-10469
Independent Layer 5-7 living 10470-10499
11073-20601 Optimised Exchange Protocol Communication protocols Bluetooth/BT-LE/ZigBee/ANT+/NFC
Layer 1-4
Figure 2.1 ISO/IEEE P11073 PHD (personal health device) protocols. Security is not included in the PHD suite whereas PHD is focused on data exchange between the agent (sensor/server) and manager (PT/client)
2.3
HEALTH INFERENCE AND PREDICTION ANALYTICS
Wearable sensors have been developed and have increased significantly in number in the last few years, requiring the consideration of techniques on how the data are treated and processed. Accordingly, there have been many methods and algorithms used to analyse data from wearable sensors and physiological monitoring devices capturing vital signs in healthcare services including anomaly detection, prediction, diagnosis and decision making [48]. Poorani et al [49] presented an intelligent modelling technique considering a 3 axis accelerometer sensor to detect the fall of an older patient using an adaptive neuro fuzzy inference system. This detects an unexpected and unpredictable fall using an automatic detection mechanism with multiple sensing and event detection for elderly people at their home. They argue that the solution will provide with reduced computational complexity and more accuracy using one of five states such as standing, walking, sitting, falling and lying. The solution is only focusing on ‘falling’ for the inference to produce an alarm when recognising as a fall. This solution however, is limited to only one activity and does not consider all the possible actions of the patient, and the inference is limited to activity without the sensor’s data transaction to infer the traffic load. Engel et al [50] considered a context aware inference model to process a huge amount of data generated by wireless sensor networks in logistics operations. Multi-sensor
45
data combined with a context aware inference model delivers relevant information to the user for fast processing and supporting of high traffic of data. This allows for real-time monitoring of temperature-controlled supply chain or cold-chain. Hybrid context aware model retrieves sensor data and infers this data to produce relevant information. Whilst this proposal may be useful to process huge amounts of data using a context aware inference system, it does not consider inferring how to control the volume of data against traffic and information request from an external party such as IoT. Zhu et al [51] proposed the use of a dynamic Bayesian model averaging to develop a high-accuracy prediction analytic method for a large-scale IoT application. However, this method cannot be applied to mHealth data as the volume size and nature of the data are quite different between mHealth and IoT networks. IoT networks involve a huge number of devices over the Internet whilst mHealth is a personal body network. Xiang et al [52] proposed a probabilistic life prediction methodology which can be efficient in comparison to previous works. However, it is based on a general group approach and not on a personalised individual basis. Raftery et al [53] proposed that a Bayesian hierarchical model for producing probabilistic forecasts of life expectancy would be an input to the production of probabilistic population projections for all countries, however, not on a personal basis as it would be too generic. Haghighi et al [54] proposed a situation-aware mobile health monitoring framework to monitor health conditions using an algorithm of activity recognition classifier. They use activity enhanced fuzzy situation inference for situation reasoning with machine learning method to improve accuracy of situation reasoning. They identify health status by utilising health data such as heart rate with other vitals. However, their solution is processed out of sensors network, which is crucial in case of emergency, e.g. real-time alarming. Also, developing individual threshold would be a key information, which is not considered for alarm notification in real-time. Zan [55] proposed an improvement on symbolic aggregate approximation (SAX) to represent time series mining. They use symbols by the average (mean) value of a
46
segment with the assumption of Gaussian distribution to improve SAX representation and distance measure by the addition of another moment of prior distribution standard deviation. SAX transforms real-valued time series data into symbolic string based representation using two steps: (1) transforming the original time series to Piecewise Aggregate Approximation (PAA), and (2) converting the PAA represented values to alphabetic symbols based on the assumption that the given normalised time series data follows a highly ”Gaussian distribution”. This method, for example, converts 128 length time series to an 8 segment size with 3 symbols. This may be useful when representing bulk data to reduce the size, however, when accurate figures are required such as a heart rate of 136 beats per minute, it cannot represent the exact figure as it will be symbolised with approximated figure. However, it may be useful to assess a situation of activity as this thesis proposes to determine an alarming by analysing multiple health data together.
2.4
DEVICE AND DATA MANAGEMENT
A network management system (NMS) is required for almost every network, and this includes mHealth networks. There are sensors and monitoring devices within a WBAN, which forms a group of extended networks, e.g. sports team, military squad, emergency services, government department and factory workers division. To manage the devices and its data, each network usually has its own customised NMS system to monitor and maintain an optimal performance of networks with applications and tools to support operational administrators for their own purpose. For this reason, there are generally no off the shelf solutions for NMS, however, it is worthwhile to learn what technologies can be reused or adopted for efficient management. Harahap [56] proposed an idea of network prediction to support the network operator of notifying early warnings of possible faults or issues, allowing the administrator to take advanced actions to avoid the problem. They introduced a Bayesian network model to predict a network congestion through a router based data traffic analysis. Lin et al [57] developed a system to manage IoT devices based on M2M architecture. They characterised IoT devices by its ‘features’ such as temperature, vibration and display, so that they can write a software module for each feature like a building block to consist device feature modules. This will provide simple and efficient
47
mechanism for IoT interactions and applications development. While this concept may be used for mHealth devices, the nature, scale and purpose of PSDs are quite different and there must be an optimised solution for PSD management. Zhengguo et al [58] proposed a network device management system for wireless sensor networks for IoT using an approach to enable a cross-layer design of lightweight and cloud-based RESTful web service. This is to efficiently manage wireless sensor devices in a unified manager with an infrastructure to support various WSN applications and services to facilitate the control of sensor-equipped real world entities. They present overall industrial eco-system, architecture and device management standards aimed at the reliable management of WSNs. However, mHealth PSDs are quite unique and have different types of data and purposes as compared to WSN devices. Abu-Elkheir et al [59] proposed a mHealth data management system for offline, near real-time and long term operations. They consider the data volume produced by mobile and sensing technologies that need to be efficiently and continuously managed. In addition, they propose data management of mHealth with the aim of providing near real-time operational analytical services as well as deep analytics and processing. However, they do not consider deducing and inferring mHealth data prior to transferring to external networks such as IoT. Bohli et al [60] proposed a distributed framework for storing, sharing and processing large volumes of IoT data obtained across heterogeneous information. This provides information management services with security and can be operated above the heterogeneous network devices plane as a unifying umbrella. As mHealth data management will mainly occur within WBANs and the characteristic of its data is unique such as health data, this approach is not relevant for mHealth.
2.5
SECURITY IN MOBILE HEALTH
Privacy is key to the security of mHealth. Kang and Adibi [9] comprehensively surveyed a range of security protocols and mechanisms for mHealth. It includes a deep and broad range of security protocols and mechanisms for mHealth security, as well as its applications such as open standards and industrial proprietary solutions introduced by major device manufacturers. They discovered that many works have
48
already been done in areas of authentication, authorisation, key management and hash technologies. However, a light-weight security with a well-secured measure is required to transfer health data when it needs to communicate with IoT networks, which will request health data for their own purpose and are beyond the control of mHealth networks. This requires thorough security to protect mHealth devices as well as the privacy of users. Kodali [61] proposed a key management technique which uses reduced resource overheads. This can be used for hierarchical wireless sensor network applications and introduced identity based key management and probabilistic key pre-distribution schemes. There are many works which have been done in security areas, however, not many have considered mHealth traffic to IoT networks. Knorr et al [62] proposed a testing method for Android Health apps designed with a threat analysis considering possible attack scenarios. For the demonstration, they applied the method to apps for managing hypertension and diabetes. Their approach presented a more automated security testing of mHealth and focused on smartphones only without considering the perspective of PSDs. At the McAfee conference in 2011, Barnaby Jack demonstrated the hacking of an insulin pump [63] by overriding its default controls and injecting a deadly dose of insulin to the pumps. This occurred without any detailed knowledge of the device and highlighted the need for effective security measures for personal mHealth devices. Jack also demonstrated at the Melbourne Breakpoint security conference in 2012 [64] that a pacemaker transmitter could be reverse engineered and hacked to deliver a deadly electric shock with a maximum voltage of 830 volts. This resulted in a simulated cardiac arrest as well as the administration of continuous shocks. The motives of threats and attacks can be for personal reasons, financial gain, corporate espionage or terrorism. For mHealth threats, the motives can change based on the threat points as shown in Figure 1.2. While attacks on WBAN can be more to do with personal reasons, attacks on the MC or CT can be targeted for financial or terrorism motives at a larger scale. Methods of attacks are constantly evolving, however, they fall into two categories of passive and active attacks [65]. Passive attacks are intended to obtain health information via techniques such as eavesdropping and/or monitoring data being
49
transmitted across networks. Active attacks attempt to modify the data stream and reinject it into the network without changing the nature of communication, which makes the detection of these attacks difficult. Attacks can be done by initially accessing the network from within the WBANs, or externally by targeting the MC database or the CT network. The question is why the attacker targets an individual and with what motivation. Is it really important and worthwhile to implement strong security mechanisms on a personal WBAN with constraints and limited physical access, such as a barrier 5 to 30 meters diameter from the target? Some users may not require or want high security levels as it may compromise processing power. Therefore, users should be able to choose the level of security they want in their WBAN. For example, the Federal Information Processing Standard (FIPS) Publication 140-2 is a US government security standard which defines four levels of security for cryptographic modules [66]. Threats on sensor nodes can be on two areas: sensors and monitoring devices. Sensors in general have very simple functions on layers 1 and 2 collecting data and sending it through to monitoring devices which have higher layer functions and are able to communicate with smartphones. Some monitoring devices are intelligent and able to interact with PTs where threats can occur at various layers including the physical, data link, network, transport, and application layers across the monitoring devices and the PT. There can be two activities in the attacks including monitoring and capturing of message content and traffic analysis which can be mitigated by masking the information using encryption. The other attack is to modify the data and inject it into the mHealth network so that the attacker can achieve what they intended to provide in the modified content. These are shown as ‘read’ and ‘read/write’ in Figure 1.2. Open source sniffing devices can easily capture Bluetooth and Bluetooth Low Energy (BT-LE) signals and data between sensors and PTs. This sniffing device can be purchased online or constructed at home according to an open source manual from affordable parts with software that is provided [67]. It can also be purchased off the shelf in many countries. This allows potential attackers to develop a hacking device without needing to invest large amounts of money for equipment that are used by labs and vendors in the industry. If a security mechanism has been implemented in this case, it will make it difficult to hack the security code and obtain the data whilst
50
traffic analysis is still able to be done by the sniffing device. Michael Ossman built and presented Ubertooth One at ShmooCon conference in 2011. This device allows for Bluetooth Basic Rate injection, BT-LE monitoring and injection, 802.11 Frequency Hopping Spread Spectrum (FHSS) monitoring and injection, and basic spectrum monitoring [67]. This kind of device poses privacy concerns as it can be used by attackers to intercept health information of mHealth users. There is also the threat of the ability to modify information which could be used to directly manipulate monitoring devices to perform a malicious task such as delivering a lethal dose of insulin. It is only a matter of time for this simple device to evolve and be capable of attacking all layers such as DoS (denial of service) from the physical layer up to the application layer. As WBAN protocols are based on an OSI 7 layer model, various threats may occur at each of these specific vertical layers. Therefore, the threats will be discussed from a layered approach as security mechanisms can also be approached at each layer. For example, the National Security Agency (NSA) Suite B can be deployed at the Application, Transportation and Network layers [68]. In the case of dumb sensors which is only responsible for collecting data and delivering it to the data collector such as monitoring devices or PT without providing any additional services, physical and media access control (MAC) layers (Layer 2) may be the only layers applicable (MAC layer is a sub layer of the data link layer). As this thesis proposes saving battery power of sensors as an ultimate goal, overhead aspects of implementing security measures are reviewed. The cost of encryption can be minised for the overhead, such as using Fully Homomorphic Encryption, which allows computations to be carried out on ciphertext, of which encrypted result matches the result of operations performed on the plaintext when decrypted [69, 70]. However, it still requires the cost of security measures. The cost associated to the cryptography algorithms such as HSE (hashing, digital signature, and encryption/decryption) and authentication can cause additional overhead (especially for digital signatures). It also requires the additional time for computing the ciphertext and the reverse action, which contributes to the added delay and bandwidth. When taking only encryption/decryption into account, e.g. the cipher block chaining where the input and output blocks may be of the same size, it may look like that there is no additional overhead involved in creating the ciphertext. However, the
51
cumulative volume of the ciphertext may not be the same as the plaintext due to additional necessary operations such as the data padding to fit the block size. At the receiving party when used with data compression, the transmitted ciphertext size may be reduced, however, with the added delay for the compression/expansion operation, it may not improve the overall performance.
2.6
ACTIVITY RECOGNITION
There have been many works done in the area of AR which is an emerging technology becoming popular in many applications in medical, security, entertainment and tactical scenarios [71]. Accelerometers are used for an objective measure of physical activity and they have been used to estimate energy expenditure and activity type. Wireless accelerometers can be used for real-time automatic recognition of physical activity type, intensity, and duration and estimation of energy expenditure [72]. Fujimoto et al [73] proposed to use an electrocardiogram (ECG) and a 3-axis accelerometer to capture physiological data and estimate human activity using a fuzzy decision tree. They work on the assumption that heart rates change when transitioning activity status from a sitting to a standing posture for instance. They also tried to estimate a series of activities with the state of activity transitions based from the previous activity. From the experiments conducted in this thesis, however, it is not always predictable to estimate a human activity from one to another as there is not necessarily a set sequence of motion when a human changes posture, e.g. user may go from sitting to suddenly running. Furthermore, heart rate is not determined by an activity or posture although it is closely related to activities. For example, heart rate of running is generally higher than that of resting. Chernbumroong et al [74] carried out experiments to investigate the use of a single wrist-worn accelerometer for automatic activity classification. Comparing the performances of two classification algorithms, namely Decision Tree C4.5 and Artificial Neural Network, they used four different sets of features to classify five daily living activities. Even though the result revealed that the best accuracy of 94.13 per cent was achieved using only a wrist-worn accelerometer, their scenarios are limited to showing a possibility of automatic activity classification with no movement constraints, discomfort and stigmatisation caused by the sensor.
52
Chen et al [75] proposed to improve the recognition of human activities using the ensemble empirical mode decomposition (EEMD), the sparse multinomial logistic regression algorithm with Bayesian regularization (SBMLR) and the fuzzy least squares support vector machine. They reported that an overall mean classification rate of 93.43% was achieved and that it exhibits the remarkable recognition performance as compared with other approaches. They used wearable devices featuring light-weight wearable sensors to recognise the activity more flexibly and reliably. Abdallah et al [76] proposed a solution focusing on integrating supervised, unsupervised and active learning for activity recognition using a concept called StreamAR which builds an adaptable model with evolving sensory data. Their learning model contains clusters that represent different activities that are emerged with hybrid similarity measures to match up the similarities of the new cluster/activity with existing ones. Miu et al [77] developed a method to collect annotations (labels) from AR system users and to bootstrap personalised activity models solely from user-provided annotations. They use an online active learning framework for monitoring a user’s stream of activities and identifying prospective annotations using a very limited horizon on time. They also reviewed other methods for modelling including selfprovided annotations, pool-based active learning, stream-based active learning, interrupting users, activity segmentation and bootstrapping new models vs. adapting existing models. As opposed to [76] who uses clusters, they propose to direct annotation requests at individual activities to evaluate the system against a more diverse set of activities. They claim that their online active learning method registers performance gains over soliciting annotations at random. Hong et al [78] suggested and focused on the generalisation of building activity models which uses a semi population-based approach to build a new user’s label using activity models trained from other users. Instead of using any additional information from users like their weight or height, they directly measure the fitness of others’ models on a small amount of labelled data collected from the new user. Using these activity models shared among users, they compose a hybrid model of Bayesian networks and support vector machines to accurately recognise the activity of the new user. Along with a diversity of participants in gender, age, weight, and
53
height, their approach outperforms others that rely on users’ demographic information for recognising their activities. This may contradict the commonly held belief that physically similar people would have similar patterns of activity. Most works in the AR domain are related with sensed data classification, modelling and acquisition [79-82], or using context to improve the recognition performance with the recognition accuracy increasing as more context information is obtained [83]. However, none have attempted to use multiple physiological data to improve the accuracy of the result, labelling, processing and modelling of AR but have only used data obtained from wearable devices or sensors with an accelerometer equipped within. Therefore it is expected that this thesis may affect previous works in this area significantly as the data content will be extended to include physiological information. Gao et al [84] proposed a new method for a topic-ranking and review-ranking scheme to prioritise the user reviews to help developers capture the most up-to-date issues with proper topic modelling. They developed ‘AR-Tracker’, a framework to mine user reviews without the need of human labelling and to track the dynamics from the top-ranked reviews. This solution may be utilised further to collaborate with physiological sensors to analyse data and mine them to increase the accuracy of determining an activity situation. Győrbíró et al [85] recognised that an initial user-feedback system may be necessary to configure an AR system appropriately for each particular user. Bao et al [86] demonstrated that whilst some activities are recognised well with subject-independent training data, others require subject-specific training data. As this thesis proposes to use a threshold table prescribed for anomalies by clinicians for individuals, it will increase the accuracy of the activity determination. Roggen et al [87] developed methods for opportunistic human activity and context recognition, and presented results to take advantage of opportunistic sensing and bringing it towards opportunistic recognition of human contexts and activities. That is to provide smart assistance and context-aware ambient intelligence environments, which can interpret sensed data in terms of context by wearable and pervasive computing.
54
Kim et al [88] discussed the idea of human activity recognition and the process of activity pattern discovery comparing hidden Markov models, linear chain conditional random field (CRF), skip-chain CRF and emerging patterns. They proposed to create a community standard for such representation known as the Sensory Dataset Description Language (SDDL). Tran et al [89] proposed a metric learning method with aims of (1) rejecting unfamiliar activities and (2) learning with few examples to improve action classification problems. They claim that their method can accurately label activities as well as reject unseen activities from few examples with high accuracy. This can be further improved by utilising physiological data which can be captured with activity sensors. Chen et al [90] presented an underlying ontology-based recognition process and introduced an approach with a knowledge-driven for real-time and continuous activity recognition based on multi-sensor data streams for smart home environments. They use domain knowledge in the life cycle of activity recognition, and ontologies for explicit context and activity modelling for representation. They also exploit semantic reasoning and classification for activity inferencing to enable coarsegrained and fine-grained activity recognition. They demonstrated an average activity recognition rate of 94.44 percent and the average recognition runtime per recognition operation measuring as 2.5 seconds. Wang et al [91] introduced an energy efficient mobile sensing system using a hierarchical sensor management strategy to recognise user states as well as to detect state transitions. The system automatically recognises a user’s daily activities in real time using sensors on an off the shelf high-end smart phone. It increases battery life by more than 75% while maintaining high accuracy and low latency in identifying transitions between activities. This concept however, can be further improved if it is able to increase the accuracy of user activities by discerning sensed data as proposed in this thesis.
2.7
SECURITY IN WIRELESS BODY AREA NETWORK
This section extends the security of mHealth from the perspective of WBAN to ensure what aspects are required to support implementation of inference system in
55
personal sensor devices. Current security services, mechanisms and applications with protocols are comprehensively described with results of experiments to compare the data size and overhead of encryption and cryptography. 2.7.1 Layered Approach of Threats and Attacks 2.7.1.1
Layer 1 (Physical Layer)
The physical layer sometimes termed PHY provides the means of transmitting raw bits (bit stream) via frequency and modulation in the form of electronic signals. Attacks can be made by transmitting the same frequency bandwidth to the target area so that the receiving device may have additional noise and changed phase of signal. Jamming: Jamming involves interfering with a network’s radiofrequency signals in an attempt to disrupt communication between nodes. Defences against jamming include spread-spectrum communication techniques such as frequency hopping and code spreading. Tampering: If an attacker is able to physically gain access to a node, they can be altered or replaced with a node controlled by the attacker. They may also obtain sensitive information such as encryption keys and other data available on the node. Defences include protecting the physical package to prevent the incidence of tampering. 2.7.1.2
Layer 2 (Data link layer)
In a broadcasting domain, there can be a collision when transmitting logical bits (frames) to adjacent nodes within the same local area network. The data link protocol prevents this by specifying how devices detect and recover errors. MAC flooding is a common attack in this layer. Collision: When two nodes attempt to simultaneously transmit data on the same frequency. A typical defence against collisions is the use of error-correcting codes [92]. Exhaustion: An attacker can cause resource depletion by making many repetitive collisions. A defence is to prevent the energy drain by limiting rates to the MAC admission control allowing the network to ignore excessive requests. Unfairness: An attacker can cause other nodes to miss their transmission deadline and undermine the communication channel capacity.
56
2.7.1.3
Layer 3 (Network layer)
Across WSNs in between or to WBANs, a routing is required to transmit data through the network layer which will be carried over lower layers as a payload including origination and destination information. Routing attacks and distributed denial of service (DDoS) attacks are common in this layer making resources unavailable by using multiple compromised systems to target a single device or system. Selective Forwarding: A compromised node blocks packets in the network by rejecting to forward or block messages that pass through them. They also redirect the message to a different path to create false routing information. A defence includes using multiple paths to send data as well as attempting to detect the malicious node. Sinkhole Attack: A compromised node advertises false routing information to attract all network traffic in a certain area to pass through that node [93]. Sybil Attacks: A single node in a network claims multiple identities and thus presents itself in more than one location. The attack aims at fault tolerant schemes such as distributed storage, multipath routing and topology maintenance. This can be defended against by authentication and encryption techniques. Wormholes Attacks: An attacker gets packets at a point in the network and tunnels them to another point and replays them into the network from that point. HELLO Flood Attacks: An attacker floods HELLO requests to legitimate nodes using a high-powered transmitter to override the security of WSNs. Cryptography is currently the main solution to this type of attack, but it suffers from limitations of computational complexity [94]. 2.7.1.4
Layer 4 (Transport layer)
The transport layer provides end to end communication system with intelligent functionality such as flow control and multiplexing. Flooding: Where an attacker floods a network with large amounts of traffic so that its resources are unable to handle the connection requests. As a result no further genuine connections can be made as the server has reached a maximum limit. A security mechanism against this is to require each client to solve a puzzle. De-synchronization: Repeatedly sending messages to disrupt the established connection between two nodes.
57
2.7.1.5
Layer 5, 6 and 7 (Application layer)
As the top layer of protocols, it communicates with end users in the form of application software such as smartphone apps. Since its usage and scopes are broad, there are many types of attacks such as DDoS which can consume the bandwidth with volumetric SYN floods followed by HTTP floods for instance. The attacks also disrupt transactions and access to databases so that service can be denied with lack of resources which were taken by the attack. 2.7.2
Security Services
Security services mitigate threats and attacks and are provided by a protocol layer of communicating open systems to ensure adequate security of a system or of data transfers [95]. Security categories are divided into three major areas which include Confidentiality (information disclosure), Integrity (information modification) and Availability (information denial) also known as the C.I.A Triad [96]. mHealth networks including WSNs, WBANs/PTs, MCs and CTs require stringent and scalable security measures at all levels (layers) from application and transport layers up to physical layers [92]. 2.7.2.1
Confidentiality
A patient’s identity is authenticated by providing evidence that it holds the specified identity. These include digital certificates and signatures, tokens and passwords between WSN devices in addition to being registered in a WBAN, which connects to a MC in a similar manner. This function is one of the most important roles of security before transferring any data. However, it is also the most vulnerable when attacked [92, 97]. 2.7.2.2
Data Integrity
Data collected and stored in a device or system of mHealth should be protected so that it cannot be accessed or altered by an unauthorised party to ensure that the data received is exactly the same as the one sent by an authorised entity [95, 98]. A patient’s personal and health data can be separated with further security mechanisms so that attackers cannot identify the patient of the health data. This could be achieved if the health data stored in the MC or the CT does not store personal information such as names and health data in the same place but uses a randomly generated
58
identification number. A patient’s health data should also be protected from being extracted and re-injected into the same database to prevent manipulation of the data. 2.7.2.3
Availability
When a patient’s monitoring device such as an insulin pump or pacemaker malfunctions, it is critical for a caregiver to communicate with the monitoring device as well as the patient as it may result in a loss of life. Switching to another node in the network from the attacked node can be an option and the network and system design should allow this redundancy even though it will not be necessary to have high availability such as full redundancy at all networks except the MC [92]. Health data should be available when needed and include a timestamp to avoid invalid treatment by caregivers. For example, the condition of the patient may change on a rapid basis, however, information which the caregiver uses to treat the patient could be up to a few hours old. Factors such as network outages in a remote region could delay data transmission. It is therefore important to consider the freshness and define the age of the data [97]. 2.7.2.4
Privacy Policy
According to a study conducted in 2014, only 30.5% of the 600 most popular medical apps had a privacy policy including Android and Apple devices. Users of the apps are targeted for marketing and their personal and health information may be sold without their permission [99]. Privacy of mHealth is important as it includes information collected over a long period of time as well as a broader range of personal information such as a patient’s lifestyle and activities. Patients’ health data are treated with confidentiality as is the case in offline hospitals and medical centres, and should not be distributed to other organizations or entities without the written consent from the owner of the health data. It is required by strict policies, laws and regulations as health information is sensitive material and can be detrimental to the owner if it is disclosed. Therefore, the privacy of patient’s health data in a mHealth system should be securely protected and understood by personnel involved. Education and training via a certification program should also be considered [92]. The table below depicts extended security services further than the ITU-T X.800 and CIA Triad based on the mHealth network areas of threat points.
59
Table 2.2 Security Service Categories within mHealth Networks. Privacy is a unique trait and always applies to any health related networks. Thus ‘privacy’ is the main security aspect in this thesis
Security Category
WSN
WBAN
MC
CT
Confidentiality (C)
x
x
x
x
Data Integrity (I)
x
x
x
x
Availability (A)
x
x
x
x
x
x
x
Privacy Authentication
x
x
x
x
Authorization
x
x
x
x
2.7.3
Security Mechanisms
Security mechanisms refer to security protocols and security algorithms designed to prevent attacks from occurring. This section will cover two popular security protocols which are key management and route discovery protocols, and one security algorithm which is Suite B (and Suite E drafted by IETF) cryptography designed by the NSA. IEEE 802.15.6 provides a security protocol for WBANs. An algorithm is a procedure that is used to encrypt data for use in cryptography, whereas a security protocol describes how an algorithm should be used [100]. There are two cryptography algorithms; Symmetric and Asymmetric. Symmetric algorithm refers to using the same keys for both encryption and decryption, and has the advantage of using less computational power. However, it is more vulnerable if the key is disclosed. Some well-known examples are Advanced Encryption Standard (AES), Data Encryption Standard (DES), 3DES, International Data Encryption Algorithm (IDEA), CAST5 (developed by Carlisle Adams and Stafford Tavares using 128bits key size), Blowfish, Twofish, and Revest Cypher 4 (RC4). Asymmetric algorithm requires two keys, one for encryption and another for decryption. The encryption key is used by all, and therefore it is called the public key, whereas the decryption key is kept secret and is called the private key which is not shared by all. For example, a smartphone may use private and public keys to communicate with monitoring devices which will use the public key given by the smartphone to encrypt and send data, which is then decrypted by the smartphone using the private key. There are RSA (Rivest Shamir Adleman), DSA (digital signature algorithm) and ElGamal for asymmetric algorithms. Asymmetric algorithms were first published by Diffie and Hellmann [101, 102]. Key management protocols are popular including many various public
60
key infrastructures. Lightweight Public Key Infrastructure (L-PKI) is recommended for WSNs and WBANs as it provides energy efficient security features suitable for the limitations of WSN devices [103]. Mohammed Faisal et al recommended Secure and Energy-efficient Cluster based Multipath Routing (SECMRP) protocol for the route discovery protocol along with L-PKI within WSN as it prevents internal, passive and impersonation attacks. SECMRP provides a phased approach including route discovery, data transmission and route maintenance in a secured manner [104]. 2.7.3.1
Authentication
In order to identify legitimate nodes between mHealth devices, there is a process required to identify whether the received data is coming from the authentic nodes. There is also a process to identify the user at the application level to access the PT using various methods such as user ID and password, fingerprint or retina scanning, voice recognition and so on. Security mechanisms can provide the authentication process before transmitting data. There are numerous types of technology used such as a certificate, digital ID, bio-metric, two-factors and proximity [105]. If a patient loses their smartphone, there must be a way for them to securely regain connection with their sensor devices. Being able to authenticate the user when bringing in a new sensor device or a new processing device and securely integrating into the existing network must also be considered. For instance, certificates can be downloaded from the Certificate Authority (CA) onto the PT which will also require a pre-set password from the application software to be paired up with the replacing unit. The password should never be stored on the PT and instead be stored with a hash function such as Secure Hash Algorithm 2 (SHA2) which can be encrypted and used by the PT to verify and authenticate the user. 2.7.3.2
Authorization
Whereas authentication is the process to identify legitimate nodes or users within WBANs, authorization is required to allow users such as patients or caregivers to access MC database to populate information required. For instance, physicians may have a different privilege level of access to health data than patients and health service providers. Within WBANs, sensors may have different rights to collect certain data and send them to certain destinations. For instance, cluster sensors may have a different authorization level to other sensors.
61
2.7.3.3
IEEE 802.15.6 Wireless Body Area Network (WBAN) Security protocol
IEEE 802.5 Wireless Personal Area Network (WPAN) task group 6 (TG6) Body Area Network (BAN/WBAN) developed a communication protocol for low power devices which also covers WBANs including security protocols. IEEE 802.15.6 standard security network topology has two entities, nodes and hubs. A node contains MAC and PHY layers, and a hub has a node’s functionality and manages the medium access and power management of the nodes. All nodes and hubs have to select one of three security levels: unsecured communication, authentication but no encryption, and both authentication and encryption. There is a procedure of security association to identity a node and a hub with each other using a master key (MK) followed by generating a pairwise temporal key (PTK) which is used for unicast communication only once per session. For multicast communication, a group temporal key (GTP) is generated and shared with the corresponding group. Before the exchange of data, all nodes and hubs pass through various states at the MAC layer including an Orphan, Associated, Secured and Connected state for secured communication, while Orphan and Connected states are used for unsecured communications. The security association and disassociation procedure is done by typical three handshake phases (request, response, activate (or erase)). A 13 octet nonce is used for each instance of CCM (Counter with CBC-MAC, which refers to Cipher Block Chaining Message Authentication Code) frame authentication and encryption/decryption. Along with the MAC header, low-order security sequence number (LSSN) and high-order security sequence number are used to synchronise the frames [106]. There are four two-party key agreement protocols to generate a master key which can be used in IEEE 802.15.6: Unauthenticated, Hidden public key transfer authenticated, Password authenticated and Display authenticated key agreement protocols and procedures. All of them are based on elliptic curve public key cryptography. However, Toorani argues that IEEE 802.5.16 is vulnerable to different attacks such as key-compromise impersonation (KCI), unknown key-share (UKS) and Denning-Sacco attacks [107, 108]. 2.7.3.4
Key Management protocols
Sarah Irum et al [103] proposed using hybrid techniques for key generation. As opposed to the existing key management technique which pre-loads generated keys,
62
this suggests generating keys using physiological values (PVs) of the human body, which are used by the sensor nodes to calculate keys. Key management systems have evolved into various sub areas to suit the purpose of various security requirements. A public key infrastructure (PKI) utilises a CA in order to manage public keys. Many PKIs use asymmetric key algorithms such as Diffie-Hellman and RSA which consume a lot of resources and power [8]. High energy consumption in WSNs due to their limitation of resources is not ideal and there have been several proposed solutions to implementing PKI with this consideration in mind. While there are many proprietary key management systems such as TinyPK, µPKI and L-PKI, L-PKI can be considered for WSNs/WBANs as it supports all of authentication, confidentiality, non-repudiation and scalability that is suitable for the resource-constrained platforms such as a wireless network of WSNs and WBANs whereas other PKIs only provide a smaller number of these services [104]. L-PKI is based on Elliptic Curve Cryptography (ECC) to decrease its computational cost and consists of various components: Registration Authority (RA), CA, Digital certificates, Certificate Repository, Validation Authority (VA), Key generating server (KGS), End entities (smartphone) and Timestamp server. Compared to a traditional modular exponentiation (RSA) which is not suitable for the resource-constraint network such as WSNs, L-PKI with an ECC based system requires significantly smaller keys which increase efficiency. For example, 160 bit keys in an ECC based system has the same level of security as those of a 1024 bit keys in an RSA based system [109]. The focus of key management systems are scalability and power efficiency as these are the deciding factors for what level of security mechanisms to implement in WSNs and WBANs. For example, light weight data confidentiality and authentication algorithms might be implemented differently in WSNs to WBANs as both networks have different hardware capacities [110]. While the number of keys generated in WSNs are limited due to the constraint of power and computational capacity, it is possible to implement a full scale security mechanism in smartphones to store and transmit health data and patient information to MC. To generate a master key, a user login and password is required for key generation along with other information such as user random salt, fixed salt and iteration count, which will be used for encryption of health data, patient information, and account information before sending it to MC via a secured channel such as SSL/TLS and IPSec.
63
2.7.3.5
Route discovery protocols
In a simple sensor network, data exchange may occur by point to point between nodes without requiring a routing protocol. However, a comprehensive network will require routing to provide path redundancy and efficient communication within the network. Route discovery protocols are used within the WSN to communicate with a PT (base station) where intelligent routing is required to find the shortest or better path within the WSN including cluster headers. The Secure and Energy Efficient Multipath (SEEM) Routing protocol does not use the lowest energy route but rather finds multiple paths to the source of the data and selects one of them to use [111]. However, SEEM does not have cryptographic mechanisms and only provides security services for balancing. Intrusion-Tolerant Routing Protocol for Wireless Sensor Networks (INSENS) is also a multipath routing protocol designed to reduce the computational power and resources required. SECMRP uses secure route discovery, secure data transmission and route maintenance phases. It uses L-PKI and is a proposed route discovery protocol designed to be suitable for WSNs. It is able to provide security services for authentication, confidentiality, integrity, balancing and scalability whereas SEEM can only provide balancing and INSENS is unable to provide scalability. 2.7.3.6
National Security Agency (NSA) Suite B and E Algorithm
The approval and support for the use of the NSA Suite B cryptography in the public and private sectors is growing. The Australian Department of Defence officially approved the use of Suite B cryptography in 2012 to protect confidential information [112]. Companies such as Cisco are now moving forward to accept Suite B cryptography to replace their previous proprietary security mechanisms. The NSA has also designed an IPSec Conformance Evaluator tool to allow the validation of vendor products and their compliance to NSA Suite B standards. The NSA has promoted and made Suite B widely known in addition to the existing Suite A which is a set of algorithms [113]. The current evolution of cryptography from industry to NSA Suite B can be seen below [114] and it is continuing to evolve. 1. Encryption: IPsec: 56-bit DES -> 168-bit Triple DES (3DES) -> 128-bit AES (Galois/Counter Mode [GCM] and Galois Message Authentication Code [GMAC]) -> 256-bit AES (GCM and GMAC)
64
2. Digital Signature: Short RSA Keys -> 2048-bit RSA Keys -> Elliptic Curve Digital Signature Algorithm (ECDSA) 3. Hashing: MD5 -> SHA-1 -> SHA-256 -> SHA-384 and SHA-512 4. Key Exchange: Diffie-Hellman -> Elliptic Curve Diffie-Hellman (ECDH) (using P-256 and P-384 curves) Since being accepted in industry by integrating Suite B, the military, government agencies, and both the public and private sectors can share information over the internet and non-trusted networks by increasing the security of sensitive content such as intellectual property and employee information [114]. It is now required to consider how Suite B should be implemented across mHealth networks as issues still remain on computational capacity with constraints of power limitations in WSNs and WBANs. There was a need to develop a modified version of Suite B to suit handheld devices such as smartphones as Suite B is mainly used for larger systems. Suite E is light-weight and energy efficient which is suitable for smaller devices running WBANs that require low power consumption. Suite E components as shown in Table 2.3 are mainly designed to provide smaller certificate sizes, low computational complexity, bandwidth usage reduction and one way compression function. Suite E uses easily embeddable algorithms to reduce overall costs of running the system [68]. ECQV (elliptic curve Qu-Vanstone) implicit certificate scheme is used with a set of standard symmetric key and elliptic curve public key to provide 128-bit cryptographic security in Suite E. This also includes Elliptic Curve Menezes-QuVanstone (ECMQV) key agreement protocol and Elliptic Curve Pinstov Vanstone Signature (ECPVS) signature scheme with message recovery for compact signed messages [115]. Detailed information of the functionality of Suite E has been specified in the IETF Draft document (2011) along with other security standards being developed such as Standards being developed in the Standards for Efficient Cryptography Group (SECG) and ANSI X9 [115]. Depending on the classification of security, different components are used such as AES with 128 bit keys, which is used up to the secret level and AES with 256 bit keys for the top secret level. The components of Suite B and E are shown below [42]. Table 2.3 Summary of Suite B and E Algorithms, which are becoming popular to government and industry areas
Suite B
Suite E
65
Function
AES (128 or 256 bit key size)
AES-CCM/CGM
Encryption
ECDSA (256 or 384 bit prime
ECPVS/ECQV
Digital signatures/certificate
ECDH
ECMQV
Key agreement
SHA 2 (SHA-256 and SHA-384)
SHA2/AES-MMO
Message digest
moduli)
2.7.3.7
Application Specific Security Mechanisms
Security mechanisms may be incorporated into the appropriate protocol layers in order to provide some of the OSI security services. They include: encipherment, digital signature, access control, data integrity, authentication exchange, traffic padding, routing protocol, notarization, trusted functionality, security label, even detection, security audit trail and security recovery [116]. 2.7.4
Security of Application and Communication Protocols
While security mechanisms provide protocols and algorithms to transfer data securely, application and communication protocols are also required to transfer health information between sensors and a PT. This section looks at the security aspect of popular communication protocols including ANT+, ZigBee, Bluetooth/Bluetooth Low Energy (BT-LE), which were chosen as popular and emerging technologies with their market penetration (ANT+), Ultra low-power (BT-LE), and low-power mesh networks with flexible routing (ZigBee). IEEE 11073 Personal Health Device (PHD) standard is also discussed in this section as an application protocol as it specifies how to exchange messages on top of the communications protocols as depicted in Figure 2.1. 2.7.4.1
ANT2/ANT+
ANT+ technology [117] is preinstalled on many smartphones, particularly those by Samsung and Sony Ericsson. ANT is a communication protocol whereas ANT+ is a managed network which allows interoperability between WBAN devices. For example, ANT+ enabled monitoring devices can work together to assemble and track performance metrics which provides a user with an overall view of their fitness. They provide ultra-low power wireless, high value at low costs, ease of development and interoperability as an open source for Android developers. ANT communication
2
Another Neat Tool (ANT) is a Java based build tool by Apache Software Foundation
66
protocol allows ANT+ installed devices to communicate with any product that uses this technology, universalizing its compatibility between all products with the ANT+ feature. ANT+ also offers off the shelf packages including both the required sensor devices and the application. Similar to BT-LE, ANT can be configured in a low power sleep mode and wake only when communication is required followed by returning to sleep mode afterwards. ANT channels are bi-directional supporting various messaging types: 1. Broadcast messaging: a one-way communication from point to point or point to multi-point. There is no need to acknowledge from the receiving node to the sender 2. Acknowledged messaging: there is confirmation of the receipt of data packets of whether it has been successful or failed, even though there is no re-sending of packets 3. Burst messaging: a multi-transmission technique with the full bandwidth usage and acknowledgment that it is sent with the re-sending feature for corrupted packets. 2.7.4.2
ZigBee
ZigBee [118, 119] is a specification for communication protocols designed to be used in creating personal area networks. ZigBee is designed to provide simple and energy efficient connectivity between devices and is less complex than devices that use Bluetooth. Due to its low power consumption and secure and easy management, ZigBee is used in many mHealth technologies. The ZigBee standard builds upon the IEEE 802.15.4 which provides Physical (PHY) and MAC layer, and provides security services for key exchange and authentication [120]. Security of ZigBee is based on a 128 bit AES algorithm in addition to the security model provided by IEEE 802.15.4. The trust centre provides authentication for devices requesting to join the network as well as maintaining and updating a new network key. ZigBee uses three types of keys including Master, Network and Link keys. 1. Master key: Trust centre master keys and Application layer master keys 2. Network keys: Provides ZigBee network layer security being shared by all network devices using the same key
67
3. Link keys: Provides security between two devices at the application layer ZigBee provides two security modes of standard and high. High security mode provides network layer security (with a network key), application layer security (with a link key), centralised control of keys (with Trust centre), ability to switch from active to secondary keys, ability to derive link keys between devices and entity authentication and permissions table whereas the standard security mode does not provide the last two items of the high security mode. 2.7.4.3
Bluetooth/Bluetooth Low Energy (BT-LE)
Bluetooth [121-123] is a standard designed for the wireless transfer of data over short distances. While BT-LE reduced the number of channels to 40 with 2MHz wide channels to minimise the energy consumption such as a tenth of the energy consumption of Bluetooth [124], Bluetooth uses a frequency of 2.402 GHz to 2.480 GHz allowing communication on 79 channels with spread-spectrum frequency hopping. This is called adaptive frequency hopping for robust and reliable transmission, and reduces the instances of interference between two or more devices. While Bluetooth provides 2mbps, BT-LE provides up to ~100 kbps payload throughput with much less energy consumed by remaining in constant sleep mode until a connection is initiated [125]. Bluetooth packets show the LAP (lower address part) of a particular Bluetooth device address (BD_ADDR) which is a 48 bit MAC address. Lower 24 bit of the BD_ADDR is LAP (or device ID) which is transmitted with packets while upper 24 bit is a manufacturer’s ID. In other words, a different LAP refers to a different Bluetooth device. A simulation was conducted to investigate the effects of encryption and no encryption on packet size during data transfer over Bluetooth. For this simulation, Bluetooth packets were captured using Android 4.4 Bluetooth HCl snoop feature and decoded using the Wireshark protocol analyser (v1.12) software. Figure 2.2 illustrates the message captured between two devices via Bluetooth during the simulation of data transfer between a sensor and a PT with no encryption and no compression. It shows the decoded captured message which is viewable including the source and destination device address using LAP (i.e. lower half of MAC address) as well as the content of the information (scan event report of the sensor) transmitted between the two Bluetooth devices. Figure 2.3 shows the data captured with the file compressed and encrypted with AES-256 with a private key which does not allow
68
the content to be viewed. Sample message transferred are as below and these are encrypted to compare the size of the message before and after:
object handle 1 nu-obvs-val-simp 60.7 2014-12-23 4:30:59
Figure 2.2 Bluetooth Packet Capture (No Compression or Encryption). Contents can be shown
Sample message transferred (encrypted)
Figure 2.3 Bluetooth Packet Capture (Compressed and AES 256 Encrypted). Contents cannot be shown as it is encrypted and compressed
A comparison between the transmitted file with no compression and no encryption versus the file with compression and encryption is detailed in the table below. It
69
shows that the latter includes 124% more than the former, while the gap will be smaller for a larger packet size. This implies that encryption will use more resources. Table 2.4 Packet size comparison with and without encryption. Encryption more than doubles the data size
Bluetooth protocols Bluetooth HCI ACL Packet Data Total Length Bluetooth L2CAP Protocol Length Payload Length (RFCOMM Protocol) Packet Length (OBEX Protocol) Captured Length (bytes)
2.7.4.4
Layers
No Encrypt
Encrypt
Size
Physical
125
287
Increased (%) 130
Data Link Transport Session
121
283
134
116 116 130
277 277 292
95.6 95.6 125
IEEE P11073 PHD Protocol
IEEE 11073 [126] health informatics provides communication of health data exchange between mHealth devices such as sensors, monitoring device and PT at a high level (layer 5-7) as depicted in Figure 2.1 whereas ANT+, ZigBee or BT-LE only provides low-level (layer 1-4) communication protocols in mHealth. IEEE 11073-20601 provides the base standard with exchange protocol to support device specializations such as a pulse oximeter, blood pressure monitor, thermo-meter, weighing scale and glucose monitoring device. It covers the data exchange between the agent (sensors) and the manager (PT) on top of communication protocols such as Bluetooth and ZigBee, however, it does not specify what the manager does with the data transmitted from the agent. Interestingly, it treats the agents (sensors) as a ‘server’ and the manager as a ‘client’, which means that the sensors initiate communication with its manager rather than the manager initiating the communication with the sensors. IEEE 11073 protocols do not address security in their PHD standard documents. PHD standard family mainly focuses on application-level data exchange and hardly provides a method to ensure the security of data exchange rather than providing proper security mechanisms [127]. Instead, the area of security is up to the vendors, who may choose to independently build security mechanisms on top of the P11073 standard. This work group operates under the assumption that security measures are dealt with by lower layers such as secured transport channel. 2.7.5
Conclusion
The threats of mHealth networks have been addressed from a layered approach, taking into consideration some commonly applied and standardised security
70
mechanisms. This section illustrated that the increasing popularity of NSA Suite B Cryptography is trending amongst both the government and private sectors which can also be used by mHealth with Suite E which is modified to suit smaller devices with lower power consumption. IEEE 11073 PHD protocols used by mHealth currently do not address security issues in their PHD standard documents. It is up to the vendors to provide the security implementations. As security threats are present at all layers, it is important that further studies in all layers of protocols are conducted to address the risks of attacks. For example, encryption keys can be embedded into the chipset by the manufacturer to enhance layer 1 security. WBAN and WSN security provide a personal level of security, as opposed to large scale threats in a homogeneous network at the MC and the caregiver’s network. This risk will become even greater if the network combines with other heterogeneous networks to share, process and store collected data. This area is beyond the scope of WBANs and requires an overall approach to designing and implementing network security solutions at the public network service provider’s level. BT-LE is popular in many handheld devices and provides a more robust and cost efficient technology than classic Bluetooth technology. BT-LE consumes much less power as it has sleep mode and uses fewer channels. This aspect is important for mHealth WBANs, as a low energy consumption communication protocol allows for more resources to be dedicated to security related purposes. As reviewed with security mechanisms, communication protocols and algorithms continue to evolve towards focusing on improving energy efficiency such as BT to BT-LE and Suite A/B to Suite E. Low energy consumption will be a core characteristic that will affect the development and security of mHealth technologies. At the same time, the motivation of attacks targeting WBANs may not provide enough justification to implement high standard security measures which increases the battery consumption of sensor devices. Instead, it may be better to utilise the power capacity for enhanced collection and transfer of health information. Furthermore, not everyone will require high security measures such as the general public or in developing countries where people may be more interested with other features such as having reliable access to health services. It is important to provide different levels of mHealth security so that users can choose the level to suit their needs, just as consumers have the right to access better health services at their own will.
71
2.8
CHAPTER SUMMARY
It was found that there have been many works done in the area of sensors, IoT, WSNs, WBANs, mHealth, eHealth, network security, inference logic and system, remote monitoring, network management system, communication protocols, prediction of situation and applications. However, there is very little work which focuses on implementing intelligence on personal sensor networks and its enhancement with intelligence and its integration with IoT, and traffic control of sensor devices when it is overloaded. This chapter reviewed existing works on interfaces between WBANs and IoT, Inference mechanism and prediction analysis in health informatics, and device and data management for network operators viewpoints. Security of mHealth and WBAN has been extensively surveyed as the nature of the solution involves personal privacy which can cause critical issues for personal safety. As the outcome of the literature review, the research questions in section 1.3.2 are created and derived to contributions as shown in Section 1.6.
72
3 INFERENCE SYSTEMS OF DATA PROCESSING This chapter presents the detailed design of the solution of an inference system in sensor nodes utilising information of data requestors and sensor status to discern the priority, validity of data, situation determination for alarming, and data transfer. It includes data processing functions of (1) validation of received data from mHealth users and/or IoT, (2) sampling and sorting of the sensed data, (3) optimisation by removing inconsistent and duplicated data, and (4) analysis of the situation for alarming purposes. Using multiple sensors, vast physiological data are captured and processed to analyse and efficiently reduce the volume of data as the first step of the inference. Various algorithms are applied to the sensed data for experiments, which are analysed and discussed to see how effectively the inference system handles data processing prior to moving forward to next inference phases such as data transmission. The overhead may be caused by the proposed inference instructions in the microprocessor of the sensor, however, it is assumed that the battery consumption of the microprocessor is ignorable as it is subject to programming language and hardware capacity as well as protocols to be used for radio transmission. Therefore, the experiments of power consumption do not include the microprocessors but focuses more on data transmission. Similarly, it is expected to have overhead in sensor nodes with features such as network and device management, measurements, statistics, applications and services. These aspects are design dependant matters, e.g. hardware capacity versus traffic forecasts, and therefore they are not covered in this thesis. It proposes saving battery power by reducing data and frequency of data transmission, which will directly affect radio power consumption, e.g. 25 times of power required when transmitting than receiving data in sensors. Therefore, conserving radio power is key to increasing long battery life [26]. The primary aim of this research is to determine if sensed data can be transferred more efficiently by inferring significant changes in mHealth data. This chapter explains the method for processing data to reduce the data size within sensor nodes followed by optimisation before it transfers to the MC.
73
3.1
INTRODUCTION
In order for a sensor device to transfer data to IoT or mHealth network users, there are two stages required for inference processes including ‘data processing’ and ‘data transmission’. This chapter describes the former, whilst the latter is covered in the next chapter. Inference flow
Data Processing
Data Collection & Creation
Validity check
Check client registration
Set priority level
Check battery level
Collect & infer data
Optimisation & Situation Determination
Data Optimisation
Collect User information
Collect Data Threshold
Optimise situation
Set Situation
Alarm Determination
Check Severity threshold (alarm/normal)
Set alarm level
Set action (discard/notify/ actuate)
Transmit Data
Check frequency of data change
Set transmission interval
Set VR with interval for transmission
Transmit data
End Data Transmission
Figure 3.1 Information flow of Inference system consisting of data processing and data transmission
When a data request is sent to PSDs from the Health or IoT networks, they analyse whether the requestor has been registered as a priority user or whether they are unregistered, e.g. physician or registered IoT device versus a first time user as well as considerations of black listed or white listed requestors. This information is used to set the priority of the requestor such as guaranteed, expedited, best effort and so on. Based on the priority, sensors determine their action on whether to ignore or respond to the requests as well as determining what content to provide. Figure 3.1 shows the processes of data processing and data transmission inference. Sensors capture data and check it against the thresholds table to determine whether they are valid or not before determining a situation as in Table 3.6. When sensed data are beyond the range of pre-defined thresholds, a monitoring device may exclude the sensor to be out of the service in order to save power for other sensors within the
74
device. When there are discrepancies amongst sensed data from different sensors, it needs to optimise this data before transferring them to the requestor. The outcome of previous inferences provides user priority, optimised data, validity of sensed data, alarming, and the content of message for transmission. In order to transmit the data, sensors calculate the frequency of transmission such as immediately or delayed, periodically or with increased intervals, and potentially ignore the request and do nothing if required. Details of this data transmission is discussed in the next chapter. When an alarm has to be raised, the level of alarm should be determined based on an alarm threshold which has been defined by a combination of battery power level, a sensed data threshold and the hardware condition. Even though there is an alarm to be flagged, it may not be transferred to the IoT network for security reasons but to the network operator who can configure their IoT devices not to trigger the sensor for data collection. There are four primary vital signs [128], which are discussed as they are most commonly used by health workers, and three of them excluding blood pressure are used for experiments as they are more readily available for capture by fitness trackers and devices. Even though the vitals are discussed in next subsections, heart rates are mainly used for data creation, capturing, processing and transmission in Chapter 3, 4 and 5. Body temperature and respiratory rates are used in Chapter 5 for activity recognition testing and analysis. To create faulty situations to simulate alarming notification and data optimisation, body temperature is used for simulation as real sensor device cannot create faulty data. Blood pressure is not used as there is no mobile sensor devices to measure and collect blood pressure frequently and regularly. 3.1.1
Blood Pressure (BP)
Normal blood pressure is deemed to be more than 120 over 80 and less than 140 over 90 (120/80-140/90) [129], however, this varies for each user depending on their individual health status. Whilst BP information can be very useful along with other data, it is not practical to capture the data on a second or minute basis during experiments as there does not yet exist a passive device that can measure blood pressure continually. Therefore this data is not used for verification in this project and is regarded as future research.
75
3.1.2
Heart Pulse Rate (HR)
Heart rates vary depending on variables such as age, gender and health conditions, and therefore they need to be considered when customising thresholds for each individual. In general, a maximum heart rate can be calculated by subtracting their age from 220 [130]. The target of walking rate then will be in the range of 50 to 85 percent of the maximum rate. For example, if you are 40 years old, your maximum heart rate would be 180 beats per minute. When walking, you will want to keep that rate between 90 and 153 beats per minute [130]. 3.1.3
Body Temperature (BT)
Human body temperature can vary from very cold, e.g. 26 degrees Celsius for death or 28 for cardiac arrest, up to very hot, e.g. 43 or above for death from the average normal of 37 [131]. Temperature can go up or down regardless of activity or situation, and therefore it should be read with other physiological data when applying an activity recognition algorithm. 3.1.4
Respiration Rate (RR)
The typical respiratory rate for a healthy adult at rest is 12–20 breaths per minute [132], although young and elderly people may have wider ranges. When exercising it usually goes up to supply more oxygen to the tissues and to facilitate greater elimination of carbon dioxide from the body. Table 3.6 shows an example of a customised threshold based on an individual’s personal health condition as prescribed by their physician to determine a situation, which is used for alarming.
3.2
PROBLEM OVERVIEW
Inference systems can be used to address two research questions (Question 1 & 3) in this section out of three research questions proposed in this thesis. Research Question 2 is addressed in Section 4.2 and 5.2. Research Question 1: Is it possible to reduce bandwidth requirements of mHealth sensors while maintaining communication of critical events? Current sensors play a simple role of passively transferring sensed data on a regular basis, or they send the data when a reading/monitoring device makes contact to capture the stored data in the sensors, e.g. pacemakers. When new functions are
76
added, such as an inference system, it may require more resources to be used on devices. This is achieved by programming a simple function in the sensor components consisting of a CPU, memory, storage and I/O ports. When an inference system is implemented within the existing sensor device, it may not accommodate the additional workload and data. Therefore, three approaches may be considered to solve this problem: 1. Expanding the hardware capacity of the sensors. This is achieved from the evolution of hardware design and manufacturing. 2. Sharing the PT resources to handle the inference transactions. This is achieved by app software development to handle sensor functionality in smartphones. 3. Reducing data transmission frequency and its volume. This results in improved/extended battery life which will be achieved by reducing transactions and transmissions. This thesis focuses on Approach #3 to develop an inference system. When a new model of PSD is introduced they come with improved hardware capacity and specifications, such as a faster CPU, additional memory capacity and larger storage. This is to accommodate for additional functions of software. Likewise, sensor devices can be upgraded with more hardware capacity to accommodate more functions such as the inference features. To reduce the transmission frequency, the inference system needs to infer the requestors to apply an appropriate service class (e.g. CoS and QoS) as well as to reduce the battery power consumption which is the ultimate goal of the solution. When a PT has received the data from sensors, it performs three tasks: 1. Processing the data to interact with users through the smartphone app. This is the main role of the PT to interact with the user, who may take further action if required such as transferring it to a third-party to access remote health services. The app is also able to interact with service or network operators for the purpose of network maintenance, upgrading or managing the device. 2. Transferring the data to the requestor immediately. When a requestor sends their requests to sensors there are two ways to receive the response, which is from the sensor directly or from the PT regardless of how the request was sent. An IoT device may communicate with the sensor and/or PT and either the sensor or PT
77
may respond to the device. This requires establishing routing protocols with proper network topology. From the mHealth network, most requests will come through PTs rather than direct contact with sensors. In addition, when wearables are attached to their own smartphone (PT), they may not transfer the response to the IoT device directly. Instead they may send the response to its paired smartphone. 3. Keeping the data for future use. Unless the requesting device requires real-time data such as the past 24 hours of heart rate, a PT may be able to hold the request, not triggering the sensors and halting data transfer to the requestor. Research Question 3: Is it possible to manage duplicated transactions and/or inconsistent data with multiple sensors triggered by the same IoT device? There are various ways to avoid duplication of transferring same data such as assigning sequence numbers and time stamps for each message. Since existing methodologies can be used to solve this problem, this thesis focuses on dealing with inconsistent data and the removal of duplicated sensed data. The inference system analyses the variance of the sensed data against pre-defined threshold measures, and applies an algorithm to optimise the value including validity and adjustment to increase the accuracy and transparency of the data.
3.3
DETAILED DESIGN
This section describes a detailed design of sensor nodes, which are implemented with inference system functionality. As shown in Figure 3.2, there are three major ‘data processing activities that occur: 1. Data collection and creation 2. Optimisation and situation determination 3. Alarm determination
78
Data Collection & Creation
Validity check
Check client registration
Set priority level
Check battery level
Collect & Infer data
Optimisation & Situation Determination
Data Optimisation
Collect User information
Collect Data Threshold
Optimise situation
Set Situation
Alarm Determination
Check Severity threshold (alarm/normal)
Set alarm level
Set action (discard/notify/ actuate)
Figure 3.2 Inference of Data Processing
The Data Collection and Creation process checks the requestor details with their priority and requests frequency of attacking by checking the battery level to determine how to respond. It also applies various formulas to reduce data points using variance rates with sensing intervals. The outcome of the process is a set of data points, which have been selected from the original data sensed by multiple sensors. These data may include inaccurate or inconsistent values (far from the mean value against other sensors) and need to be optimised. The Optimisation and Situation Determination process fine tunes the sampled data to get rid of duplicated and inconsistent data comparing data sensed by other multiple sensors. To determine an alarm, the Situation Determination process utilises user information and pre-set threshold values to determine for an activity whether the sensed data are in the normal ranges or not. Alarm levels are pre-defined based on the user’s prescribed health information by medical professionals. The user’s priority is also used to differentiate priority traffic such as mHealth network. 3.3.1
Data Collection and Creation
The main idea of reducing bandwidth and consequently extend the battery power in sensor nodes is to avoid sampling and transferring of duplicated and nearly unchanged data. Prior to transmitting data to mHealth or IoT networks, they are processed and optimised to be as accurate as possible. When a data request is received in a PSD, it examines whether the data is valid or not. If it is an invalid format, it ignores the request and discards (drops) the packet. If it is valid it checks the requestor’s detail such as registered user status and its priority.
79
In terms of the requestor, there are two main networks which request health data, i.e. mHealth and IoT networks. Requesting devices may have various priorities (class of service) pre-defined by the mHealth and IoT service providers, however, it may be different from the sensor’s registered data even though it is unlikely. It is defined by the network operator when the sensor has been initially configured and maintained. Whilst there is an industrial standard recommendation such as IEEE 802.1p to define class, it is up to the network operator. Table 3.1 is proposed for PSDs’ priority configuration based on Wi-Fi multimedia classification recommended by IEEE 802.1p [133]. Table 3.1 Proposed priority of requestor networks and devices. Priority and service classes are defined by network/service operators
Requestor Networks
Devices
Priority Service Class
Registration
mHealth
Physician (CT)
1
Expedite1
registered
mHealth
Health service provider
2
Expedite2
registered
mHealth
Insurance provider
3
Assured1
registered
Network
registered
mHealth
IoT IoT
Network operator
7
control
IoT service provider
4
Assured2
registered
Network
registered
Network operator
7
control
IoT
Application device1
4
Assured2
registered
IoT
Application device2
5
Best effort
registered
IoT
Application device3
6
Best effort
unregistered
Each priority defines how the request is treated by sensors which analyse and discern the requested data. Service class which can comply with their network operations is defined based on the registration table which identifies requestors, e.g. as physicians or IoT device. The service class levels are subject to the network operator who may have their own levels of classification. In terms of priority, there is another factor to consider. There are two ways of data transmission: Real-time and Store-and-forward. Prior to transmission, it is required to process what data to select for the transmission. Real-time transfer is used for realtime monitoring and actuation by the user’s physician, whilst Store-and-forward can be used for regular data transfer as per a predetermined schedule. Due to its urgent
80
nature, a Real-time transfer has a higher priority than a Store-and-forward transfer, which can be postponed when the network is congested. When a request is received, the inference system will check the requestor for whether it is a legitimate request or whether it is likely to be an attack by checking the frequency of requests from the same source. This process uses identification such as the hardware’s Layer 2 media access control (MAC) lower address part (LAP). To determine the attack, the sensor checks the previous frequency history of the requestor. The frequency rate is defined as shown in Equation 5 below. Frequency Rate A (FR A ) =
Number of Requests made by the same requestor ID , Time duration (T2 − T1) Equation 5 Frequency Rate A
where T2 is the current request time and T1 is the previous request time such as 60 minutes before for instance. For example, when requests have been made by more than a certain value of the Frequency rate A, (e.g. 𝐹𝑅𝐴 = 100 requests/60 minutes), it may be regarded as an attack such as a jamming or a denial of service attack [9] based on the threshold table below. Table 3.2 Frequency of Data requests for inference of requestors
𝑭𝑹𝑨 (No of request/minute)
Status
Action
1 or less than 1
Normal
Transmit
1 to 10
Warning
Send alarm and process the request
More than 10
Attack
Send alarm and discard the request
When the request is determined as legitimate and not an attack, the sensor checks the battery level as the response can be differently set for each priority. Depending on the priority, the sensor determines whether to check the battery status or not. With a low priority and low battery power level, it may not respond to the request so that the remaining power can be reserved for high priority users such as a physician. Table 3.3 shows a user priority and power level to allow data transmission. For example, when the battery has a remaining 10-19%, sensors will not respond to any data requests from unregistered IoT devices. Table 3.3 Battery levels for alarming and User priority, which determines alarm levels and service provision for requestors who may have different priorities in the registration table
Battery level (Bpn)
Bp1
Bp2
81
Bp3
Bp4
Balance
>30%
20-30%
10-19%
VR_0.05*E(n-1),ABS(E(n)E(n+1))>VR_0.05*E(n+1)),E(n),0), where E(n-1) is previous value, E(n) is current and E(n+1) is the next value of E(n) with variance rate (VR) of 5%. Formula 1 Variance Rate Example of 5%
In addition to the VR, duplicated data can be excluded and removed until the last value has been changed. In sleeping mode, it is likely to have the same data without being changed for long period of time for heart rate. Below shows a formula, which can be applied to remove the same data values: =IF(C(n)C(n-1),C(n),NA()), where C(n-1) is previous value and C(n) is current Formula 2 Removal of Duplicated data
Another method for sampling data is to use various different sensing intervals. The interval of sensing time is used to analyse gaps and traits of data including:
82
•
Short interval: sensing every second. This is used for exercise mode
•
Long interval: sensing every minute. This is used for normal (non-exercise) mode
An inference algorithm (as shown in Appendix A8) is applied to reduce the data volume, i.e. through the use of variance rates. Different variance rates such as fine or coarse inferences are used to experiment and decide the best efficiency and accuracy to avoid the data transfer of duplicated or highly similar data as much as possible. This can be further evolved by applying beacons (such as Figure 3.20) – samples taken at set intervals to represent the original data and to counteract the distortion as much as possible. In summary, the following steps are applied to short and long interval sensing. 1. Remove duplicated data points 2. Apply coarse and/or fine inference rates 3. Apply beacons 4. Analyse the results with efficiency and accuracy to determine the best optimisation methods for each requirement Refer to Section 3.4.2 for the detailed approach and a discussion of experiment results. 3.3.2
Optimisation and Situation Determination
As a typical way of attacking in a network is to repeat sending data requests continuously to jam the device or network, the inference system can discern and manage the requests as well as infer what to transfer. Data optimisation process is able to not only get rid of the duplicated/unchanged data but also mitigate inconsistent or faulty data. The Situation determination process guarantees critical information is always transmitted over other traffic. 3.3.2.1
Optimization of Sensed Data
When multiple data by multiple sensors are captured for the same application, e.g. heart rate BPM, it is just sampled data with reduced volumes. Therefore it is required to optimise what data to transfer instead of sending all data which may contain a faulty value as in Table 3.4. The data in this table are arbitrarily created to simulate faulty data as the actual sensor device cannot be induced to create faulty data. The
83
optimised value is used to represent how the attribute locates the overall status of the individual’s health. When comparing data from multiple sensors it may not give much option to discern due to discrepancies as shown in Figure 3.3, which was taken from half an hour of walking while wearing two devices (Fitbit for heart rate and Basis Peak for heart rate and skin temperature sensors3) on the same wrist. This gap could be accounted for by averaging the values from the different data sources. When the number of sensors increases to more than two devices, it becomes more difficult to determine how to handle the data. For example, when sensed data from various sensors for body temperature are different and some of them are inconsistent with the rest of the data, it needs to be inferred to decide whether the specific data should be ignored or used. In the table below, Sensor C in T5 is quite different from other sensed data and it needs to be inferred as being significantly different. (Bolded data are significantly different from other data in Table 3.4 and Table 3.5. Table 3.4 Multiple Sensors for Body Temperature Showing an Example of Discrepant Data Value Readings or Measurement, in Comparison to Other Values
Sensors
Time sensed T1
T2
T3
T4
T5
A
30
38
38
40
35
B
37
36
20
42
36
C
36
36
37
41
17
D
35
45
38
30
38
The average value of T1 is 34.5 and the maximum value of each column in Table 3.5 is calculated using an algorithm to find out the furthest value from the mean using a logic algorithm to determine the distance from the average for each sensed data, as shown in Appendix A6 working out the distance from the average for each sensed data.
3
During the testing, this device recorded hardly any change in the skin temperature, and therefore the temperature values for this physiological attribute are shown as a simulation.
84
Basis Peak
180 160 140 120 100 80 60 40 20 0 15:30 15:31 15:32 15:33 15:34 15:35 15:36 15:37 15:38 15:39 15:40 15:41 15:42 15:43 15:44 15:45 15:46 15:47 15:48 15:49 15:50 15:51 15:52 15:53 15:54 15:55 15:56 15:57 15:58 15:59 16:00
BPM
Fitbit
Time (minutes) Figure 3.3 Data discrepancy between two sensors recording BPM across the same timeframe
Table 3.5 Distance of Each Data Point from the Averaged (mean) Value
Sensor
Time sensed T1
T2
T3
T4
T5
A
4.5
0.75
4.75
1.75
3.5
B
2.5
2.75
13.25
3.75
4.5
C
1.5
2.75
3.75
2.75
14.5
D
0.5
6.25
4.75
8.25
6.5
Thus, each sensed data can have different weightings to reduce the inconsistency of the gap by giving A (10%), B (30%), C (30%) and D (30%) or A (0%), B (20%), C (30%) and D (50%) depending on the defined threshold for instance. The outcome of the inferred data in T1 is now 35.4 (instead of the original mean value 34.5). In the case of T5 column, it is likely that sensor C is malfunctioning as the value has a high discrepancy from the rest. In this case, the weight can be assigned as 0% for this data and the outcome shall be 35.97 instead of 31.5, thus mitigating the influence of the inconsistent data. Figure 3.4 shows the outcome of each sensed data, averaged data and inferred data. As shown in the figure, most data are now in the range of normal human body temperatures, i.e. between 35 and 40 Celsius degree after inferencing using an algorithm, whilst original sensed data fluctuates and the averaged data still remains out of the normal range. The inference algorithm eliminates or reduces the portion of extreme values which are likely to have sensed abnormally or incorrectly. If these values are consistently different from other sensed data it may indicate that the sensor is malfunctioning. If they are instantly different
85
from other data sensed by the same sensor but are similar to other data from other sensors, it implies that the user may have been exposed to a different environment such as entering a cool room. Each attribute along with other information possessed by physicians can also be used to form a different aspect of the health status index such as vitals, obesity, diabetes, arthritis, heart disease and other health conditions.
Figure 3.4 Result of Inference and optimisation for multiple sensors for heart rate monitoring with a few sensed out of the normal range of data
3.3.2.2
Situation Determination
When data are collected, it requires to check alarm status against a prescribed definition for the user. The same data in its normal range (e.g. 160 BPM in running) of the same user can be abnormal depending on the activity of the user (e.g. 160 BPM in sleeping). Depending on the requestor such as a human request or a device request through a WBAN or M2M, the sensor node will wake up when a request arrives as in general, sensors sleep during no transmission of data. The format of the data follows the network protocol specified to carry the data as payload according to existing protocols such as IEEE 11073 PHD.
86
When data are captured by sensors, it calculates the actual value to be used to produce the health status value. As shown in Table 3.6, each data type has its own activity defined by a medical professional. These values are used to determine an activity along with other data types to determine a situation. Table 3.6 Situation determination to define the threshold of the activity from each type of data as recommended by a physician
Data type4
Sleeping
Resting
Walking
Running
BP
33) is one of ‘running’ based on these weightings. These weightings are given arbitrarily, however, they should be defined by physicians or scientists for a particular application. By combining various data, it is possible to determine a situation or activity as the physiological data are related to each other. When a user is running for instance, their heart rate increases, body temperature goes up and respiration rate also rises [134]. Table 3.7 Example of Application Data. Data will result in an inferred value based on the threshold table. The weight is defined based on the attributes and multiplied with the inferred value to result in the points
Data type
Units
BP
Data measurement and calculation Sensed Data
Inferred value
Weight of value
result
Cº
145/100
5.5 (running)
4
22+R
HR
Beat/m
105
3.0 (walking)
5
15+W
BT
mmHg
40
8.5 (running)
2
17+R
RR
Breath/m
20
3.0 (walking)
6
18+W
In order to improve the accuracy of the activity and situation, the existing AR sensors such as an accelerometer can be used together with physiological data. Whilst the AR sensors indicate the status of activity motion such as sitting, standing, walking, running or dancing, they do not show the level of activity such as the degree of tiredness. In addition, the accuracy of the activity relies on the sensor location which can be inaccurate if in a misplaced location. To enhance the quality of content, combining physiological data and AR sensor data can be used to assess the situation. Figure 5.2 shows an example of AR demonstrated using Matlab with an app installed on an Android smartphone. 3.3.3
Alarm Determination
A significant motivation behind mHealth data monitoring is to be able to monitor and alert patients, carers and physicians of a potential health crisis. As such, an alarm system is essential to this project’s design. An alarm notification is generated by sensors which will be transferred to the PT when the battery level of sensor devices is low as shown in Table 3.3 or when sensors are malfunctioning and/or sensed data falls into the alarm threshold as defined in Table 3.8. Table 3.8 Alarm Threshold of Sensed Data suggested by a medical practitioner for a general purpose
Data type
Acceptable
Warning
88
Severe
Critical
Low
High
Low
High
Low
High
Low
High
BP
91
169
90
170
80
185
65
220
HR
51
139
50
140
40
180
32
210
BT
34.1
37.9
34
38
32
40
30
42
RR
11
29
10
30
8
36
6
45
Algorithms to infer alarms are shown as below. Algorithm 1 compares sensed data against the threshold table to determine the range outside of the low and high end of normal data, and decides whether it should flag an alarm with an alarm level. Algorithm 2 determines the battery level and checks requestor’s registration to verify whether they are priority users or not in order to respond. When the battery level is low they may not respond and ignore requests from unregistered users as determined in Algorithm 3. As the alarm situation can include various inputs to be decided, it is further discussed in Section 5.3.3 utilising accelerometer sensors and smartphone app for user feedback system. This enhanced alarming feature significantly increases the accuracy of the alarm determination and reduces false alarm notifications. Algorithm 1 Application threshold for each application attribute for alarming
Algorithm: ALARM Algorithm (application attribute threshold) Input: sensed data f(i) where i = BP(w), HR(x), BT(y), RR(z) at sensed time T(n), where n=1, 2, …k L(v) x A(m): low end threshold, where v = w, x, y, z, and m = alm0, alm1, alm2, alm3 H(v) x A(m): high end threshold, where v = w, x, y, z, and m = alm0, alm1, alm2, alm3 N(v) = normal range of threshold, where v = w, x, y, z Output: status of alarm 1: for L(v) 2:
≤
L(w) then
Set Alarm (i, level=m) else
5: 6:
N(v)
if |f(i)|
3: 4:
≤
Declare_Normal (i, alm0) end
7: end 8: for H(v)
≥
N(v)
89
9:
if |f(i)|
10: 11:
then
Alarm (i, level=m) else
12: 13:
≥ H(w)
Declare_Normal (i, alm0) end
14: end
• BP (w): blood pressure value where w = alarm level. The value is a sensed data value • HR (x): heart rate value where x = alarm level • BT(y): body temperature value where y = alarm level • RR(z): respiration rate value where z = alarm level • L(v): low end threshold • H(v): high end threshold • N(v): normal range of threshold Algorithm 2 Battery power threshold for alarming levels
Algorithm: ALARM Algorithm (battery threshold) Input: requestor priority RP(x) where x = 1, 2, 3, 4, 5 Battery threshold = BT(k), where k=1, 2, 3, 4 Current battery level = BL(p) Output: status of alarm if any 1: if BL(p) 2:
≤ BL(4)
then
Set alarm (x, level=1)
3:
if RP(x) = 1 then
3:
proceed to Allow_func
4:
else
5:
If RP(x) >= 3 then
6:
proceed to Decline_func
7:
else
8:
proceed to Alow_func
9:
end
10:
end
11: else 12: if BL(p) 13:
≤ BL(3)
then
Set alarm (x, level=2)
90
14:
if RP(x) > 2 then
15:
proceed to Decline_func
16:
else
17:
proceed to Allow_func
18:
end
19: else 20: if BL(p)
≤
BL(2) then
21:
Set alarm (x, level=3)
22:
if RP(x) >3 then
23:
proceed to Decline_func
24:
else
25:
proceed to Allow_func
26:
end
27: end
• RP(x): requestor priority where x = priority level defined by registration table. • BT(k): battery threshold where k = battery balance level, e.g. critical, low, medium and high Algorithm 3 Requestor priority based on registration table, which results in priority of users
Algorithm: Requestor priority Input: LAP(x) where x = 1(registered1), 2(registered2), 3(registered3), 4(unregistered1), 5(unregistered2) Setup data: TR(r): Threshold ranges defined Sensed_data(k) Output: user priority 1: if LAP(x) is y then 2:
CoS(y), where y = priority_threshold
3:
if Sensed_data(k)
4:
∈
TR(T) then
proceed to Allow_func
5:
else
6:
if Sensed_data(k)
7:
∉,TR(r)
then
Discard and alarm
8:
end
9:
end
10: end
• LAP(x): requestor ID based on MAC address lower address part. Data type is defined by the network operator
91
• CoS(y): service class level, which is defined by network operator. This is determined by the LAP value against the registration table
3.4
EXPERIMENTS AND EVALUATION
This section describes the tests performed to validate the appropriateness of the data processing as shown in Figure 3.2 and its results, and discusses its evaluation and conclusion. Specifically the following tests are performed: 1. Data types including Body temperature, Respiration and Heart rate 2. Sleep and Walk Monitoring 3. Short and Long Interval All experiments conducted in this chapter as well as in following chapters followed guidelines of the National Statement on Ethical Conduct in Human Research by the Australian Research Council [32]. As according to the guidelines Section 2.1.1 to 2.1.8, health data obtained in these experiments had no risk. 3.4.1
Testing
In order to evaluate the efficiency of data processing, actual health data are sensed and captured using sensor devices. The more transaction is reduced the more battery life is extended. This testing shows how much transaction and bandwidth are saved to assess against the Research Question 1 and 3 presented in Section 3.2 There are two testing methodologies used to generate and capture test data. These include wearables (sensors) to capture sensor data and simulation devices such as Raspberry Pi3 to simulate the data transfer between a cloud server and sensor devices. Testing network topology is depicted in Figure 3.5 and Raspberry ports allocation is shown in Figure 3.6 including a wireless port for Wi-Fi connection, network port for internet, HDMI port for I/O, and USB port for powering the device. The PT interacts with the user to display processed data which is exported from the cloud server. It also collects sensed data from sensors and transfers them to the cloud server, which exports to PC for data mining and processing. These data are used to manipulate and simulate inference algorithms.
92
Sensors include heart rate, body temperature and respiration rate, and cloud server refers to the actual Fitbit and Basis production servers which collect and export sensed data to PTs and the PC. Raspberry Pi3 is used to simulate a sensor which transfers data to the PC to be processed. Requestors’ MAC address is pre-defined in the registration table as in Appendix A3. Internet/Cellular
PC Internet/Ethernet
Cloud server
Wifi
Wifi
Bluetooth
Smartphone
Sensors
Raspberry Pi
Figure 3.5 Test Network Topology for sensed data capture, transfer and export. Cloud servers are in production network provided by Intel and Fitbit, which collects sensed data via the PT and provides export functions to the PC when requested for data processing
Wireless port
Network port
Power USB port
Figure 3.6 Raspberry Pi3 ports configuration
Testing preparation and test execution steps are as below: 1. Testing devices are worn on the wrists of the tester a few days before so that the tester is comfortable with the devices. It requires some learning and trial to wear the device properly for accurate data capture. Data can be partially lost with inaccurate placement, degree of tightness of the straps or the positioning.
93
2. Collect and compare the data collected at the same time and same activity for three days to compare whether the testing devices are consistent. 3. Wear the device for each activity (sleep & walk) for long and short interval settings with minutes, hours and days’ time period. 4. Synchronise the testing device to upload data to the servers. When they are synchronised, there is an acknowledgment message displayed on the device. 5. To obtain and export sensed data from the cloud server, application programming interface (API) commands as in Appendix A1 and A4 are required with a login account specifying the details of data requests including the timestamp and data ranges. The outcome of the request is shown in Appendix A2. Testing is conducted for body temperature, respiration rate and heart rate during exercise (walking) and resting (sleeping) periods. Data are collected based on short intervals (every second) and long intervals (every minute) as determined by device features. During exercise, data are captured on a second basis. Otherwise, they are captured on a minute basis. To see the maximum number of data volume, short interval sensing is set for 24 hours. Various VR is also applied during sampling process to see the nature of data traits and response from inference application such as fine and coarse variance rates. This is also used for analysis of accuracy and efficiency. Test results are shown in this section whilst detailed results analysis are discussed in Section 3.4.2 as it requires calculations and in-depth analysis including efficiency, accuracy and savings rates. The following sections show an overview of actual test and inferred data taken during exercise mode over 45 minutes captured on a minute basis. Further detailed test results for long term observation (24 hours) are analysed and discussed in the discussion section. Testing was conducted by participants from various age groups and gender over the period of 3 months for each activity, and the data have been generated, exported and selected for processing and analysis using different combinations of patterns such as exercising or resting modes, minutes, hours, days or months observations, and short or long sensing intervals. Sensor devices and PTs used in this project are as below:
94
•
Fitbit Charge HR sensors and features: Accelerometer, Gyrometer, always-on heart-rate sensor
•
Basis Peak sensors and features: Motion/steps, Heart rate, Calories, Sleep tracking, Skin temperature
•
Samsung Galaxy Note 4 smartphone
•
Raspberry Pi3
Both the Fitbit and Basis sensor devices use their own production network servers to collect and populate sensed data. To export sensed data from the Fitbit server, a special software has been developed manually6 and used to obtain and process data. 3.4.1.1
Body temperature
Body temperature is a vital sign almost all physicians take for assessment of their patients. The result is shown in Figure 3.7 captured with 45 data points over the exercise period of 45 minutes on a minute-by-minute basis. After having applied the inference algorithm (in Appendix A8) it is inferred and resulted with 11 data points, which gives a savings rate of 75.5%. Body Temperature 37
36.5
36
35.5
35
34.5
34
33.5
33 0
5
10
15
20
25 Original
30
35
40
45
50
Inferred
Figure 3.7 Body Temperature Inference result for exercise mode (real data) on a minute basis. 5% VR inference vs Baseline (Original data)
6
Maple Hill Software (www.mhsoft.com)
95
3.4.1.2
Respiration
Respiration is the 3rd vital sign in the order of vital health measurements desired by physicians in determining a person’s health status in addition to body temperature and heart rate pulse. Respiration results show a 21% savings rate with 38 original data points resulting in 30 data points after inferencing as shown in Figure 3.8. Compared to other data, e.g. body temperature, the inferred result is very close to the original data as the savings rate is reasonably smaller than other cases. Respiration 50 45 40 35 30 25 20
15 10 5 0 1 2 3 4 5 6 7 8 9 10 11 12 13 14 15 16 17 18 19 20 21 22 23 24 25 26 27 28 29 30 31 32 33 34 35 36 37 38 Original
Inferred
Figure 3.8 Respiration Inference result for exercise mode (real data)
3.4.1.3
Heart rate
As the heart rate data can be captured the most within a certain timeframe among the vital signs, it is the most commonly used for testing and analysis. Therefore, most of devices provide heart rate sensors equipped within. This thesis mainly uses heart rate for the rest of testing for the same reason (easiness and data volume to process). During 24 hours, a total of 1420 data points were sensed and processed for various inference rates including 2.5%, 5%, 10% and 20% variance rates as shown in Figure 3.9, which are calculated as per the example in Appendix A5.
96
Variance Rate 180
160
160
140
140
120
120
100
100
80
80
60
60
40
40
20
20
0
0 0 3 6 9 12 15 18 21 24 27 30 33 36 39 42 45 48 51 54 57 60 63 66 69 72 75 78 81 84 87 90 93 96 99 102 105 108 111 114 117 120
180
10% VR
20% VR
Original
2.5% VR
5% VR
Figure 3.9 Various Inference VR (variance rate) applied to process HR data result for exercise mode
3.4.2
Discussion
Evaluation approach includes three aspects. Firstly, two test modes and results are discussed including resting (sleeping) and exercising (walking) modes mainly utilising heart rate samples as the nature of data fluctuations and variance are quite different between them. Secondly, short (seconds) and long (minutes) intervals of sensing time are used to analyse gaps and traits of data. Finally, fine and coarse inference algorithms are applied to show the differences and efficiency of each case. 3.4.2.1
Variance rates (VR)
Variance rates (VR) are used along with the algorithm as shown in Appendix A8 and formulas in Section 3.3.1 to infer data selection and transmission by comparing the current data point with before and after the value (or adjacent values) to screen out similar data points, and therefore the data points which can be saved from transmission. Different VRs can be applied with finer or coarser rates, e.g. 1% VR is finer than 5% VR. It can be applied using the formula below. If |Vc − Vc1|OR|Vc0 − Vc|)> Vc × Vr, Then Vx = Vc Else Vx = Nil, where Vc = current value, Vc0 = previous value, Vc1 = next value, Vx = sampling value and VR = variance rate Formula 3 Variance Rate application with adjacent (before/after) data points comparison
97
When a variance rate has been applied and plotted against the original graph, there are differences between the inferred data graph and the original data graph as shown in Figure 3.10. 𝑆𝑢 represents the area of gap or distorted portion by the inferred values that are less than the original, whilst 𝑆𝑙 represents areas of inferred values that are higher than the original values. The higher the total area of gaps means there is more distortion and therefore it is better to have a lower total area if accuracy is concerned. The formula below depicts the area of upper and lower sides of the inferred graph against the original. n
Su = ∑
(nk)Sn , where Sn = G (S1, S2, ..., Sn)
k=0
Equation 6 High end gap areas
𝑛
Similarly𝑆𝑙 = ∑
𝑘=0
(𝑛𝑘)𝑆𝑛 , where 𝑆𝑛 = Y (S1, S2, ..., Sn)
Equation 7 Low end gap areas
Total area of the gaps would be presented as below. A larger value means a ‘coarser’ and higher VR inference has been used relative to a smaller total area which means that a ‘finer’ and lower VR value has been applied. When the difference (𝑆𝑑 = |𝑆𝑢 − 𝑆𝑙 |) is larger, that means the result is farther from the average, and therefore the smaller the difference, the better it represents the original trend. However, a smaller difference does not necessarily mean that it always represents the original properly, but can be an indicator of how accurate the inference is to the original along with using the total gaps (𝑆) instead. For example, a small 𝑆 value as well as a small 𝑆𝑑 means it is likely to be closer to the original. Therefore these figures (i.e. 𝑆and 𝑆𝑑) can be used to determine how accurate each inference is as the result, whilst savings or reduction of DPs indicate the efficiency. If 𝑆= 0, it represents the original data perfectly with no distortion. If 𝑆𝑑 = 0, it means the inference represents the mean value of the graph despite not representing the original perfectly. S = Su + Sl Equation 8 Area of difference between original and inferred data
Figure 3.10 depicts the upper and lower gaps after inference has been applied.
98
S (Upper)
S (Lower)
Figure 3.10 Differences between the original and inferred value
There is a dilemma when a finer VR is applied to short interval samples (e.g. captured every second) as short interval data points (DPs) do not fluctuate greatly. For example, heart rate during sleep or resting mode hardly varies by more than 10 points between DPs sensed every second. As the VR compares the current value with adjacent values before and after the current value, it will not take the sample when the DPs being compared fluctuate in a small linear fashion, e.g. rising consecutively from 120, 121, 122, 123, 124 etc. This means that if HR changes from 120 to 150 over 30 seconds incrementally by 1 BPM per second, the inference will not display the increase to 150 DP at all as each increase in the value is less than the VR threshold specified. To solve this dilemma, a different method should be applied such as adding beacon DPs, which take data at a set frequency regardless of how much it varies in order to maintain representation of the original DPs. Results show that the data points obtained after the inference algorithms have been applied are significantly reduced as in Table 3.9. Whilst the data with 2.5% and 5% Variance rate (VR) applied can be reasonably close to the original samples, other data are not useable as shown in Figure 3.9 which is the outcome of heart rate data samples being captured on a minute-by-minute basis over two hours. In the case of 2.5% VR, data savings are more than 50%, which means that the number of data to process for transmission have already been halved before entering the process of data transmission inference. The accuracy for each VR should be checked and verified by the requestor to see whether the data are useable and valid for their purpose. Some IoT service providers may not need the exact HR value and may instead accept an averaged mean value over each hour, whilst healthcare providers and/or physicians may require all data points for each minute. Thus it remains a design requirement on how to define the acceptable accuracy as in the table below. Figure 3.11 depicts the differences between 2.5% and 5% VR against the original data with 70 data points.
99
It also shows that gaps mainly occur during significant heart rate changes, e.g. for running (e.g. data point ID 8-24), however, not during consistent activities (e.g. data point ID 54 – 62). It also shows the differences of VR applied to Heart rate results. From a total of 71 data points, this was reduced to 55 using 2.5% VR and to 29 using 5% VR. Savings rates are 22.5% and 59.2% respectively. As shown below, the gap increases with the higher degree of the graph. Table 3.9 Data savings for various VR for 24 hours samples
Variance rate
0%
Data points
2.5%
5%
10%
20%
1420 691
306
146
17
Savings (%)
N/A
51.3
78.5
89.7
98.8
Accuracy (%)
N/A
99.3
97.0
93.7
74.6
𝑆𝑢: S(upper)
N/A
347 (50%)
1531 (48.8%)
2790
5125 (19.1%)
(41.8%) 𝑆𝑙 : S(lower)
N/A
347 (50%)
1608 (51.2%)
𝑆: 𝑆𝑢 + 𝑆𝑙
N/A
694
Accuracy
N/A
Very Good Good &
results
3139
3883
21765
(58.2%)
(80.9%)
6673
26890
Poor
Unusable
Useable
When 𝑆𝑢 is more than 50%, then the inference has undervalued the original, where the values are measured with the summation of differences against the original values, and accumulated to compare with the differences. In other words, the sampled value is less than the original DP. In the case of 20% VR in Table 3.9, the result shows that accuracy (74.6%) is poor despite savings (98%) being high. In addition, it is distorted considerably (26.4%) against the original graph.
100
Comparison of 2.5 and 5% VR Original
2.5% VR
5% VR
160
140 120
100 80 60 40 20 0 0 2 4 6 8 10 12 14 16
18 20 22 24 26 28 30 32 34 36 38 40 42 44 46 48 50 52 54 56 58 Original 60 62 64 66 68 70
Figure 3.11 Comparison of different VR for HR (BPM). Gaps between the original and each VR applied depicts the differences, e.g. more gaps during stable period (54 to 64 minutes data points)
Inference level and variance rate can be applied based on design requirements as requestors may have a differing range of what is considered to be an acceptable threshold. Results for body temperature increase reasonably linearly and has a short delay before it drops after exercising whilst respiration rate drops quickly almost immediately after exercising has stopped. Heart rate fluctuates with a larger range than body temperature and respiration rate. It is also sensed at a higher time frequency, whereas vital signs such as body temperature and respiratory rate are sensed on a minute-by-minute basis. Detailed analysis of data are discussed in the following sections including; • Stable and fluctuating cases, e.g. sleep and walk monitoring • Short and long interval of sampling data • Fine and coarse inference level The following depicts a proposed algorithm to evaluate the result of data processing inference result to calculate assessment measurements. Accuracy is a key measurement along with efficiency in these experiments, as the algorithm contains how to calculate the accuracy utilising gaps between the original and inferred values.
101
When 𝑆𝑢 =0 and 𝑆𝑙 =0, that means there is no gap between the original and inferred data. Algorithm 4 Evaluation Algorithm of Data Processing Results
Algorithm: Evaluation Algorithm (calculation of efficiency, savings rate and accuracy) Input: original data f(i) where i = BP(w), HR(x), BT(y), RR(z) at sensed time T(n), (n=1, 2, …k) s(j): inferred data value Su: area summation of original area above inferred values. Suk ∈ Su, where Suk
=
{Su1, Su2, ..., Sun}
Sl: area summation of original area below inferred values. Slk ∈ Sl, where Slk
=
{Sl1, Sl2, ..., Sln}
S: total summation of area Su and Sl Sd: difference of Su and Sl. Sd = ABS (ABS(Su) – ABS (Sl)) DPs: total number of inferred data points DPf: total number of original data points DPr: DPf - DPs Output: status of alarm 1: for g(x) = f(i) 2: if S(j) is positive, then g(x) = Su 3:
else
4:
g(x) = Sl
5:
end
6:
if Su and/or Sl exists
7:
Accr = (ABS (Su) + ABS (Sl))/(SUM of f(i))*100
8:
Effi = (DPf – DPs)/DPs
9:
Savi = (DPf – DPs)/DPf
10:
end
11: end
•
𝑆: Area of gaps between the original and inferred values. This determines the quality of efficiency, where S = 0 implies 100% of the data are transmitted.
•
𝑆𝑢: Gaps between the original value and inferred value with positive result values. This implies that the inferred value is lower than the original and vice versa for 𝑆𝑙 .
•
𝑆𝑙 : Gaps between the original value and inferred value with negative result values. This implies that the inferred value is higher than the original.
102
•
𝑆𝑑: Gaps between 𝑆𝑢 and 𝑆𝑙 . Smaller value means that it is inferred close to the mean value of the original values.
•
DPx: Total number of data points to calculate efficiency rate
•
f(i): Each data point value of the original sensed data
•
s(j): Inferred data point value. Sx are calculated by difference between f(i) and s(j), and g(x) implies the graphic of 𝑆𝑢 and 𝑆𝑙 .
3.4.2.2
Sleep monitoring with long interval sensing (minutes)
When capturing data, some sensors may not capture data properly due to an incorrect placement of the device. As shown in Figure 3.12 for sleep monitoring data over one night, sensor device 1 did not capture data over the ‘A’ period, whilst sensor device 2 did not capture during periods of ‘B’, ‘C’ and ‘D’ as labelled on the graph. This may be a potential cause of alarm raising and notification for mHealth services when monitoring in real-time. To avoid the alarm, a PSD can average values from both data as in Figure 3.13, which can also be used for inferring process. Having applied a 1% and 2.5% of inference rate to reduce the number of transactions for body temperature and heart rate respectively, the volume of data to be transferred reduced by 76% for BT and 73% for HR. These results are shown in Figure 3.14 and depicts HR and BT sensed on a minute basis. BT inference shows better results representing almost identical data as opposed to HR. In other words, the savings rates are similar for BT and HR, however, the accuracy rates are very different.
103
23:01 23:05 23:09 23:13 23:17 23:21 23:25 23:29 23:33 23:37 23:41 23:45 23:49 23:53 23:57 0:01 0:05 0:09 0:13 0:17 0:21 0:25 0:29 0:33 0:37 0:41 0:45 0:49 0:53 0:57 1:01 1:05 1:09 1:13 1:17 1:21 1:25 1:29 1:33 1:37 1:41 1:45 1:49 1:53 1:57 2:01 2:05 2:09 2:13 2:17 2:21 2:25 2:29 2:33 2:37 2:41 2:45 2:49 2:53 2:57 3:01 3:05 3:09 3:13 3:17 3:21 3:25 3:29 3:33 3:37 3:41 3:45 3:49 3:53 3:57 4:01 4:05 4:09 4:13 4:17 4:21 4:25 4:29 4:33 4:37 4:41 4:45 4:49 4:53 4:57 5:01 5:05 5:09 5:13 5:17 5:21 5:25 5:29
23:01 23:05 23:09 23:13 23:17 23:21 23:25 23:29 23:33 23:37 23:41 23:45 23:49 23:53 23:57 0:01 0:05 0:09 0:13 0:17 0:21 0:25 0:29 0:33 0:37 0:41 0:45 0:49 0:53 0:57 1:01 1:05 1:09 1:13 1:17 1:21 1:25 1:29 1:33 1:37 1:41 1:45 1:49 1:53 1:57 2:01 2:05 2:09 2:13 2:17 2:21 2:25 2:29 2:33 2:37 2:41 2:45 2:49 2:53 2:57 3:01 3:05 3:09 3:13 3:17 3:21 3:25 3:29 3:33 3:37 3:41 3:45 3:49 3:53 3:57 4:01 4:05 4:09 4:13 4:17 4:21 4:25 4:29 4:33 4:37 4:41 4:45 4:49 4:53 4:57 5:01 5:05 5:09 5:13 5:17 5:21 5:25 5:29
120
Sleep Monitoring
100
80
60
40
A B C
Sensor 1
D
20
0
Sensor 1
104
Sensor 2
Figure 3.12 Sleep monitoring with multiple sensors on a minute basis showing lost data sections, e.g. Sensor 1 lost (A) and Sensor 2 (B, C & D), which needs to be inferred
120
Averaged Sleep Monitoring
100
80
60
40
20
0
Sensor 2 Avg HR
Figure 3.13 Averaged sleep monitoring data on a minute basis after inference to fill the gaps from the data loss
Inferred Sleep Monitoring 40
120
35 100
30 80
25
20
60
15
0
Heartrate (BPM)
1 5 9 13 17 21 25 29 33 37 41 45 49 53 57 61 65 69 73 77 81 85 89 93 97 101 105 109 113 117 121 125 129 133 137 141 145 149 153 157 161 165 169 173 177 181 185 189 193 197 201 205 209 213 217 221 225 229 233 237 241 245 249 253 257 261 265 269 273 277 281 285 289 293 297 301 305 309 313 317 321 325 329 333 337 341 345 349 353 357 361 365 369 373 377 381 385 389
20
Temperature (Celsius)
40
Avg HR (391 dp)
Inferred HR (103 dp)
BT (368 dp)
10
5
0
Inferred BT (88 dp)
Figure 3.14 Inferred HR and BT of sleep monitoring data on a minute basis. Whilst BT represents the original well, HR results shows gaps. This can be improved by applying beacons
3.4.2.3
Walk monitoring with long interval sensing (minutes)
During exercising (walking) to simulate a situation of fluctuating data, four sensors are used including 2 HR, BT and GSR (Galvanic Skin Response) over the course of 70 minutes. As shown in Figure 3.15, HR BPMs fluctuate until they go down at the end of the exercise while BT slowly increases even after the exercise. This is because the nature of the data react differently to the conditions. As usual, BT varies slowly and GSR does not even show any sign of data variation until towards the end of the exercise. HR reacts quickly even within a second as it usually beats above 100 BPM during the period. Before applying inference algorithms, the HR data are averaged as shown in Figure 3.16. After having applied the inference, reduction rates resulted in 45%, 66.2% and 40.8% for HR, BT and GSR respectively. Again, BT and GSR after inference are represented almost identically to the original data, whilst HR data show some gaps in between due to the nature of the HR data, i.e. varies with short intervals. Therefore, it is required to analyse HR data with short intervals which is discussed in the following sections. The results are summarised as below. Table 3.10 Summary of Minute-by-minute Walk Monitoring
Averaged HR (Sensors 1 and 2)
BT
GSR
Data points
71
71
71
Inferred
39
24
42
105
Savings (%) Accuracy (%)
45
66.2
40.8
99.98%
99.99%
99.3%
Figure 3.15, Figure 3.16, Figure 3.17
Figures
Heartrate (BPM)
Walking 140
35
120
30
100
25
80
20
60
15
40
10
20
5
0
0
Sensor 1 (B)
Sensor 2 (F)
BT
GSR
Figure 3.15 Original data of Walk monitoring with long interval (minutes) sensing (2x HR, BT and GSR sensors)
Heartrate (BPM)
Walking Average 140
35
120
30
100
25
80
20
60
15
40
10
20
5
0
0
Sensor 1 (B)
Sensor 2 (F)
Averaged HR
BT
GSR
Figure 3.16 Averaged HR from two HR sensors to be ready for inference. BT and GSR results can be used along with HR for analysis of activity when required
106
Heartrate (BPM)
Inferred Walk Monitoring 140
35
120
30
100
25
80
20
60
15
40
10
20
5
0
0
Averaged HR (71 dp)
Inferred HR (39 dp)
BT (71 dp)
Inferred BT (24 dp)
GSR (71 dp)
Inferred GSR (42 dp)
Figure 3.17 Inferred Walk monitoring after having applied the inference. It shows that resultant data points were reduced by the inference
3.4.2.4
Sleep monitoring with short interval sensing (seconds)
Whilst exercise modes generate fluctuating data variance, sleeping may generate stable and low variance over the normal sleeping hours. In this case, simply removing same consecutive data can reduce the volume of data a lot (82.8% of data reduction) as shown in Figure 3.18, which still reasonably represents the original data, and this can be used as a baseline for further inferences. Figure 3.19 shows fine inference without beacon DPs and the graph is quite rough. When having applied beacon DPs with 10 minutes interval (Figure 3.20), it improves a lot even though the beacon interval is quite rough (38 only). This implies that beacon DPs are important for low variance data over the long period as they hardly change and inference only without guidance from these beacons may not properly represent the original data. In the case that a very high level overview of the data is required, beacon DPs may be sufficient as shown in Figure 3.21. In this case, 99.5% of data reduction is achieved. In other words, only 0.5% (or 200 times of efficiency rate) of the original data are transferred to meet the requirements. For the purpose of comparing the quality of fine and coarse inferences, colour codes can be used to see the differences. When a fine inference algorithm is applied, the results plot a similar graph as the original data, however, there are still large gaps present as shown by the arrow in Figure 3.22. When a coarser inference algorithm is applied, there are both original and inferred colours appearing with some gaps
107
(indicated by the arrow) over the longer period of time as compared to the fine inference samples (Figure 3.23). When comparing the colours of both cases, the coarse inference shows gaps between the original and inferred colours, whereas the graph comparing the original with the fine inference samples show a relatively single colour implying a reasonable concordance i.e. little gaps. Figure 3.24 shows the outcome of fine inference with beacons applied, and is better than those with nonbeacon DPs applied as in Figure 3.22 and Figure 3.23. As the results of data reduction with savings rate for each inference scenario in Table 3.11 show, more data reduction (approximately over 90%) is achieved in sleep monitoring as they hardly fluctuate over a long period of time. Thus, the steps below can be applied to select the level of inference desired. • Step1: remove the same consecutively sensed data from the original (BL1 7 ). Resulted in BL2 as shown in Figure 3.18 • Step2: apply coarse inference algorithm against BL2 (Note: Figure 3.23 shows the result of applying to BL1) • Step3: apply coarse inference with beacons against BL2 (Note: Figure 3.24 shows the result of applying to BL1 and beacons of Figure 3.21) • Step4: apply fine inference algorithm on BL2 (result shown in Figure 3.19). Figure 3.22 shows the result against BL1. • Step5: apply beacon on fine inference data from step4 (result shown in Figure 3.20) Table 3.11 Summary of Second-by-second Sleep Monitoring Original
Beacon
(BL1)
Removed
Fine
Fine
Fine
Coarse(3%)
3%+beacon
duplication
(0.8%)
(0.8%)
with
baselined
Baselined
(BL2)
baselined
baselined
beacon
with BL1
with BL1
with BL1
with BL2
DP
7592
38
1308
1308
69
107
483
513
Savings
N/A
99.5
82.8
82.8
99.1
98.6
93.6
93.2
N/A
95.0
99.99
99.99
94.8
95.7%
98.59
98.62
N/A
Figure
Figure 3.18
Figure 3.22
Figure 3.19
Figure
Figure 3.23
Figure 3.24
(%) Accuracy (%) Figure
3.21
7
3.20
BL: based lined data for inference
108
1 96 191 286 381 476 571 666 761 856 951 1046 1141 1236 1331 1426 1521 1616 1711 1806 1901 1996 2091 2186 2281 2376 2471 2566 2661 2756 2851 2946 3041 3136 3231 3326 3421 3516 3611 3706 3801 3896 3991 4086 4181 4276 4371 4466 4561 4656 4751 4846 4941 5036 5131 5226 5321 5416 5511 5606 5701 5796 5891 5986 6081 6176 6271 6366 6461 6556 6651 6746 6841 6936 7031 7126 7221 7316 7411 7506
1 96 191 286 381 476 571 666 761 856 951 1046 1141 1236 1331 1426 1521 1616 1711 1806 1901 1996 2091 2186 2281 2376 2471 2566 2661 2756 2851 2946 3041 3136 3231 3326 3421 3516 3611 3706 3801 3896 3991 4086 4181 4276 4371 4466 4561 4656 4751 4846 4941 5036 5131 5226 5321 5416 5511 5606 5701 5796 5891 5986 6081 6176 6271 6366 6461 6556 6651 6746 6841 6936 7031 7126 7221 7316 7411 7506
120
Short Interval Sensing (Removed duplication)
100
80
60
40
20
0
Original Original (Removed duplication)
Figure 3.18 Duplication removed (original DP: 7592, inferred DP: 1308). It significantly reduces data points whilst still representing the original fairly well
120
Short Interval Sensing (Removed duplication with fine inference)
100
80
60
40
20
0
Original (Removed duplication) Fine Inference (Removed duplication)
Figure 3.19 Fine inference applied (baseline DP: 1308, inferred DP: 69). Results show a large saving in data points however, compromises by showing a rough graph due to using baseline 2
109
1 130 259 388 517 646 775 904 1033 1162 1291 1420 1549 1678 1807 1936 2065 2194 2323 2452 2581 2710 2839 2968 3097 3226 3355 3484 3613 3742 3871 4000 4129 4258 4387 4516 4645 4774 4903 5032 5161 5290 5419 5548 5677 5806 5935 6064 6193 6322 6451 6580 6709 6838 6967 7096 7225 7354 7483
1 95 189 283 377 471 565 659 753 847 941 1035 1129 1223 1317 1411 1505 1599 1693 1787 1881 1975 2069 2163 2257 2351 2445 2539 2633 2727 2821 2915 3009 3103 3197 3291 3385 3479 3573 3667 3761 3855 3949 4043 4137 4231 4325 4419 4513 4607 4701 4795 4889 4983 5077 5171 5265 5359 5453 5547 5641 5735 5829 5923 6017 6111 6205 6299 6393 6487 6581 6675 6769 6863 6957 7051 7145 7239 7333 7427 7521
Short Interval Sensing (Removed duplication with fine inference and beacon)
120
100
80
60
40
20
0
Original (Removed duplication) Fine Inference (Removed Duplication) with Beacon
Figure 3.20 Fine inference and beacon applied (baseline DP: 1308, inferred DP: 107). Adding beacons corrects the roughness
120
Short Interval Sensing (beacon)
100
80
60
40
20
0
Beacon (every 10 minutes)
110 Original Beacons
Figure 3.21 Beacons (long interval) without inference algorithm still represent the original without much distortion
Short Interval Sensing (Fine inference) 120
100
80
60
40
20
0 0
1000
2000
3000
Original
4000
5000
6000
7000
8000
Fine Inference
Figure 3.22 Fine inference without beacon (original DP: 7592, inferred DP: 1308). Much improved when utilising the original baseline 1
Short Interval Sensing (coarse inference) 120
100
80
60
40
20
0 0
1000
2000
3000
Original
4000
5000
6000
7000
8000
Coarse Inference
Figure 3.23 Coarse inference without beacon (original DP: 7592, inferred DP: 483). It shows distortion without beacons. Arrow shows data distortion when compared to Figure 3.22
111
Short Interval Sensing (coarse inference with beacon) 120
100
80
60
40
20
0 0
1000
2000
3000
Original
4000
5000
6000
7000
8000
Coarse Inference (With beacon)
Figure 3.24 Coarse inference with beacons (original DP: 7592, inferred DP: 513). It improves a lot by applying beacons in comparison to Figure 3.23
3.4.2.5
Walk monitoring with short interval sensing (seconds)
When sensor data are monitored at short intervals, e.g. every second, the inference system may discard data as adjacent data points may be similar and do not reach the VR threshold. Thus this may cause distortion from the original despite it varying significantly over a longer period of time. This can be improved by adding beacons to transmit data regardless of meeting the VR threshold, and to maintain the inference as close as possible to the original data. Beacon data points are defined as once a minute in these experiments as shown in Figure 3.15, and by itself cannot represent the original data accurately as it has 59 seconds of gaps in between. Finer inference VRs may be more accurate, however, it results in more DPs, which means there is a lower efficiency rate from the perspective of data transmission. Sometimes they do not require accurate figures but a ballpark figure only, in which case a coarse inference method can be used. Figure 3.28 shows 140 DPs out of 1806 resulting in a data reduction of 92.2%. This may be sufficient enough for a physician to quickly scan HR BPMs during 70 minutes of exercise as 140 DPs can reasonably represent the original data. However if they require finer and more accurate samples, beacon DPs can be added to improve the accuracy as shown in Figure 3.29. The results are summarised as below. Table 3.12 Summary of Walk Monitoring with Second
Origi
Beacon
Fine Infer
nal
112
Fine Infer +
Coarse
Coarse +
beacon
Infer
beacon
Data points
1806
70
450
498
140
204
Savings (%)
96.1
75
72.4
92.2
88.7
Accuracy
97.4
98.9
99.4
94.2
98.2
Figure 3.25
Figure 3.26
Figure 3.27
Figure 3.28
Figure
(%) Figures
3.29
Walking Short Interval Sensing with Beacons 140
120
100
80
60
40
20
0 0
200
400
600
800
Original
1000
1200
1400
1600
1800
2000
Beacon (every minute)
Figure 3.25 Short interval with beacons added (original HR DP: 1806, 70 beacons)
Walking Short Interval Sensing (Fine Inference) 140
120
100
80
60
40
20
0 0
200
400
600
800
Original
1000
1200
1400
1600
1800
Inference (Fine)
Figure 3.26 Short interval with fine inference (original DP: 1806, inferred DP: 450)
113
2000
Walking Short Interval Sensing (Fine Inference with Beacons) 140
120
100
80
60
40
20
0 0
200
400
600
800
Original
1000
1200
1400
1600
1800
2000
Fine Inference (With beacon)
Figure 3.27 Short interval with fine inference and beacons (original DP: 1806, inferred DP: 498). Applying beacons improves the results significantly with a minimal addition of DPs
Walking Short Interval Sensing (Coarse Inference) 140
120
100
80
60
40
20
0 0
200
400
600
800
Original
1000
1200
1400
1600
1800
2000
Inference (Coarse)
Figure 3.28 Short interval with coarse inference (original DP: 1806, inferred DP: 140). Data are distorted a lot without beacons
114
Walking Short Interval Sensing (Coarse Inference with Beacons) 140
120
100
80
60
40
20
0 0
200
400
600
800
Original
1000
1200
1400
1600
1800
2000
Coarse Inference (With beacon)
Figure 3.29 Short interval with coarse inference and beacons (original DP: 1806, inferred DP: 204). Adding 100 DPs of beacons improves the results with coarse inference reducing approximately 60% of data as compared to the fine inference
3.4.2.6
Power consumption
Battery power consumption in a sensor node is the biggest constraint in WBANs. It has three aspects including (1) energy for the sensor transducer, (2) energy for communication among the sensor nodes and (3) energy for microprocessor computation [135]. Xia [136] demonstrated that the required power for transmitting one bit of data in WBANs is equal to the required energy of processing 800 to 1000 instructions. In other words, power consumption for internal computation is almost nothing as compared to the power required for transmission. In the case of MICA motes sensors, it comes with 512kB of flash memory to hold data with 10 bit A/D converter for sensor data digitization. Its radio consumes most of its battery power and when it is switched off, the radio consumes less than one micro amp. When receiving data, it consumes 10 milliamps. When transmitting, it consumes 25 milliamps [26]. Not to mention, conserving radio power is key to long battery life. In other words, transmitting consumes 25000 times the power of standby (receiving >10000x standby). Applying this figure onto the testing data with a 1kB sized file transfer, it transmits it by approximately 170 packets with 25 milliamps per transmission resulting in 2090 milliamps to exchange packets for the transmission of a single data point as it requires communication establishment over Wi-Fi for example. A typical AA battery produces about 1000 milliamp-hours [26] and this means this transmission consumes
115
more than 8 AA batteries. Therefore it has significant savings when reducing the transmission transactions from 1420 to 306 in Table 3.9, which gives a saving of 78.5%. Refer to Section 4.4.2.2 for a detailed discussion of bandwidth and power savings. 3.4.3
Conclusion
Various test scenarios are performed for experiments including resting and exercise modes, short and long interval, fine and coarse VR for inferencing. Test results are summarised in Table 3.13 below which shows the result of data reduction for those scenarios. Generally, a higher data savings implies a better efficiency, and a lower accuracy. This result can be compared with before applying the inference. As there is no existing idea of reducing data volume and transmission frequency, this result cannot be compared with other generic methods. Therefore the outcome of the inference needs to be assessed by an experimental method with the suggested measurements including efficiency and accuracy. With these results, it is possible to satisfy the questions below. Relating to Research Question 1: Is it possible to reduce bandwidth requirements of mHealth sensors while maintaining communication of critical events? The system described in Chapter 3 is capable of handling more functionality. This is due to data savings on average of 45%, which means that the data volume can be reduced by 45% with a 99.98% accuracy to remain representative of the original data as shown in Table 3.13. This means that applying the inference can save resource capacities by 45% as the size of data directly affects the resources such as bandwidth and battery power. Relating to Research Question 3: Is it possible to manage duplicated transaction and/or inconsistent data with multiple sensors triggered by the same IoT device? The process of removing unchanged data shows significant data reduction with 82.8% savings and over 99% accuracy rate as shown in Table 3.11 and Figure 3.18. During the data reduction process, duplicated data are screened as it is unnecessary for these values to be transferred. Inconsistent data are also adjusted and optimised to reflect
116
inference process effectively so those inconsistent data are not included in the calculation. Table 3.13 Results of data reduction process inference
Test data
Walk minute
Sleep minute
Walk second
Sleep second
Mode
Exercise
Rest
Exercise
Rest
Interval
Long interval
Long interval
Short
Short interval
interval Efficiency
1.8
3.8
8.8
14.7
Savings (%)
45
73.6
88.7
93.2
Accuracy
99.98
99.1
98.2
98.62
(%)
3.5
CHAPTER SUMMARY
There major inferences occur in data processing as shown in Figure 3.1, which discern whether the requestor is from the mHealth or IoT network in order to set user priority. Consequently, sensors decide what information to transfer with different priorities to manage and control the bandwidth and battery power savings. Testing results show that transactions can be reduced by up to 96% (or more for sleep monitoring). In other words, only 4% of sensed data can be transmitted by the result of the inference process, meaning that battery life can be extended by up to 25 times (efficiency rate of 25.2 as shown in Table 4.4). This depends on what inference level has been applied. Based on the requestor inference process, a quality of service is determined. Sampling interval affects the quality of data and there are significant differences to consider between the sampling intervals, that is, data obtained per second are 60 times the volume of data obtained per minute. Furthermore, beacons play a key role in optimizing data as it provides a framework of the data shape. Sometimes, beacon DPs alone can be good enough to represent the original data. In case of short interval data, removing duplications can be quite useful to reduce the original data and can be used as a baseline itself for further inferences. Also, the sensing interval can be significant for sensible cases. Figure 4.9 shows a spike which is not captured by the minute sampling data for instance. In conclusion, testing has verified that inferring data reduction saves bandwidth and battery power significantly.
117
4 INFERENCE SYSTEMS OF DATA TRANSMISSION This chapter is continued on from Chapter 3 to present inference systems for ‘data transmission’. After sensed data have been processed with inferencing, it is required to transfer them to mHealth or IoT network requestors. This chapter describes how to infer and transmit to reduce the transactions and traffic where available based on analysis of collected and processed information in sensors.
4.1
INTRODUCTION
As battery power is heavily consumed during data transmission, it is critical to minimise the frequency of transmission where possible in order to preserve the bandwidth and battery resources for priority traffic such as mHealth users. In addition to the reduced samples produced by Data Reduction process, it can eliminate transferring frequency when the data have not changed significantly when compared to the previous sensed data such as in sleeping. Figure 4.1 depicts the flow of the procedures as a subset of the information flow of inference system in Figure 3.1.
Transmit inferring
Check frequency of data change
Set transmission interval
Set VR with Interval for transmission
Figure 4.1 Inference of Data Transmission
During inferring procedures in sensors, there needs to be consideration for how an inference system will transmit data to a requestor network after an inference system has processed the data. It may or may not need to transfer the data at all, and if so, it may not need to be transferred immediately depending on the outcome of the inference. Prior to calculating the transmission interval and frequency, a few interrogations are executed. 1. Checking history of the requestor and previous transactions: attacks may occur by flooding requests repeatedly using link or network layer flooding [56] [94]. To defend from this attack, the frequency of transaction requests from the same user identifying a MAC ID’s low address part must be checked. If it determines an illegitimate request, the user is then registered in the blacklist and banned. It also checks how often the same sensor’s data have been changed within pre-defined
118
criteria ranges since the previous data in order to determine the transmission frequency. 2. Security interrogation: there is a list which is updated from time to time to check screened users or user groups. This list is built from various sources such as regular security patch updates. Existing security measures designed by network operators may be introduced in sensor nodes and WBANs. 3. Resource level: when battery level is lower than specified thresholds, sensors set different levels of priority against the original settings to transmit data to the requestor. For example, requests from IoT devices may be rejected to conserve battery power for requests from physicians if the battery level reaches below 5%. The frequency and interval of transmission are defined as the outcome of this inference. This will further reduce the workload and directly affect the bandwidth and battery power consumption after the data reduction inference has been completed. The following cases are considered to discern and infer: 1. Frequency of data requests from the same device 2. Battery level 3. Sensed data variance, i.e. value changes during certain periods 4. Requestor’s ID (MAC address and pseudo ID)
4.2
PROBLEM OVERVIEW
Research Question 2: Is it possible to ensure the inference system can manage data transfer to a monitoring centre so that critical information is always transmitted? The nature of services between health and IoT applications are relatively different from the perspective of importance and priority. Whilst IoT applications may focus on the provision of lifestyle convenience, health services are more focused on critical or life threatening matters. It also considers the wellbeing of users such as in the health status monitoring of military soldiers for instance. Therefore, transactions from a health network should be treated differently with a higher priority than IoT network transactions. Otherwise, existing health services may not be available when required due to additional IoT traffic on the WBAN. Thus, it is an important objective to transfer data to the health network monitoring centre without failing even in a
119
situation of network congestion control regardless of the IoT traffic workloads. Discerning requests from IoT and health networks as well as inferring data transmission are effective to reduce the transactions from sensor nodes. The outcome of this process will consequently save battery power and bandwidth to secure and guarantee health related transactions.
4.3
DETAILED DESIGN
As the second stage of reserving resources in sensor nodes after the data reduction process which reduced the sampling of data as discussed in Chapter 3, inferring the transmission frequency is proposed to further reduce the transactions. There are two ways of transmitting data, and they are real-time and non-real-time transmission. Requestors may need a single datum on a regular basis, or bulk data for a certain period, such as the last 24 hours of data for heart rate monitoring, which can be efficiently managed to transmit data. When the sensed data does not change often in a normal range, it is likely that the user is in a reasonably stable condition without many changes in movements. The data can be transmitted less frequently instead of transmitted at a regular interval as originally scheduled. In this case, the interval of data transmission can be lengthened to reduce the battery consumption. Thus it is required to determine how frequently data should be transferred by setting a frequency rate. Frequency Rate can be calculated as below; Frequency Rate T (FR T ) =
No of Changes of Criteria of the sensed data Time duration (T2−T1)
x 100,
where T2 and T1 are for a period of designated time duration. Equation 9 Frequency Rate T
Criteria of sensed data can be a certain range of a mean value and its adjacent neighbouring ranges. For example, a frequency rate FR T of 25 is calculated when changes are made 10 times over the criteria of the sensed data during a period of 40 minutes. If the rate of change is 1 or less over the period of 7 hours, then the frequency rate will be 0.23, which is a high interval incremental value according to Table 4.2. In this case, the interval is extended by 4.4 times of the previous interval value until it reaches the maximum interval of 3600 seconds as pre-defined. Figure 4.2 depicts
120
how the frequency of data transmission is adjusted based on the data transmission inference algorithm in Appendix A8. After a pre-defined period of data transmission without change in the data based on the threshold table, a new interval is kicked in. For example, after 5 consecutive regular transmissions within the same range criteria in Table 4.1, the transmit inference interval calculated by Table 4.2 kicks in at (A) starting with the 4th frame as in Figure 4.2. The interval is extended, e.g. doubled for low interval values, until it reaches the end of the set maximum interval. However if the sensor captures a range criteria changed data during this period, e.g. RC1 to RC2, it may change depending on whichever comes first. Afterwards, the interval then goes back to the regular scheduled cycle at (B). Table 4.1 Example of a Range Criteria for Body Temperature8
Range
Criteria Body temperature, Low
Body temperature, High
(RC) 1
36.5
37.0
2
36.0-36.4
37.1-37.4
3
35.5-35.9
37.5-37.9
Table 4.2 Frequency Rate
Frequency Rate
Interval Increment value
Multiplied by9
Max Interval time
20
0
x 1.5
1800
8
Figures have been created arbitrarily for discussion purposes and should be defined by medical scientists for each data type. 9 Figures have been created arbitrarily and should be defined by medical scientists for each data type to develop calculations, which can be adjusted.
121
Transmit inference kicked in (A)
Interval back to regular (B)
Inferred transmit
Sense & capture
T Regular interval
Regular interval expired
Adjusted interval
Regular interval resumed
Figure 4.2 Data transmission interval with inference applied. The green dots depict a regular sensing frequency
To determine the interval as ‘linear’, the frequency rate (FR T ) above can be used along with predefined values as in Table 4.2 to calculate the interval time. It extends the existing interval time by multiplying the pre-set value in addition to the initial minimum delay, e.g. 10 minutes. To apply a non-linear interval time, the equation below can be used for instance as the specific range of values is a design requirement. K
Interval Time (ITx) = a 0 + ∑ (
n(n + 1) ) + IT (x − 1) 2
n=1
Equation 10 Interval time calculation
Where 𝑥 > 0 , 𝑎0 = default minimum delay time, 𝐾 = each interval value (e.g. 1st, 2nd, 3rd, 4th interval etc.). For example, where 𝑎0 = 30, the interval time will be (31, 65, 105, 160, 225) for each interval period of 𝐾. To infer the transmission, the steps below are used to demonstrate for data selection and its transmission interval. 1. Collect history data of the requestor ID and their priority (Px), where x is the priority level with 1 being the highest and 7 being the lowest as shown in Table 3.1. 2. Check request type 3. Scheduled or Unscheduled transmission 4. Check and collect predefined formulas with attributes including: 1. Delay transmit: No delay, delay transmit by x time, delay transmit by y time
122
2. Interval time: Interval time is calculated as below: 1. No limit for interval, e.g. high priority requestors 2. Previous request must lapse, e.g. 120 seconds prior to next transmission 3. Sensed data is within x% from normal mean value, standard deviation (SD) calculation may be used. For example, when the data is within the SD continuously 5 times for consecutive measurements, the interval will increase each instance, e.g. by 100 seconds, 200 seconds etc. 4. Interval parameter is obtained from the interval reference table 5. Interval time is calculated using the formula 6. Increment value is used to calculate the final interval time, e.g. increment is increased until it has reached to M or larger, then changed to 0 (zero) or default value. 7. TTL (time to live) is used to change the interval to start over. E.g. when TTL becomes 0, the interval calculation starts over resetting Increment value to 0. An example of the interval calculation is done as below: When the sensed data is within 1 standard deviation (SD), e.g. 68% probability against the previously collected history based on activities, the interval parameter shall be X. When the SD value is 2, it will be Y and so on. Interval time is calculated using the interval parameter followed by a maximum increment and TTL as in Table 4.3. For instance, 20 minutes is the maximum interval and the interval goes back to the original sensing time when it has reached the TTL (0), which decreases from 30 to 0. Table 4.3 Example of Interval Parameters to determine the interval value and frequency.
SD (N)
Interval parameter
Interval Time
Max Increment
TTL
(P)
(P2=PxP))
(minutes)
(N)
0.5
10
100
20
30
1
8
64
20
30
1.5
6
36
20
30
2
4
16
20
30
2.5
2
4
20
30
3
1
1
20
30
123
Probability calculation: Standard deviation as shown in Equation 11 can be obtained using sensed data and its mean value. For example, individual pulse rate data observed for a period time of a patient can be used in the equation below [137]. 2
Σ(x−μ) S=√ n−1
,μ=
Σx n
,
where µ= mean pulse rate, x = sensed data, and n = number of sensed data. Equation 11 Standard deviation
The deviation and mean value can be used to calculate probability, which will infer the action. For example, when the sensed pulse data are 89, 56, 65, 73, 74, 81, 59, 64, 76, 83, 95, 70, 73, 79, 64, 77, 80, 82, 77, 87, 66, 89, 68, 78, 88, 97 and 65, then µ = 76.111, S = 10.72 where n = 27. The outcome lies within 95% observations with two standard deviations of the mean. That is, 54.67 and 97.55 of individual ranges lying within the normal range of 60 to 100 BPM [138]. This range can be defined by the physician who may use global data from the cloud to compare with his or her patient’s data. If a sensed pulse rate returns a value of 119, this means that it is out of the range of 95% of observations. This information is used along with other sensed data such as blood pressure, body temperature and respiratory rate to infer the likely situation. These other data may suggest that the user may be determined to be ‘sleeping’, despite the pulse rate being abnormal for that activity. The algorithm as shown in Appendix A8 is used to populate and transmit data for actual Fitbit tracking devices for heart rate data. There are two types of data transfers including regular and on-demand, and the information flow for setup and release is as below. Type 1: Regular scheduled data transfer: there shall be data transfer on a regular basis from sensors to the PT as initially programmed by the setup process. • Communication protocol is established and is ready to exchange data, e.g. pair-up • Predefined data format is transferred from the sensor as scheduled • PT acknowledges the receipt • Sensor requests to finish the communication
124
Type 2: On demand data transfer: PT or IoT shall initiate communication when needed. • Communication protocol established and ready to exchange data, e.g. pair-up • Predefined data format is transferred from the PT • Sensor acknowledges the receipt • Sensor processes the request and transfers data • PT acknowledges the receipt • PT requests to finish the communication
4.4
EXPERIMENTS AND EVALUATION
This section describes the tests performed to validate the appropriateness of the data reduction as shown in Figure 4.1 and its results, and discusses its evaluation and conclusion. Specifically the following tests are performed: 1. Heart Rate BPM are used for experiments 2. Various lengths (40 minutes, 2 hours and 24 hours) of observation and processing 3. Short and Long Interval 4. Baseline data is used with 24 hours HR BPM on a second basis (17007 data points) All experiments conducted in this chapter as well as in following chapters followed guidelines of the National Statement on Ethical Conduct in Human Research by the Australian Research Council [32]. As according to the guidelines Section 2.1.1 to 2.1.8, health data obtained in these experiments had no risk. 4.4.1
Testing
When sensed data have been processed to reduce the data by eliminating duplicated, inconsistent and inferred, they are further reduced prior to transmission. The standards to exchange health data between the server (e.g. sensors) and the agent (e.g. PT/smartphone) are already specified by IEEE PHD standards P11073-20601 [46]. Thus this thesis is not describing technical aspects of network interfaces. However, test environment and information flows between sensors and PT are illustrated for experiment’s purposes.
125
Ideally, health data including vitals such as blood pressure, heart rate, body temperature and respiration rate are required to be collected at the same time during movements such as sitting, standing, walking and running. However, it is difficult to measure and collect these data in the real world. Thus, it is conducted by multiple scenarios through continuous monitoring over a period of time, e.g. 24 hours, weeks, months with repeated data collection before selecting sampling groups. Increased data and increasing the frequency of capture will increase the accuracy after averaging and increases the credibility of the outcome. As heart rate sensors are popular and practical to collect data, it is used in this experiment. A heart rate sensor was attached on the wrist of a subject for 24 hours for a few days and the subject moved with various motions including resting, walking, jogging, running, sitting and sleeping. The sensor device collects data every second during exercise mode and every five seconds as a function of a general mode. This differentiates sensing time interval. There are multiple screens for user interface on a smartphone app including setup, data request and data capture. Setup screen is to show the initial configuration including sensor registration and data required to configure essential information prior to pairing up the smartphone and sensors. The data request screen is to show what needs to be sent to sensors so that they can understand what to reply to the smartphone. Data capture is the screen to display information obtained from sensors that the smartphone can display for the user (requestor). Refer to Figure 5.8 for test environment and network topology. Sensor (PC): Server/Agent
PT (Smartphone) Client/Manager
Setup
Data request
Data Capture
Figure 4.3 Information flow between PT and sensors
126
Setup message includes User information, Services ID, Devices registration and Data configuration information. Data request message includes Requestor information, Data information, Repeat or one-time, Timestamp and Battery level. Data capture message includes Current services, Situation status, Alarm status and Sensor device status. Interfaces of PTs and sensors are as below: Existing communication protocols shall be used to exchange data request and transmit data regularly (scheduled) or on demand from requestors such as IoT. In this project, Bluetooth is preferred to be used as it appears as a popular protocol on many devices, however, TCP/IP over Wi-Fi is also used between PC and Raspberry Pi3. Figure 4.4 depicts protocols between the PT and sensors. Between communication and application, there can be system provided protocols within the PC and PT. Smartphone application (app) Layer 5-7
proprietary Communication protocols Bluetooth/BT-LE/ZigBee/ANT+
Layer 1-4
Figure 4.4 Interface protocols between PT and sensors
4.4.1.1
Sensors (server)
There shall be data transfer on a regular or on-demand basis from sensors to a PT as initially programmed by the setup process. 1. Receive input including Setup data and Data Request 2. Run inference logic/algorithm 3. Check if data has been changed from the last input 4. Update/add data 5. Store data 6. Transmit data to PT via Bluetooth
127
4.4.1.2
PT/Smartphone (client)
Smartphone or IoT shall initiate communication when needed. 1. Receive input • From User (physicians/IoT device) via App screen • From Sensors (PC) for data captured via Bluetooth 2. Check if data has been changed from the last input 3. Update/add data 4. Store data 5. Display data on App screen for Users 6. Transmit data to Sensors (PC server) including Setup data and Data Request Heart rate, respiratory rate and body temperature are measured and collected using wearable sensor devices. Testing focused on heart rate data since other applications are discussed in other chapters. Multiple heart rate sensors are used to simulate and test along with multiple human activities. Testing period is for 8 hours and 24 hours for long observation and 120 minutes and 40 minutes for short observations, sensing on a minute and second interval basis. Testing procedures of inferring data transmissions are as below: 1. The requestor is checked against the registration table and identified as a priority user through their MAC address. 2. Since it is a priority user, data transfer is allowed regardless of the battery power condition (50% remaining) as checked in Table 3.3. 3. Sensors capture data every minute over the 42 minutes period as instructed by the data request command. 4. Sensor B at minute 35 for 37.5 degrees Celsius and Sensor C at minute 6 for 38 degrees Celsius both captured an odd data value in comparison to other sensor data at their same respective time values. Thus, a data optimisation algorithm is applied and the data is reduced by 75% (or ended up to 42 from 168). Refer to Figure 3.3 and Table 3.12.
128
5. After having applied the Range criteria (Table 4.1) to the sample data, the data are now reduced to 8 only. 6. Since the data has been changed frequently and out ranged in the Frequency rate, all of them are transferred without changing the interval of sensing and transmission as in Figure 4.2. An overview of the changes before and after the inference has been applied to real heart rate sensors which have been attached to a tester for 9 hours with multiple devices is shown Figure 4.5. Two heart rate sensors were worn on each wrist of the subject to show a difference of data for the same tester. The data captured had to be inferred to optimise the data using the data reduction inference before applying the data transmission inference. Sensors captured data every minute resulting in 528 data points for each sensor. After the inference of using 5% VR, it was reduced to 161 data points. As a result, it is deemed to have reduced transactions by 69.5%. For monitoring heart rates over 24 hours, a sensor captured data on a minute basis as well as a second basis. Refer to Figure 4.6 and Figure 4.9 respectively for the results. It shows that data points marked on the time of 6:05:44 captured on a second basis (Figure 4.9) is missing in the minute based result (Figure 4.6). This means that the sensing interval can be significant when a physician needs to monitor real-time for their patient who is in a critical situation for instance. Minute based sensing will not capture data every second and therefore the health condition between the intervals of two data points is overlooked. As a result, physicians should be conscious of how to set the data requests depending on their situation and purposes in monitoring their patients. Further analysis and testing results are discussed in the next section with efficiency and accuracy as well as battery power savings made.
129
180
Multiple Sensors and Inference applied
160 140 120 100
80 60 40 20 0:00 0:19 0:38 0:57 1:16 1:35 1:54 2:13 2:32 2:51 3:10 3:29 3:48 4:07 4:26 4:45 5:04 5:23 5:42 6:01 6:20 6:39 6:58 7:17 7:36 7:55 8:14 8:33
0
Sensor A
Sensor B
Inferred
Figure 4.5 Multiple sensors data and data inference result of HR sensors Heartrate (BPM)
24-hour Inferencing of Heartrate
180
Before
After (with 0)
160 140
120 100 80 60
40
Data not transmitted after inference Time (Hour)
20 0
0
1
2
3
4
5
6
7
8
9
1 0
1 1
1 2
1 3
1 4
1 5
1 6
1 7
1 8
1 9
2 0
2 1
2 2
2 3
2 4
Figure 4.6 24 Hourly data inference
4.4.2
Discussion
There are various requirements to apply to get the final data and transmission, and how it is applied depends on the design requirements. For example, when the data are captured during sleeping, the body temperature is unlikely to unexpectedly fluctuate often. Therefore the transfer interval algorithm shown in Appendix A8 will reduce the number of transmissions accordingly. However, physicians may request not to apply the inference for a certain period of time in order to obtain a pure observation of their patient’s health status. Thus, it is important to focus on how efficiently and accurately to reduce the transactions of sensors to transfer data to the
130
PT as it directly affects the battery and bandwidth capacity. In this case, the accuracy, efficiency and savings rate (percentage of eliminated data prior to data transmission) are used as defined in Section 1.4 Methodology. 4.4.2.1
Transmission efficiency
An observation of 24 hours monitoring has been conducted for obtaining maximum data points on a second basis. During the 24 hour observation as shown in Figure 4.9, the result of efficiency rate in the heart rate is 25.2, representing a 2520% improvement as shown in Table 4.4. In other words, battery life may be extended by 25 times assuming battery power is linearly related with the volume of data, and an implanted device may not need to have its battery replaced. As previously discussed, the exact application depends on the design requirements, however, the result demonstrates how much the solution can improve the resource capacity. In case of this heart rate observation, 17007 points of real data were collected from a sensor over a period of 24 hours as in Figure 4.9. Two sampling intervals, i.e. every second and minute, and various percentage variances were used to process the collected data. In Figure 4.6, the original number of data was 1420 captured every minute over 24 hours, and after an inference by applying a 5% variance algorithm, it was reduced to 508 samples populated for transmission which is still representative of the original data. In this case the efficiency is 1.79. In other words, approximately two thirds of transactions were removed from being transmitted. Figure 4.7 depicts heart rate patterns based on activities which show that BPMs are around 80 or below during resting, and around 140 or below during walking. Running status is shown as having a BPM above 140. After inferring, the data was reduced by 62% with an efficiency rate of 1.68. Figure 4.8 shows the original number of data is 1420 which was able to be reduced to 146 samples after applying an inference using a 10% variance algorithm. The efficiency rate is 8.72 (where 91% of the original sample points are eliminated). As the results imply, the efficiency rate varies depending on the purpose of the application. For example, physicians may not require data every second or minute, whilst IoT device may request data captured in the last minute or every second in order to provide immediate and real-time services. Therefore it is important to set the initial request level by the requestors and to set the proper configuration when
131
registering users. Practically, IoT service providers may request more data more frequently than physicians who may wish to be informed only when their patients are in imminent danger of falling into an abnormal health situation. In this case, they can set the alarm level to notify based on predefined alarm threshold values when they configure the users and requestors. 180
Heartrate (BPM)
2 Hour Heartrate Before and After Inference
160
140
120
100 Running
Walki ng
80
Walking Resting
60
40
20
Before Inference (121 data points)
After Inference (45 data points)
Time (Minutes) 0
0
20
40
60
80
100
120
140
Figure 4.7 2 Hourly data inference measured with activities in sequence to practice a real exercise situation followed by a resting period
10% VAR IANCE R ATE APPLIED 180 160 140 120 100 80 60 40 20 0 0
1
2
3
4
5
6
7
8
9
1 0
1 1
1 2
1 3
1 4
1 5
1 6
1 7
1 8
1 9
2 0
2 1
2 2
2 3
2 4
Figure 4.8 10% variance rate applied for HR as data inference on a minute-by-minute captured samples, which shows rough results
When comparing data captured by a minute (Figure 4.8) and second (Figure 4.9) basis, they are different since the graphs are plotted by a fixed interval, e.g. 1 second
132
and 1 minute as well as a different volume of data (1420 versus 17007) to process. Human activity can change even within a second and an interval of 60 seconds is long enough to distort the data when they are simply transferred by a fixed time interval. Instead, it is better to discern what data to capture and transmit. Table 4.4 shows the reduced data with its efficiency rate for each samples of HR. Table 4.5 shows several inference rates applied to compare the reduced data volume for each inference for 24 hour HR data captured on a ‘seconds’ interval basis. 180
160
140
120
100
80
60
40
20
0:00:00 0:15:01 0:30:13 0:45:33 1:00:50 1:16:49 1:33:09 1:48:49 2:04:36 2:20:06 2:35:43 2:50:59 3:06:26 3:22:03 3:38:06 3:53:46 4:09:43 4:25:33 4:41:04 4:55:58 5:11:30 5:27:28 6:05:44 6:20:02 7:00:05 7:15:50 7:27:31 7:39:26 7:50:28 8:01:47 8:27:55 9:06:45 9:50:55 10:38:30 11:33:45 12:28:05 13:12:30 13:23:12 13:33:52 13:44:49 14:14:35 15:05:50 16:09:50 17:00:05 17:56:15 18:46:30 19:43:00 20:34:20 21:31:30 22:23:25 23:10:25
0
Figure 4.9 Data captured by ‘seconds interval’, which shows a vastly significant difference to those captured every minute. It captures lost data from a minute-by-minute sample previously shown in Figure 4.8
Table 4.4 Percentage of Data Reduced and the Efficiency Rate for Sampled Data (Heart Rate)
Data Types Original Data points After Inferring Reduced by Efficiency Rate 24 Hr (sec)
17007
649
96%
25.2
24 Hr (min)
1420
146
91%
8.72
2 Hr (min)
121
45
62%
1.68
Table 4.5 Inference Rate for 24 hour HR data (seconds) to compare variance rates (VR) related to efficiency and accuracy as the VR significantly affects the result
Inferred rate
0
1%
2%
3%
4%
5%
10%
Data points
17007
8625
3490
2194
1119
649
66
Savings (%)
0
49.3
79.4
87.1
93.4
96.1
99.6
Efficiency Rate
0
0.97
3.87
6.75
14.1
25.2
256
133
Accuracy (%)
N/A
98.61
95.62
94.11
92.99
92.01
86.87
Having obtained the data from the data reduction process, it is further reduced for transmission by discerning the battery conditions. For example, when the battery level is 5% or lower, all requests from IoT devices may be discarded to reserve the battery for higher priority requests from physicians. Figure 4.10 plotting HR for 40 minutes of resting depicts an example of the difference of data points before and after each inference. The original (40) has been reduced to 18 by the data process inference. This again is reduced to 9 data points by the data transmission inference. Note that the gap between the 14th DP and the last 40th DP is large due to the variance in data value between them being very small. Thus, the transmission inference process discarded those data. Thus, savings of data by data reduction inference is 70%, and this is further saved resulting in 78% after the data transmission inference is applied.
76 73 73
71
68
66
63 61 62 62 62 62
64 60
58 59 57 57 58 58 57 58 57 57 58 58 58 58 58 59 59 59 56 56 56 56 56 56 57 56
1 2 3 4 5 6 7 8 9 10 11 12 13 14 15 16 17 18 19 20 21 22 23 24 25 26 27 28 29 30 31 32 33 34 35 36 37 38 39 40
Original (40)
Data process inferring (18)
Data transmission inferring (9)
Figure 4.10 Inference of data transmission using inferred result of data reduction for 40 min HR data
Figure 4.11 depicts the relationship between accuracy, savings and efficiency after various variance rates have been applied for inference to a 24 hour observation taken at short intervals (seconds). Increased data reduction (savings) means that the efficiency increases as less data are being transmitted. However, accuracy will
134
decrease as less data being transmitted are likely to represent less of the original data (i.e. larger gaps). 100
200
Savings and Accuracy (%)
250
Efficiency
300
150 100
Savings Efficiency Accuracy
50 0
1
2
3
4
5
6
7
9
80 70 60 50 40
30 20 10
Variance Rate (%)
8
90
0
10
Figure 4.11 Effect of Variance Rate on Efficiency, Savings (data reduction) and Accuracy
4.4.2.2
Bandwidth and battery power analysis
Extending battery power and saving bandwidth are the ultimate goal of this thesis to answer the research questions. There are two ways to transmit sensed data from sensors to requestor networks, i.e. Store and forward, or Cut-through [139]. Figure 4.12 captured by Wireshark protocol analyser shows the result of transferring heart rate data and how sensed data are transmitted from sensors by Store and forward. In this case, the data is fragmented into 1460 bytes (payload) to be formed into a frame including headers (1514 bytes) since the data (2800 kB before compression) is larger than the maximum frame size. There are in total 448 packets directly10 exchanged between the sensor and the PC (which simulates a PT for testing purposes). Among these, 180 packets have been transmitted from the sensor to PC, and 268 packets received (mainly for acknowledgement) at the sensor. Data are compressed before transmission as shown in Figure 4.13.
10
There are other extra packets exchanged between the sensor and smartphone if there are internodes such as a wireless router for DHCP function for instance. In this test, there are 665 packets total for ARP and Key exchange etc.
135
Figure 4.12 Data transfer from sensors (Wireshark capturing)
Figure 4.13 Compressed data for transmission from sensor to PT (smartphone). When data are compressed and encrypted, they require more bandwidth as the size increases (Refer to Table 2.4)
As described in Section 3.4.2.6, battery consumes more power during radio transmission than in receiving or standby mode. For simulation purposes, the figures below are used for discussion [26]. Knowledge assumption:
136
• 1 microampere is required for standby • 10 milliampere are required for data receiving • 25 milliampere are required for transmission To transmit 2800 KB data in a simulation by store and forward method, it requires 3130mA (2680mA for receiving + 4500 mA for transmission). This directly affects the power consumption (e.g. P=VI). Each type of battery may have different voltage types, however, they are still affected by the size of ampere required to transmit data. When sensed data are transmitted in real-time without storing, the number of transmissions directly affects the power consumption and. Therefore the power is significantly affected if the frequency of transmission is decreased. To compare transmitted data between the sensor (Raspberry Pi3) and the PC for simulation of various data sizes, Table 4.6 shows statistics of packets and power consumption. The sensor also receives data from the requestor’s network to transmit sensor data for acknowledgement, encryption signal, ARP etc. There are many packets exchanged to establish a communication before and after the transmission to transmit even a single data point. It shows a possible power savings when sensor data have been inferred and reduced for the transmission accordingly. For example, in the case of zinc-carbon or alkaline types of batteries, they produce around 1.5 volts per cell. In this case, 3.14 Watts (i.e. 2090mA x 1.5V) of power can be saved when the transmission of a single HR data point is reduced by the inference system. Table 4.6 Data transmission bandwidth and power consumption comparison for data exchange to transmit sensed data from sensors
Transferred
Size to
No of packets from
No of packets to
Total packets
data files of
transfer
sensor/power
sensor/power
exchanged /power
consumed
consumed
consumed11
sensed data HR 628 DP
120 KB
122
3050mA
193
1930mA
377
4980mA
BT 45 DP
14 KB
38
950mA
145
1450mA
201
2400mA
RR 36 DP
6 KB
29
725mA
139
1390mA
181
2115mA
HR 1 DP
1 KB
28
700mA
139
1390mA
170
2090mA
Combined 647
537 KB
396
9900mA
340
3400mA
740
13300mA
DP
11
Power is calculated by Ampere x Voltage. P(W)=I(A)×V(V)
137
4.4.3
Conclusion
Results show that the data can be reduced from 49% up to 99% with 98% to 86% accuracy rates as shown in Table 4.5. The data transmission inference process further reduces the data transaction as shown in Figure 4.10. • Data reduction inference reduces the transaction by 70% • Data transmission inference further reduces it by 8%, which results in a 78% total Battery power can be saved by 3.14 Watts (2090 mA x 1.5V) for a single data point transmission reduction, and 7.47 Watts (4980 mA x 1.5V) for a 120KB size of data being reduced. With these results, it is possible to satisfy the questions. Relating to Research Question 2: Is it possible to ensure that the inference system can manage data transfer to a monitoring centre so that critical information is always transmitted? The system described in Chapter 4 is capable of handling more functionality. This is due to data savings of on average 78% including a further 8% from the data transmission inference process. Saving transactions resulted in reduced battery and bandwidth consumption in sensors which can allow additional capacity to be reserved for high priority transactions such as mHealth traffic.
4.5
CHAPTER SUMMARY
There are two phases of data inference including data reduction and data transmission. Data transmission inference is executed onto the result of data reduction inference. Aspects of requestors, battery level and previous data values are used to determine the level of data transmission which may or may not transmit, or reduce the number of transactions using the frequency interval algorithm. Results show that the original data points have been reduced by 70% during the data process inference for instance. This was reduced further resulting in a 78% savings rate as the result of data transmission inference in an example, as shown in Figure 4.10. Efficiency and accuracy can be targeted by a specific requirement based on the requestors’ application and service level as there is no single optimal solution for all situations. Sampling interval can significantly affect the quality of data and therefore data
138
requests need to be carefully made for priority users. Battery power and bandwidth are saved when the frequency of data transmission are reduced for real-time as well as store and forward transferring.
139
5 ENHANCEMENT OF ALARM NOTIFICATION USING ACTIVITY RECOGNITION APPLICATIONS A main objective of the inference system is to transmit critical events when it occurs without failing to mHealth users. An alarming situation can be further enhanced by utilising accelerometer sensors and user responses. During the inference process, it is required to determine the normalities and abnormalities of data, such as identifying when the sensed data are abnormal and require urgent attention for raising an alarm. The solution illustrates how the situation can be analysed for alarm determination utilising physiological data, e.g. heart rate of 170 is normal for exercising activity but abnormal for sleeping. It can also be used for optimising data thresholds using AR and user feedback on smart devices for alarm verification. AR applications may use the content of data provided by sensors to improve their own services. This chapter proposes further enhancement of alarm notification and AR utilising physiological data and a user feedback system to satisfy the Research Question 2.
5.1
INTRODUCTION
The rapid prevalence of wearables and body sensors allows additional services to applications of activity recognition technologies as seen in Figure 5.1. Activity Recognition (AR) has become an emerging research area along with mobile technology and personal real time sensors and monitoring devices, which can use health information to improve AR [24]. Typical AR processes involve sensory data collection, labelling and deploying data to build and train a model for classification [76] on which most AR works have focused with modelling processes. As applications, knowing body postures and a user’s current activity status can be very useful in a wide range of industries such as in entertainment, social networks, military, sports, people surveillance in childcare, hospitals or prisons, performing arts, health care and aged care services. Taipa [72] demonstrates how wireless accelerometers can be used for real-time automatic recognition of physical activity type, intensity, and duration and estimation of energy expenditure. However, current AR technology still provides simple and limited information such as sitting, standing, walking or running without much content. Moreover, there are multiple sensors
140
required to increase the accuracy of the activity determination. Orha et al [140] used three 3-axis accelerometers in different locations of the body to increase the accuracy. They found that sensor placement on the human body is important both in terms of their portability and the information provided. For better recognition of posture and activities they found that at least two sensors are required and that the best results were obtained from sensors situated on the right thigh and on the right hand. However, this is arguable as Atallah et al showed that the best results for activity recognition were obtained from the ear [141]. This means that the more sensors they have, the better results they would obtain as Zappi et al [142] found that classification accuracy greatly increases with additional sensors (50% with 1 sensor, 80% with 3 sensors and 98% with 57 sensors). In addition, the location of sensor attachment on a body may affect the AR performance and result in different outcomes. Therefore there is a possibility that the number of AR sensors may be reduced with additional health information such as heart rate if it is related with human activities with unique traits. Physician s terminal
Wireless Body Area Network (WBAN) for mHealth (existing)
Smartphone & Activity Recognition (AR) Apps
Health service/Activity Recognition (AR) service providers network IoT network (new interface)
Body Sensors + Accelerometers (£)
Hospital
Smart home
Smart Office Figure 5.1 Overall Network Architecture for AR and Health service provider networks
When wearables are equipped with accelerometers as well as physiological sensors, this may help to reduce the number of accelerometer sensors. In this scenario, personal sensors are required to be equipped so that the additional information can be used in tandem to verify the activity and postures. With this extra data available to analyse the posture (e.g. sitting or walking), it will be possible to provide granulised information and the level of the posture as there may be tendencies of physiological data to be of certain values while performing those activities. As
141
experimented and shown in Figure 5.3, body temperature, respiration rate and heart pulse rate tend to rise with increased exercise or activity as compared to during rest or sleep. This kind of information is important to mobile health services, and can be used to determine whether an alarm should be triggered or not depending on the activity of a patient. For instance, a heart rate of 170 BPM would be considered normal during exercise, however, it would be a critical value if it was obtained while the user was sleeping and may signify a medical emergency such as a heart problem. Thus, the significance of utilising AR is crucial to know an activity before raising an alarm in providing health services by body sensors. In our experiments, results show that using physiological sensor data along with the existing 3-axis accelerometers can verify and improve the accuracy of AR by experimenting with the unique physiological data related with each activity on an individual basis. As mentioned earlier, the burden of bandwidth and battery consumption of sensor devices are expected to increase due to a rising demand and usage of the Internet of Things (IoT) [22], which is forecasted to connect up to 25 billion things by 2020 [143]. In order to reduce the number of transactions and the frequency of data transmission in wireless body area networks (WBAN), it is proposed to implement an inference system on PSDs. When implemented on sensor nodes, it is able to raise an alarm by analysing sensed physiological data along with activity recognition (AR) sensors such as 3-axis accelerometers. This is done by verifying two points of information: (1) a pre-defined threshold table, which shows the estimated activity based on multiple sensor data, e.g. heart rate (HR), respiration rate (RR) and body temperature (BT), and (2), the activity data obtained by AR sensors. The threshold values are personally prescribed by the user’s medical practitioner as the range of health data and its traits varies across individuals according to their unique factors such as age or health conditions. The alarm notification compares the sensed data against the activity of the user to determine whether an alarm should be raised or not as the sensed data may be normal or abnormal depending on the activity of the user at the time. An inference system may raise multiple alarms when a user’s activity varies frequently within a short timeframe, and this may cause a problem. For example, a user may be determined to be conducting multiple postures in the order of running, sitting, standing, dancing
142
and running. This may be followed by sitting over the period of a short interval, e.g. every 10 seconds during an art performance. In this case, there may be multiple alarms raised by the sensor device during this time which may be deemed to be ‘false’. This will increase the number of transactions and traffic volume as the frequency of sensing will automatically switch to maximum frequency in order to sense and transmit at a high priority. This may overload the sensor and cause congestion in the network. It will potentially prohibit other priority transactions such as data requests from caretaker terminal (CT) devices of health service networks. To minimise the false alarm notification, it is proposed to use a user-based verification method through a smart device application, which provides an option to confirm the situation by responding (or not responding which triggers a “time-out” and executes a pre-set action) to a popup screen from the app. This will contribute to increase the alarming function of the inference system via a twofold verification of the alarm thereby providing (1) true alarm notification and (2) false alarm reduction.
5.2
PROBLEM OVERVIEW
The inference of data reduction (described in Chapter 3) and of data transmission (described in Chapter 4) can reduce the data transactions significantly to save resources and transfer critical events when required. However, frequently changing postures and activities of the user may trigger false alarms. Maintaining an accurate alarm notification is therefore a key requirement to be considered in the solution. Given £ = (S1, S2 ..., Sn), where S = AR sensors equipped with a 3-axis accelerometer, £ requires multiple number of sensors positioned properly on a human body as shown in Figure 5.1 to provide an accurate determination of human activity [140]. This information of activity directly affects the alarm notification of physiological data sensed to determine whether the inference system is required to raise an alarm. The alarm notification threshold is based on individualised values of each data along with each activity. When multiple activities are performed within a short timeframe, such as in performing arts, multiple (false) alarms may be triggered by the AR and physiological data, which will eventually increase the traffic and transactions. This affects the performance of sensors, which may result in
143
diminishing the bandwidth and battery power resources for critical events to be transferred to mHealth network (relating to Research Question 2). Manual confirmation of the alarms by a user feedback system can help to solve this problem.
5.3
DETAILED DESIGN
Aforementioned physiological data can be obtained by many kinds of body sensors and monitoring devices and health applications that may require health data. The data may include blood pressure, electrocardiography (ECG), heart pulse rate, electromyography (EMG), respiration, electroencephalogram (EEG), glucose monitoring, motion detection, thermometer, cochlear implant, blood oxygen – pulse oximeter (SpO2), artificial retina, weight scaling, sleep monitor and many others [144]. Whilst more sensors and data may be useful to determine an activity, vital signs are discussed. Only three vital signs (Heart rate, Body temperature and Respiration rate) are used for the experiments with body sensors as the fourth, blood pressure, is not able to be measured practically during the undertaking of activities. Vital signs are: • Blood pressure (BP) – it is discussed but not used for experiments • Heart rate (HR) • Body temperature (BT) • Respiration rate (RR) Health data have unique traits as opposed to other sensor network data, and therefore they need to be treated and processed differently. • There are inherent lower and upper limits imposed on the data. For instance, the human body temperature naturally falls between 35.5 °C (96 °F) – 38.33 °C (101 °F) with a normal temperature of 37 °C (98.6 °F) [145], and critical deviations from these values would result in death. • The normal values of sensed data vary depending on a user’s characteristics such as age and sex. • The same data could be regarded as normal or abnormal depending on the situation. For example, a heart rate of 150 beats/m is regarded as normal during running but is a cause for alarm during sleep.
144
• They are related with one another, e.g. a linear relationship between temperature and pulse rate with an average increase in heart rate of 4.4 beats/min for each 1 °C (2.44 beats/min for each 1 °F) rise in temperature over the range of temperatures examined (96.0 °F to 100.8 °F) [145]. • They are in the form of numeric numbers. 5.3.1
Activity Determination
Whilst current AR provides the real-time status of an activity, this information can be used for the inference system to determine a situation of the user and to infer whether to raise an alarm or not. By combining various data sources, it is possible to determine a situation or activity as physiological data are related to each other. When a user is running for instance, the heart rate increases, body temperature goes up [9] and respiration rate also rises, and these information can be read together. When data are captured by sensors, the actual value to be used is calculated to produce the health status value. Table 3.6 shows an example of how it can be calculated and weighed to find critical values by allocating different weightings for each sensor. Attributes can be each of the sensed data such as blood pressure (e.g. 140/90 mmHg) with systolic/diastolic, pulse (e.g. 97 bpm) and Body Mass Index (BMI) (e.g. 24 = 170cm/70kg). Inferred values can be obtained by applying thresholds such as low, high, normal, abnormal. This can also include data such as male/female, age, related diseases, body weight, exercise tolerance and overall health condition [128]. They are used along with the weighting of the attribute which is the portion of which it affects health status. This is because not all attributes are equally affected by an activity or situation of a human who could be young or old, male or female or any other such variable. The outcome of the inferring process is to calculate a personalised range of normal thresholds for each attribute and to compare it with generic information. For example, comparing the personal blood pressure range (85/55 – 110/70 mmHg) to the generic range (90/60 – 120/80 Hg) of the specific group the user belongs to. Table 5.1 shows another example of how the weighted value can be used to calculate a situation activity when there is an ‘ambiguity of the situation’ based on each application. Thus, the outcome in this case will be a determination of the user being in a ‘running’ activity state. In the case of AR, the weighting is 100 which results in 100R (Running) activity. HR has a weighting of 20,
145
which results in 20W (Walking). Therefore, the result shows 100R + 50R = 150R and 20W + 30W = 50W. Thus, the inference outcome (150 > 50) is one of running based on these weightings. These weightings are given arbitrarily, however, they should be defined by physicians or scientists. Whilst the AR sensors indicate the status of activity motion, they do not show the level of activity such as the degree of tiredness from the accelerometer. Furthermore, the accuracy of the activity relies on the sensor location which can be unreliable if placed in the wrong location. To enhance the quality of the content, a combination of physiological and AR sensor data can be used to assess the situation. Table 5.1 Example of Activity Inference. Physiological data are used along with AR to determine the activity with different weightings allocated for each sensor
Attributes
Data measurement and calculation Sensed data
Inferred value
Weighting
Result
AR
Running
Running
100
100R
HR
135
Walking
20
20W
BT
37
Running
50
50R
RR
20
Walking
30
30W
Figure 5.2 shows an example of AR demonstrated using Matlab (refer to Appendix D for Matlab data) and an app installed on an Android smartphone. This data can be used along with physiological data processed by the algorithm in order to determine and verify the activity situation. The objective of situation determination is to infer whether the sensed data is in the range of alarm threshold. Thus when the result of sensed data does not fall into the appropriate field of the threshold an alarm notification process is engaged.
146
(a) Sitting
(c) Walking
(b) Standing
(d) Running
Figure 5.2 AR demonstration using smartphone app and Matlab codes as shown in Appendix D. 3-axis accelerometer sensors in an Android phone are used as shown in different colours
5.3.2
Algorithm Creation
There are traits in human activity and the reaction of physiological data to the activities. As the outcome of the experiment, some knowledge are obtained as the following: • When an activity changes from a less active to a more active state, physiological data values of HR, BT and RR tend to increase as shown in Figure 5.3 • When an activity or movement suddenly changes, it takes time for the corresponding physiological data to change accordingly • Physiological data cannot represent or reflect instant movement changes, such as stopping for a few seconds during running • AR data itself cannot tell the degree or detailed content of activity The exercise intensity is an indicator of kinetic strength, and the Target HR is calculated by the Karvonen Formula [146] as defined by: HR T = ((HR Max −HR Rest ) ×%Intensity) + HR Rest , where HR Rest is Resting HR, HR Max is Maximum HR and HR T is Target HR Equation 12 Heart Rate Karvonen Formula [147]
147
Using Equation 12, the Android app calculates the training heart rate as below for our tester who wants to train for the intensity level of 50% to 70% for example. • Max HR: 220 – 16 = 205 • 205 – 67 (resting HR) = 138 • 138 x .50% + 67 = 136 BPM (minimum training HR) • 138 x .70% + 67 = 163 BPM (maximum training HR) Based on these operations, they are compared to the actual averaged HR measurements in our experiment as in Table 5.4 and Figure 5.9, which shows the values during walking (138 bpm) and running (155 bpm). This information is used to create an individualised threshold data for situation determination as shown in Table 3.6, which can be used together with other data such as Respiration and Body temperature to verify the AR data obtained by accelerometers. There may be a case of tricky results when combining the physiological sensor data after inference of their values. As shown in Table 5.1 and as aforementioned in Section 5.3.1, the activity could result in a 50% Walk and 50% Run status after considering the weighting. In this case, the activity of AR data cannot be verified by the physiological data unless the weight has been reallocated to avoid this kind of situation. If this situation occurs, it remains as a dilemma and should be manually reviewed by a physician who can alter the weight or decide which inference to take. However, this is a rare situation and data from before and after that point in time can also be taken into account for determining the likely activity. When there are multiple sensors and data obtained for the same attribute, e.g. heart rate, the inferred value is used to represent how the attribute locates the overall status of the individual’s health. In this case, it may not give many options to discern due to discrepancies. As shown in Figure 5.4, it shows the gaps of two different data, which was taken from half an hour of walking while wearing two devices on the same wrist. This gap could be accounted for by averaging the values from the two data sources. When the number of sensors increases to more than two devices, it becomes more difficult to determine how to handle the data. When sensed data from various sensors are different and some of them are not consistent with the rest of the data, it needs to be an inferred point to decide on whether the specific data should be ignored or used.
148
As shown in Table 3.4, Sensor C in T5 is quite different from other sensed data and it needs to be inferred as being significantly different. (The bolded data in the table are significantly different from other data in Table 3.4). Body Temperature and Heart Rate
37
200
36.5
180
36
160
35.5
140
35
120
34.5
100
34
80
33.5
Walk
Sit
Jog
60
Rest
Run
33
40
32.5
20
32
0 1
2
3
4
5
6
7
8
9
10
11
12
13
14
15
16
17
18
Body Temp
19
20
21
22
23
24
Basis HR
25
26
27
Fitbit HR
28
29
30
31
32
33
34
35
36
37
38
39
40
41
42
43
44
45
Respiration
Figure 5.3 Physiological data variance for activities. BT, HR and RR gradually increase during exercises
BPM
Fitbit
Basis Peak
180 160 140 120 100 80 60 40 20 0
Time (minutes) Figure 5.4 Multiple sensor data showing the gap between two devices
Algorithms to find the activity status are depicted below, with a larger value indicating higher accuracy of the AR data. Algorithm 5 is to infer activity determination when the outcome of physiological data conflicts with the AR result, which will overwrite them. In this case, the AR result cannot be verified as the physiological data will not be used for the AR determination. It also finds the amount
149
of influences by physiological data to verify the AR result to determine whether an alarm needs to be flagged or not. Algorithm 5 Activity and Alarm determination
Algorithm Activity and Alarm determination Input: AR sensor_data_status_(x) where x = 1(e.g. walk), 2, 3, 4, 5, HR_sensor_data = H_inferred(k), where k=1, 2, 3, 4, 5 RR_sensor_data = R_inferred(l), where l=1, 2, 3, 4, 5 BT_sensor_data = B_inferred(m), where m=1, 2, 3, 4, 5 AR (w) = weight of AR, default 100 Output: status of activity and alarm 1: if Sum of H_inferred(k), R_inferred(l) and B_inferred(m)
≥
AND different value to AR sensor_data_status_(x) then 2:
add zero to AR(w)
3:else 4:
add sum to AR(w)
5:end 6: if H_inferred(k) 7:
=
AR sensor_data_status_(x) then
add 20 to AR(w)
8:
if R_inferred(l)
9:
=
AR sensor_data_status_(x) then
add 30 to AR(w)
10:
else
11:
If B_inferred(m)
12:
=
AR sensor_data_status_(x) then
add 50 to AR(w)
13:
else
14:
add zero to AR(w)
15:
end
16:
end
17: else 18 if H_inferred(k) 19: 20:
23: 24:
AR sensor_data_status_(x) then
add zero to AR(w) if R_inferred(l)
21: 22:
≠
=
AR sensor_data_status_(x) then
add 30 to AR(w) else If B_inferred(m)
=
AR sensor_data_status_(x) then
add 50 to AR(w)
150
25:
else
26:
add zero to AR(w)
27:
end
28:
end
29: if AR(w) 30:
∉
Th(r) OR
≠
AR sensor_data_status_(x) then
proceedFlag_alarm
31: else 32:
ignoreFlag_alarm
33: end
• H_inferred(k): heart rate result for activity x where x = walk(1), sit(2), stand(3), run(4) and sleep(5). This is defined by the AR application • R_inferred(l): respiration rate • B_inferred(m): body temperature • AR(w): outcome of calculation for activity discernment • Flag_alarm: functional block of raising an alarm 5.3.3
Alarm notification utilising AR and smart device application
In the age of smart devices, there are several possibilities where user feedback can be sent. The two most pervasive are smart devices and smartwatches, where a user can receive a popup notification, and either ignore it or respond to it. Given the need for user simplicity, the system is designed so that notifications disappear automatically if no response is received, and any required feedback is in the form of single-tap buttons. When the smart device receives the alarm notification from the WBAN, it opens the app screen notifying of the alarm and allows the user to respond by selecting from a menu of options. If there is no response within a certain period of time, e.g. 60 seconds, this is deemed to be a “time out” and the app sends a confirmation message to the sensor node. If conditions persist to the thresholds of the sensor node, then the sensor node will take further action of raising the alarm to the next level, e.g. asking the user if they require help, and possibly notifying physicians or requesting emergency services as pre-programmed. The app is capable of receiving any query from any sensor node, with answers received by all sensor nodes. As these are intended to be infrequent events and most often only during an initial training period, their effect on sensor node battery life is presumed to be negligible.
151
In the second stage of decision-making, a sensor node runs through the following logic: 1. The user feedback is received and averaged with existing user feedback. 2. If the user’s data is to be outside tolerance ranges, further action is taken. 3. If user feedback is inappropriate for the current reading levels, further action is taken. When further action is warranted, a further prompt is sent to the user. From the app screen the user can select one of the options below as an example: 1. No it shouldn’t be an alarm (I am OK) 2. Yes, I need help but not urgently (I am not OK) 3. Yes, it is ‘Urgent’ and I help ASAP (I am dying. Please save me) For option #1, the smart device notifies the sensor of a ‘false’ alarm, and the sensor discards the alarm and cancels the notification. For option #2, the smart device notifies the sensor of a ‘true’ alarm and the sensor continues with raising the alarm. The smart device app notifies the alarm to pre-defined parties. For option #3, the smart device notifies the sensor of a ‘true’ and ‘urgent’ alarm and the sensor increases the alarm level to maximum urgency. The smart device app notifies the alarm to predefined parties whilst emitting siren noises. CT or physicians may actuate the sensor device for further action if necessary. 5.3.3.1
App Design
The smart device app has multiple screens to display the alarm notification and examples are: Screen 1: Notification 1. Alarm is raised at ‘14:22:00 21 July 2016’ 2. Slide to ‘ignore’ (‘false alarm’ is inputted, and a confirmation message pops up) or ‘respond’ (options screen is displayed with details of the alarm). A timeout event triggers the default alarm. Screen 2: Details of the alarm 1. User ID (name/nick name)
152
2. Date and Time (incidence time stamp, current time) 3. Location (with GPS turned on the location may be displayed) 4. Sensed data which triggered the alarm, e.g. BPM 170 5. Sensed activity, e.g. sitting 6. Selection of 1 (false), 2 (default alarm), 3 (urgent alarm) or timeout, followed by a confirmation of the selection 7. The information flow are as below in Figure 5.5 When the user responds with details of the activity such as ‘resting’, ‘active’ or ‘very active’, the information is sent to the sensor. The sensor will then discern the normality of the alarm and take appropriate actions such as to ignore, raise the default alarm or to raise an urgent alarm. Figure 5.5 depicts the process of user actions, and Figure 5.6 shows an app screen on the smart device displaying a general inquiry. Alarm received
Menu Slide/ Respond
Ignore
Respond
Time out
Smartphone
Display details/ options
Resting
Active
False Alarm
Default Alarm A0
F0
Very Active Urgent Alarm A1
Figure 5.5 Smart device app screen menu selection flow
153
Sensor
Figure 5.6 General Inquiry
5.3.3.2
Sensor to App Communication
The app receives JavaScript Object Notation (JSON) data from the system or sensor nodes as requested by e.g. UDP/IP using WBAN interface and protocols such as WiFi, Bluetooth, BT-LE, ZigBee etc. [9]. The data requests from the system/sensor nodes are shown in Appendix A7. 5.3.3.3
Feedback-Enabled Activity Recognition
User feedback allows any AR system to benchmark initial parameters unique to each user. Whilst Table 5.2 shows the resting heart rates (BPM) for men as a general guide [148], an individually prescribed threshold for activity can be prescribed by clinicians for each user as subject-specific training data are also required [86] as shown in Table 3.6. As an average man will have a different range of resting BPMs when compared to an athlete, this cannot be applied to every man. Therefore it is essential to create an individualised threshold table. Likewise, AR system can also have a customised data set from learning and mining activity data using generic information obtained by big data as well as user inputs. A notification message can be individually customised such as the one shown in Figure 5.7, which depicts an example of the app screen for the user to input when notified by sensor devices. For example, the slow walking activity of an athlete may be a running activity of a child, and this difference can be accounted for by verifying with the child’s physiological data as a way to confirm their AR determined running state. In other words, the heart rate of 127 BPM shown in Figure 5.7 is not necessarily considered to be ‘high’ for other users as they may have a different range of thresholds. Table 5.2 Resting heart rate for men [148]
Age Athlete Excellent
18-25 49-55 56-61
26-35 49-54 55-61
36-45 50-56 57-62
154
46-55 50-57 58-63
56-65 51-56 57-61
65+ 50-55 56-61
Good Above Avg Average Below Avg Poor
62-65 66-69 70-73 74-81 82+
62-65 66-70 71-74 75-81 82+
63-66 67-70 71-75 76-82 83+
64-67 68-71 72-76 77-83 84+
62-67 68-71 72-75 76-81 82+
62-65 66-69 70-73 74-79 80+
Figure 5.7 User Response. The heart rate of 127 BPM could be normal or abnormal depending on the activity of the user, e.g. resting or exercising
The feedback system records a simple table per sensor node including the sensed information, the duration it took to receive the feedback, the time recorded at response and the user input. The application can provide further details of the activity as the heart rate, for example, may fluctuate during the “elevated” or “lowered” time of the activity. Therefore the “start” and “end” times of the “activity” (or anomaly event), and the average BPM during that period can also be included. This may require a separate table of the times and responses of each user feedback, linking to the ID of one “activity” period as there may be multiple responses if the activity lasts for a prolonged duration. This feature however, is up to the application requirements.
5.4
EXPERIMENTS AND EVALUATION
5.4.1
Testing
A network topology is designed and configured as shown in Figure 5.8 to execute the testing. Sensed data flow from the sensors to the data server for initial data processing, and they are sent to the smartphone app to display the data to users.
155
During the process, it is required to program API commands to retrieve data from the data server based on a sampling frequency and the desired period of time to export. Raspberry Pi3 is used to simulate data transfer from a sensor to smartphone to measure bandwidth and battery power consumption. Sensor Data Export Network
Sensor
Sensor
Data Server
Smartphone WiFi Raspberry Pi2
PC
F/W
Wireless Router Figure 5.8 Sensor Data Export Network Topology
The experiment was conducted with a subject who is a female (16 years old, 162cm height, 52kg weight, Resting (67 bpm) in the morning and max (205 bpm) HR). The subject wore two sensors for the heart rate (HR) and one sensor for the skin temperature. She undertook different postures and activities over the course of 45 minutes including sitting, walking, fast-walking, jogging, running and resting. To obtain a stable data, the subject repeated the same sequence for three days to check the consistency of the devices and the result was obtained on the third day, which was similar to the previous days. Table 5.3 Measurement Condition
Sequence
Posture
Activity
1
Sitting
Sitting
300
2
Walking
Slow Walking (3 km/h)
300
Fast Walking (5 km/h)
600
Slow Running (7 km/h)
300
Fast Running (9 km/h)
600
Stand Resting
600
3 4
Running
5 6
Standing
156
Duration (second)
Table 5.4 Averaged measurement value
Data type
Sitting
Walking
Running
Resting
HR
81
138
155
106
BT
34.5
35.5
36.8
36
RR
8
22
39
14
Averaged measurement values 180
160 140
120 100 80
60 40
20 0
Sitting
Walking Heart rate
Running Respiration rate
Resting
Body temperature
Figure 5.9 Averaged measurement values for activities
Results show that physiological data changes according to the activities as below. • Body (skin) temperature follows heart rate, whilst respiration rate takes time to increase and decrease • Respiration rate changes slowly during walking Body temperature is the ‘skin’ (not the core) temperature which will be the case in most body sensors that are worn outside of the human body, and therefore it is quite lower than the normal (36.5 °C) temperature at the beginning. Table 5.3 shows a detailed measurement condition in sequence with the duration conducted for each activity including activities of sitting, walking, running and resting. In order to obtain data simultaneously for each activity, Sensor device 1 was worn on the left wrist to measure heart rate, and Sensor device 2 was located under the left armpit to measure heart rate and body temperature at the same time.
157
Figure 5.10 depicts the heart rate result measured and retrieved on a ‘second’ basis for each activity. Respiration Rate was captured every minute for breaths manually, and the results are shown in Figure 5.11, whilst Figure 5.12 shows the result of the body temperature. These figures show that there are traits and ranges of data between activities and each data type of HR, RR and BT. This information requires analysis and prescription by the individual user’s physician to define the range criteria for each activity. Details are discussed in the next section with test results and observations. Heart Rate 200
180 160
140
BPM
120
100
Running
Jogging
80
Sitting
60 40
20 0 0
50
100
150
200
250
300
350
400
Time (seconds)
Figure 5.10 Heart rate data sensed per second
Respiration Rate 50
Breaths per Minute
45 40 35 30 25 20
Running
15
Jogging
10 5
Sitting
0 0
5
10
15
20
25
30
Time (Minutes) Figure 5.11 Respiration rate
158
35
40
45
50
Body Temperature 37
36.5
36
35.5
35
Running 34.5
Jogging 34
33.5
Sitting
33 0
5
10
15
20
25
30
35
40
45
50
Figure 5.12 Body temperature
5.4.2
Discussion
As shown in Figure 5.9, the value of vital signs increase when the activity moves faster or longer for exercising, and each sensor data shows its own trait for each activity. When comparing body temperature in Figure 5.12 and respiration rate in Figure 5.11, the former drops very slowly whilst the latter decreases significantly instantly after running has stopped for the resting period. At the same time, the heart rate gradually decreases with an approximate slope of 45 degrees. This implies that the activity of the user is ‘standing’ while resting after exercising based on this additional information provided from the three sensors. The respiration rate graph in Figure 5.11 depicts a continuous and steadily increasing slope during the exercise until reaching and peaking at the top of 46 bpm while running. This means that the data can be useful as an indicator of each activity with a reasonably good threshold range as shown in Table 5.4. Heart rate also shows a reasonably good distribution of data for each activity. By using AR and physiological data together it is now possible to see the content of the walking activity as opposed to the posture only for instance. Based on the plotting such as Table 3.6, which is individually customised and prepared, and Figure 5.3, which shows the overall data patterns for each activity, we can pin point the level of exercise on the graph using both the information from the AR as well as physiological data. This means that we can now see more in-depth information in addition to the accelerometer data and that new valuable information can be produced for service
159
providers. For example, AR data can add a human activity status as well as its content, e.g. ‘slow and fast running for 15 minutes’ instead of just a simple ‘running’ status, and it confirms the user is in the ‘cardio’ range heading for the ‘peak’ HR range for exercise. If the heart rate drops during the running session (indicated by the three sensor data) and the AR data shows the posture is of a sitting or prone position, it may be possible that the user has had a heart attack. This is very significant information to the service provider, and will not be achieved when only the AR data is provided without the additional physiological data. Presently, AR has used data collected from accelerometer sensors only, and they now need to collect and process additional physiological data to build activity models. This will cause issues on the capacity of data volume as well as context aware domains such as security and privacy since the data are personal and confidential. These aspects may affect the nature of the AR related applications and services, and therefore service providers may need to carefully assess the potential impacts of using health data of individuals. To determine a situation (activity), multiple data types are used for discernment. For example, with heart rate (HR), BT and RR data captured by a sensor indicating ‘running’ with 160 BPM, 37 °C and 40 breaths per minute (bpm) respectively, the inference system will assume that the user is in an exercise mode. When this exercise status is confirmed by the AR data as the user being in a walking or running posture, these data are regarded as ‘normal’. However, if some data indicate a different activity (e.g. sleeping) against other data types (e.g. walking), it then requires an algorithm to make a decision. If the outcome is not consistent with the AR data, it will raise an alarm due to the discrepancy in physiological values with the determined activity. For the purposes of testing, heart rate data are used for different activities taken by the user, and sensors may use other types of data for inference purposes. The actual HR data are classified to determine the activity as below: • Resting: 100 BPM or less • Active: 101 – 149 BPM • Very Active: 150 BPM or more
160
There are various scenarios for testing, and the below shows an example of a false alarm which the user responds to through a smart device application. • Step1: Sensor captured 79 BPM and determines ‘Resting’ • Step2: Sensor inquires and receives ‘Running’ from AR • Step3: Sensor notifies an alarm to smart device • Step4: Smart device app displays ‘alarm notification’ • Spte5: User selects ‘ignore’ • Step6: Smart device app responds with ‘false alarm’ to the sensor • Step7: Sensor discards alarm An observation of heart rate BPM is shown with details for Basis Peak in Table 5.5. An averaged result with Fitbit is shown in Table 5.6. Figure 5.13 depicts HR BPMs of both along with each activity. Table 5.5 Test results of Basis HR BPM threshold ranges
Time 2016-03-24 22:43Z 2016-03-24 22:44Z 2016-03-24 22:45Z 2016-03-24 22:46Z 2016-03-24 22:47Z 2016-03-24 22:48Z 2016-03-24 22:49Z 2016-03-24 22:50Z 2016-03-24 22:51Z 2016-03-24 22:52Z 2016-03-24 22:53Z 2016-03-24 22:54Z 2016-03-24 22:55Z 2016-03-24 22:56Z 2016-03-24 22:57Z 2016-03-24 22:58Z 2016-03-24 22:59Z 2016-03-24 23:00Z 2016-03-24 23:01Z 2016-03-24 23:02Z 2016-03-24 23:03Z 2016-03-24 23:04Z 2016-03-24 23:05Z 2016-03-24 23:06Z 2016-03-24 23:07Z 2016-03-24 23:08Z 2016-03-24 23:09Z 2016-03-24 23:10Z 2016-03-24 23:11Z 2016-03-24 23:12Z
DP ID 1 2 3 4 5 6 7 8 9 10 11 12 13 14 15 16 17 18 19 20 21 22 23 24 25 26 27 28 29 30
HR BPM 78 77 81 87 79 88 106 103 105 98 104 114 114 120 122 127 144 147 149 151 158 177 177 189 189 184 177 172 155 161
161
Activity Sitting Sitting Sitting Sitting Sitting Walking Walking Walking Walking Walking Walking Walking Walking Walking Walking Walking Walking Walking Walking Walking Jogging Jogging Jogging Jogging Jogging Running Running Running Running Running
Result Resting Resting Resting Resting Resting Resting Active Active Active Active Active Active Active Active Active Active Active Active Active Very Active Very Active Very Active Very Active Very Active Very Active Very Active Very Active Very Active Very Active Very Active
2016-03-24 23:13Z 2016-03-24 23:14Z 2016-03-24 23:15Z 2016-03-24 23:16Z 2016-03-24 23:17Z 2016-03-24 23:18Z 2016-03-24 23:19Z 2016-03-24 23:20Z 2016-03-24 23:21Z
31 32 33 34 35 36 37 38 39
180 190 180 161 157 139 120 113 114
Running Running Running Walking Walking Standing Standing Standing Standing
Very Active Very Active Very Active Very Active Very Active Active Active Active Active
Sitting
Walking
Running
Resting
81
138
155
106
Table 5.6 Average Fitbit HR BPM for activity
HR Average HR (BPM)
Figure 5.13 Heart rate BPM results for each activity
As Table 5.6 shows, the average resting HR figure is higher than the sitting HR average, and this is because the resting was observed right after the exercise. Whilst the user may be sitting or standing for the duration of the rest, the AR sensor may not convey the real status of the user such as the moments ‘before’ or ‘after’ the exercise, which can affect the alarm determination. For example, the data point (DP) at the 35th DP of 157 BPM in Table 5.5 shows a much higher BPM than the 7th DP of 106 BPM. Whilst both BPMs indicate a walking status by AR sensor and are within the normal ranges for alarm, the user’s response may be different in each situation, e.g. Active and Very Active. This can be very useful as it provides more detailed information to the sensor for inferencing as well as the AR application, which can
162
now understand two statuses of content, i.e. standing (active) and standing (very active) instead of a single status only (e.g. standing only). DP ID (10th) in Table 5.5 shows a BPM of 98 which appears unusual when compared to adjacent DPs as it suddenly drops during walking. This kind of inconsistent data can be verified by comparing with other datasets as shown in Figure 5.13 which shows the Fitbit BPM (10th DP) also dropping. Threshold table optimisation: After having received the user feedback in response to alarm verification requests, the thresholds are optimised and adjusted as below. Table 5.7 Trained AR from user feedback for alarm verification requests
Time -03-24 22:48 -03-24 22:56 -03-24 22:57 -03-24 22:58 -03-24 23:03 -03-24 23:04 -03-24 23:11 -03-24 23:12 -03-24 23:16 -03-24 23:17
BPM 88 120 122 127 158 177 155 161 161 157
Sensed AR triggered Alarm Sitting Walking Sitting Running Jogging Jogging Walking Sitting Walking Walking
User feedback Resting Resting Active Active Active Very Active Active Very Active Very Active Very Active
The sensor device determines the situation as ‘unusual’ as per its situation determination algorithms (Algorithm 5) calculation based on the AR data. Therefore it sends a notification for verification to the user, who then responds with the correct activity. As the result, the thresholds are modified as below. Based on these adjusted BPMs, the sensor will determine the alarm thresholds to calculate with AR data to notify alarm verification for future alarm notifications. By repeating this process, the threshold data becomes increasingly optimised and more accurate for the user as the below figures, which can be continuously modified with subsequent user feedbacks. • Resting: 120 BPM or less • Active: 121 – 160 BPM • Very Active: 161 BPM or more Accordingly, the average measurements are adjusted as below. Table 5.8 Adjusted average measurements
HR
Resting
163
Active
Very Active
Average HR (BPM)
89
148
170
Contrasting Table 5.6 with Table 5.8 which has been optimised, the results show that user feedback has improved the accuracy of activity thresholds and therefore the solution is adequate with more accumulated data and processes. 5.4.3
Conclusion
To determine an alarm status, AR is used for situation and activity recognition. Current AR mainly shows the current activity only without including content of the activity level, e.g. how long the activity has lasted. By using physiological data along with accelerometer sensors, it is possible to determine whether the sensed data are normal or abnormal for alarming. The inference system compares the sensed data with accelerometer data against a threshold values customised for each individual by physicians as well as learned data from user inputs. This alarm notification process by sensors can be improved through reducing possible false alarms by verifying the situation with the user using a smart device application. With these results and with those in chapter 4, it is possible to satisfy the question. Research Question 2: Is it possible to ensure the inference system can manage data transfer to the monitoring centre so that critical information is always transmitted? An alarm message is always transmitted with priority over less prioritised transactions such as IoT related requests. Reducing false alarms by alarm confirmation using a user feedback system also improves the accuracy of alarm notification in a situation of frequent alarm generation. This results in reducing priority transactions such as alarms so that other critical information is always transmitted when needed.
5.5
CHAPTER SUMMARY
The existing AR data shows the simple status of human activity and posture for the purpose of healthcare industries and service providers, and many works have focused on improving technologies in classifying, processing and transmitting. However, they have not considered utilising physiological body sensor devices but have rather focused mainly on 3-axis accelerometer sensors. To provide accurate information,
164
they need multiple sensors on the right locations of a human body. To reduce the number of accelerometer sensors, it has been shown what body sensors can provide to AR data so that AR service applications can add useful information such as health data with activity to enrich the content. These additions combined together with AR data will contribute hugely to the industry and may potentially open a new contents market. The fact that AR could provide detailed information about how long each activity has been along with health data during a sample period as compared to the current state of simple activity notification could have very useful applications. To verify and increase the accuracy of AR data, this thesis proposed to infer a data threshold table which can be developed and finely modified by health professionals for individual users based on their unique activity patterns. For example, the slow walking activity of an athlete may be a running activity of a child, and this difference can be accounted for by verifying with the child’s physiological data as a way to confirm their AR determined running state. This chapter also presented a system design and demonstrated alarm notification using AR with a smart device application that a user can feedback the correct situation into. Using these inputs to train AR and data thresholds, the accuracy of AR determinations can be increased and therefore reduce the instances of false alarms.
165
6 CONCLUSION AND FUTURE RESEARCH DIRECTIONS 6.1
CONCLUSION
This thesis shows a new approach to an idea of inferencing body sensors data which can be used for applications such as in health services and in IoT. It is expected that body sensors will be overloaded with extra demand from additional traffic and transactions when converged with the IoT network. This problem tried to be addressed by considering whether a resource constrained sensor in a WBAN can provide data to external networks consistently and reliably regardless of the traffic load. More specifically, this thesis focused on how to overcome the resource limits of body sensors to handle increased functionality added by the inference system, as well as to ensure the inference system can manage data transfer to the mHealth monitoring centre so that critical information is always transmitted. It also questioned how duplicated transactions and inconsistent data amongst multiple sensors triggered by the same IoT device can be managed. As a solution, it was proposed to implement intelligence on body sensors by applying an inference system to reduce unnecessary or repeated transactions and to save resources. This would involve three intelligent functions. • Inference of data reduction including requestor analysis and situation decision making • Inference of data transmission inferring destination and priority • Use of activity recognition to determine an alarm status and increase accuracy of the alarm notification These are done using the analysis of ‘sensed data’ and comparing with pre-defined data thresholds prescribed specifically for patients by their physicians for health services. The experimental results showed that this inference solution is efficient on saving bandwidth and battery power, and can be even more effective than other methods described in the related works such as improving routing protocols. However, it remains an aspect of design on optimising this system with medical practitioners to meet the frequency and volume of data demanded by health and IoT
166
service providers. The paradigm of solutions therefore also needs to adapt from a small scale approach (such as savings improvements of two digit percentages based on existing works as seen in routing enhancements) to a large scale approach (such as savings of hundreds or thousands of percentages) as proposed by working on and improving the efficiency of transactions from the source prior to transmission to networks. In other words, optimising and removing unnecessary data transmission at the sensors before they are injected into the network is the most efficient way instead of manipulating networks such as routing enhancement. Test results show that the data reduction from sensor nodes range from 49.3% up to 99.6% depending on the inference situation, and is achieved by two inference stages. For instance, data reduction (Stage 1) inferred the original data and reduced 70% of the data. This was further reduced by a data transmission inference (Stage 2), which reduced the data by an additional 8%, resulting in a 78% total reduction of data. To properly provide the physiological status of the user, the inference system needs to determine whether the sensed data are valid and raise an alarm when required. When a user’s activity changes often, the system may generate false alarms. To avoid this, it is necessary to understand the activity of the user to see whether the sensed data is normal or abnormal based on the activity being undertaken at that time. This problem is solved by a user feedback system with a smartphone app utilising physiological data and AR application. In conclusion, discerning data requests from health and IoT networks, and inferring data reduction and transmissions to reduce the transactions on sensor nodes is the most effective way to save resources. Saving bandwidth and battery power are critical aspects in WBANs and sensor devices. Furthermore, utilising physiological data will help the AR to determine human activity and to improve the accuracy of alarm notification. This may allow the reduction of AR sensors as well as to enrich the content and services by analysing physiological and AR data together using smartphone applications. Therefore, the overarching research question ‘to determine whether a resource constrained sensor in a WBAN can provide data to external networks consistently and reliably regardless of traffic load’ as described in Section 1.3.2 is satisfactorily answered by the inference system which proposed:
167
•
Data Reduction for reduction of sensed and sampled data volume (Chapter 3)
•
Data Transmission for further reduction of transmission frequency (Chapter 4)
•
Enhancement of alarm notification to reduce false alarms (Chapter 5)
6.2
FUTURE RESEARCH DIRECTIONS
When mHealth converged with IoT has been fully deployed, it is required to manage sensor nodes by a network management system located centrally in the cloud. Data collection and analysis for heterogeneous networks is also an area of research in order for big data to create valuable information. Since physiological data carries personal information, it is important to provide the data in a secured manner. However, this requirement may increase workload to the existing networks, and therefore a method of light weight security technology needs to be investigated. The following sections present future areas of study. 6.2.1
Privacy and security
As biometric data of an individual includes very personal, private and sensitive content, it causes issues related to security and privacy. Threats and attacks can be made including spoofing, in which an attacker presents a falsified trait to the system with the intention of masquerading as another person. Another threat may be evasion, in which a person attempts to obfuscate or modify a trait in order to avoid detection by the system. Evans et al [149] define biometrics as the science of recognising individuals based on their behavioural and physiological characteristics such as their face, fingerprints, iris, voice, gait, and signature. A typical biometric system may be viewed as a pattern classification system that utilises advanced signal processing schemes to compare and match data. As this area has been rapidly evolved, it is proposed to utilise physiological data as a novel approach to aid in privacy and security. Everyone has a unique physiological condition, which can be collected and processed to create an individualised biometrics pattern. For example, people who are hospitalised will have movement restrictions as compared to daily commuters and therefore may have less activity such as running or exercising over long periods of time. In this case, physiological data with AR can verify whether the health information of an individual is genuine or whether it has been modified and injected as an attack. When an individual has personal health characteristics such as diabetes,
168
obesity, high blood pressure or other chronic diseases, it is likely that they have specific data that could be used to analyse and define biometric footprints. The question of how to manage the separation of user information and health data has not yet been addressed by an international standard body such as IEEE 11073 PHD [46]. It is crucial to protect confidentiality of patients as health information may be processed and used by various parties such as caregivers, health service providers and government agencies for their own purposes in homogeneous or heterogeneous networks. One option to prevent identifying information could be to store personal information and health data in physically separated networks. It can be implemented by utilising a median device placed between them with strong firewall and security functions applied. It is proposed to use a pseudo identification of the user for data exchange between sensors. Physicians or other registered users may have an access to the database to obtain the personal data in a separate network such as the cloud. As this area is part of the network security domain including public networks such as cellular networks and the internet, it remains a future study that will not be addressed. This thesis intends to point out the importance and possible ideas (e.g. using pseudo ID and a median device to separate user information) of privacy considerations when network operators implement their services. The following sections describes each area in detail. 6.2.1.1
Security and Quality of Sensor Device
When a patient is equipped or implanted with sensors, there must be a way to verify that the sensor device will work properly as malfunctions or invalid data will critically affect the treatment or prescription by the caregiver. Also at a physical layer, there is a way of providing encryption with keys embedded within sensor chipsets which will be installed by manufacturers. This will make attacks harder, however, it is required to replace the key by reconfiguring keys stored in the memory when it has been compromised and listed in the blacklist. Portilla et al proposed that both a hardware and software solution is more energy efficient than a software only solution for WSNs [150]. Embedding keys in the device’s memory will require more storage capacity. Furthermore, implementing security mechanisms requires extra bandwidth to transfer data which brings up the issue of power capacity limitations. Future areas to consider may include utilizing combinations of both preloading keys and generating keys on the device which has been shown to increase efficiency [103], as
169
well as solving issues of power capacity limitations. Such solutions may include wireless charging or self-generation of power. 6.2.1.2
Security Measures in Personal Health Device (PHD):
There are currently no plans to implement security mechanisms under the IEEE 11073 PHD work group. Although the PHD work group focuses on the application layer and accordingly, does not deal with security measures on the lower layers, it is still important to provide security mechanisms for the application layer as some threats such as DoS can occur at any layer. A study is required on how to ensure the PHD data transfer with an underplayed security structure, and how it interacts with various mHealth networks with standardised and complied protocols at lower layers. 6.2.1.3
Compatibility and Standardization of Security Protocols versus Application Protocols
Collected health data has little value until it has been properly processed and analysed by algorithms to create meaningful data for physicians. For this purpose, it is better to collect more information across heterogeneous networks rather than less. With various standards and technologies being utilised by multiple vendors, the interoperability of WSN devices within a homogeneous network is an important requirement to consider as it affects security. In order to process health information collected across heterogeneous networks, the data format should be processed by a MC to focus on efficiency. As mHealth technology covers end to end networks from WSNs to the caregiver’s terminal which includes various entities of standard bodies such as IEEE, ITU-T and IETF, it is envisaged that a couple of popular standards may be used in the long term rather than various incompatible standards. This will rely upon the cooperation and efforts of vendors to participate and discuss on agreements. Ultimately it will be up to the end users to influence and decide which standards to be used. While there are many proprietary routing protocols being used within WSNs, it is required to include this in international standard categories such as IEEE/ISO so that manufacturers are able to adopt at higher layers such as transport and upwards. 6.2.1.4
Unique Identifiers as an Authentication Mechanism
Over an extended period of time, certain patterns from the data collected by sensors may arise which is specific to an individual. For instance, metabolic patterns of an individual may become apparent and be used with other collected data to act as a
170
“fingerprint” for authentication purposes. Utilizing a person’s physiological, biological and metabolic characteristics for use in security mechanisms can be a possible area of study in the future to consider [103]. Sensor nodes can also be verified using its pattern of battery consumption. It is unlikely that other sensors will have the same pattern and this can be used to verify that the data came from the authentic sensor. An abnormal change in this pattern could indicate a malfunction or an attack which can be used as a prompt to manually check the device. 6.2.1.5
User Centeredness
It is important that the patient is able to have a level of control over their own information such as the ability to stop the transmission of data to a health service provider for privacy purposes. Patients should be able to control the collected data and to the parties it is provided to, even though the data can be owned and maintained by a caregiver or hospital in medical records. This is particularly important as mHealth is extending to wearable devices for the general public for fitness, dietary and other health purposes with the release of the Apple Watch as well as other Android devices. Users of these devices should have the ability to benefit from the information that they provide such as being able to track and view real time data collected by the MC. For example, being able to track their own weight data against mean weight patterns in their geographic area and ages may help improve their willingness to exercise. A diabetic may be able to see the trends of food consumption and relevant criteria of other diabetics in order to help make an informed decision to improve eating habits. 6.2.1.6
Intelligent sensors with Quality of Service (QoS)
Apart from sensors attached in or on a body, sensors may be installed as part of a furniture or a room and designed to wirelessly monitor information such as body temperature and other health data of the person inside. These sensors have the potential to be smarter than sensors on the body as they have greater access to power and other resources whilst out of the body. By expanding the WBAN network to include a defined physical space rather than the dynamic area around a person only, sensors do not necessarily have to be in or on the body which may be intrusive to the wearer while they are in that space such as a hospital room. This will expand security capabilities as well as increasing QoS issues. QoS can also be implemented with smart sensors which will have computational and power capacity. For example,
171
information related to vital signs should be transmitted with priority over other traffic using the same connection such as IoT and personal computers. 6.2.2
Prediction of personal life expectancy
As an outcome and application of health status on a personal basis and emerging technologies utilising health data for data mining for prediction [48], this thesis proposes a possible application model which can be further studied. It is possible to predict personal life expectancy as in Figure 6.1 which can be used to calculate a generic health status index for health statistics. Personal life expectancy
Health status
F E
Health status prediction
C A birth
Generic life expectancy
D B
death
Age
Figure 6.1 Health Status and personalised Life Expectancy
Figure 6.1 depicts a generic life expectancy and personal health status predicted by the outcome of inference. The generic life expectancy is obtained by big data which analyses and processes information from multiple sources. This populates the closest graph that is similar to the individual in terms of their personal attributes such as age, sex, race, living environment, disease and lifestyle factors. For example, the generic life expectancy may be populated to model a non-smoking 40 year old Ethiopian male living in Africa with diabetes and obesity with a genetic history of cancer. This can be compared with the personal life expectancy (red line) of the individual who fits the same characteristics as the group forming the generic life expectancy (black line). For example, at point A, the user gets ill and the health status goes down until they recover at C followed by another case up to full recovery at E. At the present time F, the future health status can be predicted by inferring health information. Whilst personal life expectancy shows the overall pattern of health status history and prediction, the detailed graph from points A to E can show a low level detail of health status as to whether it is getting better or worse. F(x) =
d(AB) d(x)
, where x = age
172
Equation 13 Health status
For example the equation above implies an individual’s health status is getting worse (illness) when F(x) < 0, whilst 𝐹(𝑥) > 0 means that it is getting better (recovery). Labels B and D represent a period of illness, and the sum illness cycle is the number and duration of illness days, which can be reflected into a health status index if required. Inferring data context should consider and use the information held in its database as well as those received from external parties such as from MCs or CTs. The health status of the user may be different from public mean statistics and thresholds. The physician should continuously assess the proper health threshold for the user as individuals’ situations can be different from the normal threshold. A user profile includes all previous and current metrics of health data. Combined data affects the results of inference such as various combinations of sensed data that may be dependent on each other. For instance, insulin levels can affect high blood pressure and vice versa as they are related variables. Therefore, a single sensed data should be interpreted with other related information in the same class to decide an action such as triggering an urgent alarm before the onset of a health failure. As time goes by, the profile data of a user is optimised as a result of obtaining many inferences over a long period. This information is used as an input to a physician’s database as information that can be used to calculate the personal health status of the user. As databases in sensor nodes are updated with realistic corrections, data can be analysed more efficiently and provide information about an individual’s health status faster. Smartphones (PTs) play a key role in communicating with MC and CT and IoT networks when they have received information from sensor nodes both as a manager of mHealth network architecture and as an agent of an IoT network. This proposal shows a new approach to an idea of developing personal life expectancy predictions and real-time health status calculations via inferring data context in sensors nodes along with those that can be worked out in the cloud using big data. Inference is done in sensor nodes to control health data to IoT as well as in the cloud. Health service users can use smartphone apps to trace health history and status as well as future predictions based on the inferred information by big data and application software on their smartphones. Smart sensors control the frequency of data collection and what and when to transmit it to requestors such as physicians or IoT devices which may then use the information for smart environments such as a smart home, smart
173
highway or smart city. Body sensors converged with other upcoming technologies such as the cloud, big data and IoT will allow for healthier lifestyles that are affordable to many. This is combined with their benefits in creating comfortable living and working environments by sharing physiological information with ‘things’ of IoT that may be fixed or mobile devices. Strong security measures are required in WBAN body sensor nodes to protect privacy and to prevent the misuse of health information as attacks may threaten the life of the user. Developing frameworks, algorithms and logics on health status calculations for individual and generic cases need to be done. This is necessary to assess, process and create meaningful and valuable information from the health data of individuals and groups. This has not yet been achieved as network infrastructure and technological collaborations are still in the process of development. 6.2.3
Data integrity and accessibility
After health data is transferred to a physician, it is logical to ask how much trust should be given the data received from sensor nodes. It is required to investigate how the inference system should consider abnormal situations to determine the validity of data and to research how to ensure secure storing of the data while also allowing for quick access in emergency situations. Needless to say, medical practitioners prefer to consult their patients face to face to receive their complaints before providing their professional opinion. However, in a situation where they are not able to physically see their patient, they have to rely on the data that is available. Moreover, it is likely that they will request more data if they think the data are old and insufficient to use as the condition of the patient could change every minute. In this case, it may be more useful if they can obtain a history of the data such as ones collected in the past 24 hours or longer as the physician sees appropriate. Paramedics should also be able to access the health data of patients with a simple authentication key in an emergency situation. Sensors may not be able to store large volumes of data, and therefore there needs to be a way to store and provide that information when requested, such as on a smartphone in a secured manner. There are several issues in this case. 1. How to provide ease of data access in an urgent situation as well as ensuring the security of the data at the same time. Paramedics have a requirement to access
174
and capture data quickly without a complicated procedure that may be delayed by security processes. 2. How much trust the physician should give to the data received from the sensor nodes. For example they may not know how long the data has been stored for or how it has changed since the last recorded capture. Thus there must be a mechanism to indicate the validity of the stored data in the smartphone. 3. How to convince physicians to trust and use the data for their treatment. Technology will be useless unless they can trust and use it in their line of work. Thus education and training are important to any new technology. 6.2.4
Data and network management
When IoT and mHealth networks have been fully deployed, service providers would want to see the status of every device and their serviceability so that they can manage and maintain their networks and services. Apart from other networks such as WSNs, it may not be convenient for a WBAN to have a separate network management system within and the smartphone will be required to perform this role. This means that service providers will be required to rely on personal devices that could present untrusted and unreliable service and network security issues. In this case, they may not be able to provide full network management services such as software updates of sensors, remote registration, turning them on or off remotely, statistics and measurements. 6.2.5
Data processing and mining in cloud
The more sensors used to detect AR status of a human body, the more accurate the result will be, however, the implications are an increase in resources and additional costs that are required to support the number of devices. Whilst we propose to utilise physiological sensors to increase the accuracy of the AR status, it is still required to know and optimise what kind of information the service providers would require to provide useful services. To achieve this goal, more finely proved physiological data corresponding to each activity on a personalised basis is required as a generic threshold cannot be applied as a blanket threshold for every user. This requires the processing and analysis of a huge amount of data in the cloud using similar sampled groups for a user based on characteristics such as gender, race, age, country and
175
ethnic groups. It is expected and demanded to provide future forecast of health status for individuals before a situation occurs as some physiological data can act as signs of forthcoming problems. It is quite possible to know their situation through activity monitoring. When they combine the existing method with this proposed solution of using sensed data to determine the situation and activity, the accuracy is expected to increase e.g. 82% as demonstrated by [151] for instance. How this solution can be applied onto existing methods remains for further research.
176
REFERENCES [1]
D. Bragg, M. Yun, H. Bragg, and H.-A. Choi, "Intelligent Transmission of Patient Sensor Data in Wireless Hospital Networks," in AMIA Annual Symposium Proceedings, 2012, p. 1139.
[2]
R. v. d. Meulen. Gartner Says 6.4 Billion Connected "Things" Will Be in Use in 2016, Up 30 Percent From 2015 [Newsroom Press Release]. Available: http://www.gartner.com/newsroom/id/3165317, [Accessed: 22 June 2016]
[3]
S. Adibi, "Link Technologies and BlackBerry Mobile Health (mHealth) Solution - A Review," IEEE TRANSACTIONS ON INFORMATION TECHNOLOGY IN BIOMEDICINE, vol. 16, 2012.
[4]
M. Rushanan, A. D. Rubin, D. F. Kune, and C. M. Swanson, "SoK: Security and Privacy in Implantable Medical Devices and Body Area Networks," in 2014 IEEE Symposium on Security and Privacy, 2014, pp. 524-539.
[5]
Citrix.
Mobile
Analytics
Report
2015.
Available:
https://www.citrix.com/content/dam/citrix/en_us/documents/productssolutions/citrix-mobile-analytics-report-february-2015.pdf, [Accessed: 13 May 2016] [6]
M. Essany. Infographic: Are You Ready for Sensors in Healthcare? Available: http://mhealthwatch.com/infographic-are-you-ready-for-sensorsin-healthcare-25313/, [Accessed: 13 May 2016]
[7]
G. Slabodkin. mHealth devices must auto-collect data from cloud, sensors. Available:
http://www.fiercemobilehealthcare.com/story/mhealth-devices-
must-auto-collect-data-cloud-sensors/2014-01-30, [Accessed: 13 May 2016] [8]
J. Zheng and A. Jamalipour, Wireless sensor networks: a networking perspective: John Wiley & Sons, 2009.
[9]
J. J. Kang and S. Adibi, "A Review of Security Protocols in mHealth Wireless Body Area Networks (WBAN)," in International Conference on Future Network Systems and Security 2015, Paris, France, 2015, pp. 61-83.
[10]
S.
Adibi,
"mHealth
Multidisciplinary
Verticals,"
in
mHealth
Multidisciplinary Verticals, S. Adibi, Ed.: CRC Press, 2014, pp. 1-10.
177
[11]
S. Adibi, "An application layer non-repudiation wireless system: A crosslayer approach," in World of Wireless Mobile and Multimedia Networks (WoWMoM), 2010 IEEE International Symposium on a, 2010, pp. 1-2.
[12]
Australian Government Department of Health. Middle East Respiratory Syndrome (MERS). Important information for health professionals and the general
public
on
MERS.
Available:
http://www.health.gov.au/internet/main/publishing.nsf/Content/ohp-merscov.htm, [Accessed: 2 October 2016] [13]
The Korean Society of Infectious Diseases and Korean Society for Healthcare-associated Infection Control Prevention, "The Same Middle East Respiratory Syndrome-Coronavirus (MERS-CoV) yet Different Outbreak Patterns and Public Health Impacts on the Far East Expert Opinion from the Rapid Response Team of the Republic of Korea," Infection & Chemotherapy, vol. 47, pp. 247-251, 2015.
[14]
J. Evans, "Pandemics and national security," Global Security Studies, vol. 1, pp. 100-109, 2010.
[15]
S. Adibi, "Contactless Biomedical Sensing for Vehicular Applications," 2012.
[16]
N. Ralph. Apple Watch specs vs. Moto 360, LG G Watch R, Samsung Gear S. Available:
http://www.cnet.com/au/news/apple-watch-specs-versus-moto-
360-lg-g-watch-r-samsung-gear-s/, [Accessed: 28 August 2015] [17]
LG. LG G Watch R (W110). Available: http://www.lg.com/au/fitness-andwearables/lg-G-Watch-R-W110/technical-specifications,
[Accessed:
28
August 2015] [18]
GSMArena.
Samsung
Gear
S3
Classic.
Available:
http://www.gsmarena.com/samsung_gear_s3_classic-8309.php, [Accessed: 12 September 2016] [19]
Apple. Apple Watch Series 2 - Technical Specifications. Available: https://support.apple.com/kb/SP746?locale=en_US,
[Accessed:
12
September 2016] [20]
GSMArena.
LG
Watch
Urbane
2nd
Edition
LTE.
Available:
http://www.gsmarena.com/lg_watch_urbane_2nd_edition_lte-7607.php, [Accessed: 12 September 2016] [21]
J. J. Kang, S. Adibi, H. Larkin, and T. Luan, "Predictive data mining for Converged Internet of Things: A Mobile Health perspective," in
178
Telecommunication Networks and Applications Conference (ITNAC), 2015 International, 2015, pp. 5-10. [22]
J. J. Kang and H. Larkin, "Inference of Personal Sensors in the Internet of Things," International Journal of Information, Communication Technology and Applications, vol. 2, 2016.
[23]
G. Fortino, R. Giannantonio, R. Gravina, P. Kuryloski, and R. Jafari, "Enabling Effective Programming and Flexible Management of Efficient Body Sensor Network Applications," IEEE Transactions on HumanMachine Systems, vol. 43, pp. 115-133, 2013.
[24]
J. J. Kang, T. Luan, and H. Larkin, "Data Processing of Physiological Sensor Data
and
Alarm
Determination
Utilising
Activity
Recognition,"
International Journal of Information, Communication Technology and Applications, vol. 2, p. 24, 2016-09-24 2016. [25]
F. Fernandez and G. C. Pallis, "Opportunities and challenges of the Internet of Things for healthcare: Systems engineering perspective," in Wireless Mobile Communication and Healthcare (Mobihealth), 2014 EAI 4th International Conference on, 2014, pp. 263-266.
[26]
M.
Brain.
A
Typical
Mote
-
How
Motes
Work.
Available:
http://computer.howstuffworks.com/mote4.htm, [Accessed: 15 June 2016] [27]
JLH
Labs.
Available:
http://www.jlhlabs.com/jhill_cs/spec/index.htm,
[Accessed: 22 August 2015] [28]
M.
Rouse.
machine-to-machine
(M2M).
Available:
http://internetofthingsagenda.techtarget.com/definition/machine-tomachine-M2M, [Accessed: 27 September 2016] [29]
B. J. Oates, Researching information systems and computing. London SAGE, 2006.
[30]
R. A. Fisher, The design of experiments, 7th ed. Edinburgh: Oliver & Boyd, 1960.
[31]
R. E. Kirk, "Experimental design," Sage handbook of quantitative methods in psychology, pp. 23-45, 2009.
[32] NHMRC, "National Statement on Ethical Conduct in Human Research (2007) - Updated May 2015," ed: Australian Government National Health and Medical Research Council, 2015.
179
[33]
D. W. Cheun, "A Framework for Controlling Internet of Things Devices and Inference with Contexts," PhD, Soongsil University, 2012.
[34]
K. Aberer, M. Hauswirth, and A. Salehi, "Infrastructure for Data Processing in Large-Scale Interconnected Sensor Networks," in 2007 International Conference on Mobile Data Management, 2007, pp. 198-205.
[35]
K. Sohrabi, J. Gao, V. Ailawadhi, and G. J. Pottie, "Protocols for selforganization of a wireless sensor network," IEEE personal communications, vol. 7, pp. 16-27, 2000.
[36]
W. R. Heinzelman, A. Chandrakasan, and H. Balakrishnan, "Energy-efficient communication protocol for wireless microsensor networks," in System sciences, 2000. Proceedings of the 33rd annual Hawaii international conference on, 2000, p. 10 pp. vol. 2.
[37]
A. Manjeshwar and D. P. Agrawal, "TEEN: A Routing Protocol for Enhanced Efficiency in Wireless Sensor Networks," in IPDPS, 2001, p. 189.
[38]
M. A. Osborne, S. J. Roberts, A. Rogers, S. D. Ramchurn, and N. R. Jennings, "Towards real-time information processing of sensor network data using computationally efficient multi-output Gaussian processes," in Proceedings of the 7th international conference on Information processing in sensor networks, 2008, pp. 109-120.
[39]
C. W. Gardiner, Handbook of stochastic methods vol. 3: Springer Berlin, 1985.
[40]
A. J. Jara, M. A. Zamora-Izquierdo, and A. F. Skarmeta, "Interconnection Framework for mHealth and Remote Monitoring Based on the Internet of Things," Selected Areas in Communications, IEEE Journal on, vol. 31, pp. 47-65, 2013.
[41]
A. Borodin, Y. Zavyalova, A. Zaharov, and I. Yamushev, "Architectural approach to the multisource health monitoring application design," in Open Innovations Association (FRUCT), 2015 17TH Conference of, 2015, pp. 1621.
[42]
S. M. Riazul Islam, K. Daehan, M. Humaun Kabir, M. Hossain, and K. Kyung-Sup, "The Internet of Things for Health Care: A Comprehensive Survey," Access, IEEE, vol. 3, pp. 678-708, 2015.
180
[43]
G. Sebestyen, A. Hangan, S. Oniga, and Z. Gal, "eHealth solutions in the context of Internet of Things," in Automation, Quality and Testing, Robotics, 2014 IEEE International Conference on, 2014, pp. 1-6.
[44]
I. Akyildiz, M. Pierobon, S. Balasubramaniam, and Y. Koucheryavy, "The internet of Bio-Nano things," Communications Magazine, IEEE, vol. 53, pp. 32-40, 2015.
[45]
A. Santos, J. Macedo, A. Costa, and M. J. Nicolau, "Internet of Things and Smart Objects for M-health Monitoring and Control," Procedia Technology, vol. 16, pp. 1351-1360, 2014.
[46]
IEEE, "Health informatics--Personal health device communication - Part 20601: Application profile- Optimized Exchange Protocol," IEEE Std 1107320601-2014 (Revision of ISO/IEEE 11073-20601:2010), pp. 1-253, 2014.
[47]
A. S. Almogren, "Developing a Powerful and Resilient Smart Body Sensor Network through Hypercube Interconnection," International Journal of Distributed Sensor Networks, vol. 2015, p. 8, 2015.
[48]
H. Banaee, M. U. Ahmed, and A. Loutfi, "Data mining for wearable sensors in health monitoring systems: a review of recent trends and challenges," Sensors, vol. 13, pp. 17472-17500, 2013.
[49]
V. D. Poorani, K. Ganapathy, and V. Vaidehi, "Sensor based decision making inference system for remote health monitoring," Recent Trends In Information Technology (ICRTIT), 2012 International Conference on, pp. 337-342, 2012.
[50]
V. J. L. Engel and S. H. Supangkat, "Context-aware inference model for coldchain logistics monitoring," in ICT For Smart Society (ICISS), 2014 International Conference on, 2014, pp. 192-196.
[51]
X. Zhu, K. Fang, and W. Yongheng, "Predictive Analytics by Using Bayesian Model Averaging for Large-Scale Internet of Things," International Journal of Distributed Sensor Networks, pp. 1-10, 2013.
[52]
Y. Xiang and Y. Liu, "Application of inverse first-order reliability method for probabilistic fatigue life prediction," Probabilistic Engineering Mechanics, vol. 26, pp. 148-156, 2011.
[53]
A. Raftery, J. Chunn, P. Gerland, and H. Ševčíková, "Bayesian Probabilistic Projections of Life Expectancy for All Countries," Demography, vol. 50, pp. 777-801, 2013.
181
[54]
P. D. Haghighi, A. Perera, M. Indrawan-Santiago, and T. M. Huynh, "Situation-aware mobile health monitoring," in Proceedings of the 11th International Conference on Mobile and Ubiquitous Systems: Computing, Networking and Services, London, United Kingdom, 2014, pp. 248-256.
[55]
C. T. Zan, "An Improved Symbolic Aggregate Approximation Distance Measure Based On Its Statistical Features," in The 18th International Conference on Information Integration and Web-based Applications & Services (iiWAS2016), Singapore, 2016, p. 74.
[56]
E. Harahap, J. Wijekoon, R. Tennekoon, F. Yamaguchi, S. Ishida, and H. Nishi, "A router-based management system for prediction of network congestion," in Advanced Motion Control (AMC),2014 IEEE 13th International Workshop on, 2014, pp. 398-403.
[57]
Y.-B. Lin, Y.-W. Lin, C.-Y. Chih, T.-Y. Li, C.-C. Tai, Y. Wang, et al., "EasyConnect: A Management System for IoT Devices and Its Applications for Interactive Design and Art," Internet of Things Journal, IEEE, pp. 1-1, 2015.
[58]
S. Zhengguo, C. Mahapatra, Z. Chunsheng, and V. C. M. Leung, "Recent Advances in Industrial Wireless Sensor Networks Toward Efficient Management in IoT," Access, IEEE, vol. 3, pp. 622-637, 2015.
[59]
M. Abu-Elkheir, K. Heurtefeux, N. Abu Ali, and H. Menouar, "Hybrid data management system for mHealth," in Wireless Mobile Communication and Healthcare (Mobihealth), 2014 EAI 4th International Conference on, 2014, pp. 242-245.
[60]
J. M. Bohli, A. Skarmeta, M. Victoria Moreno, D. Garcia, and P. Langendorfer, "SMARTIE project: Secure IoT data management for smart cities," in Recent Advances in Internet of Things (RIoT), 2015 International Conference on 2015, pp. 1-6.
[61]
R. K. Kodali, "Key management technique for WSNs," in Region 10 Symposium, 2014 IEEE, 2014, pp. 540-545.
[62]
K. Knorr and D. Aspinall, "Security testing for Android mHealth apps," in Software Testing, Verification and Validation Workshops (ICSTW), 2015 IEEE Eighth International Conference on 2015, pp. 1-8.
182
[63]
B. Jack. "Broken Hearts": How plausible was the Homeland pacemaker hack? . Available: http://blog.ioactive.com/2013/02/broken-hearts-howplausible-was.html, [Accessed: 7 September 2015]
[64]
B. Zadrozny. The Good Hacker: Barnaby Jack Dies. Available: http://www.thedailybeast.com/articles/2013/07/26/the-good-hackerbarnaby-jack-dies.html, [Accessed: 13 May 2016]
[65]
A. Kahate, Cryptography and network security: Tata McGraw-Hill Education, 2013.
[66]
National Institute of Standards and Technology, "Security Requirements for Cryptographic Modules," in Federal Information Processing Standard Publication 140-2 vol. 25, ed. Gaithersburg, Maryland, 2001.
[67]
D.
Spill.
Ubertooth.
Available:
https://github.com/greatscottgadgets/ubertooth/wiki, [Accessed: 16 May 2016] [68]
S. Adibi, "A multilayer non-repudiation system: a Suite-B approach," Security and Communication Networks, p. 1698, 2015.
[69]
C. Gentry, S. Halevi, and N. P. Smart, "Fully homomorphic encryption with polylog overhead," in Annual International Conference on the Theory and Applications of Cryptographic Techniques, 2012, pp. 465-482.
[70]
A. Shelat, S. Hohenberger, S. Myers, and R. Pass, "Minimizing Overhead for Secure Computation and Fully Homomorphic Encryption: Overhead," DTIC Document2015.
[71]
O. D. Lara and M. A. Labrador, "A Survey on Human Activity Recognition using Wearable Sensors," IEEE Communications Surveys & Tutorials, vol. 15, pp. 1192-1209, 2013.
[72]
E. Munguia Tapia, "Using machine learning for real-time activity recognition and estimation of energy expenditure," Massachusetts Institute of Technology, 2008.
[73]
T. Fujimoto, H. Nakajima, N. Tsuchiya, H. Marukawa, K. Kuramoto, S. Kobashi,
et
al.,
"Wearable
Human
Activity
Recognition
by
Electrocardiograph and Accelerometer," in Multiple-Valued Logic (ISMVL), 2013 IEEE 43rd International Symposium on, 2013, pp. 12-17. [74]
S. Chernbumroong, A. S. Atkins, and H. Yu, "Activity classification using a single wrist-worn accelerometer," in Software, Knowledge Information,
183
Industrial Management and Applications (SKIMA), 2011 5th International Conference on, 2011, pp. 1-6. [75]
Y. Chen, M. Guo, and Z. Wang, "An improved algorithm for human activity recognition using wearable sensors," in 2016 Eighth International Conference on Advanced Computational Intelligence (ICACI), 2016, pp. 248-252.
[76]
Z. S. Abdallah, M. M. Gaber, B. Srinivasan, and S. Krishnaswamy, "StreamAR: Incremental and Active Learning with Evolving Sensory Data for Activity Recognition," in 2012 IEEE 24th International Conference on Tools with Artificial Intelligence, 2012, pp. 1163-1170.
[77]
T. Miu, P. Missier, and T. Plotz, "Bootstrapping Personalised Human Activity Recognition Models Using Online Active Learning," in Computer and Information Technology; Ubiquitous Computing and Communications; Dependable, Autonomic and Secure Computing; Pervasive Intelligence and Computing
(CIT/IUCC/DASC/PICOM),
2015
IEEE
International
Conference on, 2015, pp. 1138-1147. [78]
J. H. Hong, J. Ramos, and A. K. Dey, "Toward Personalized Activity Recognition Systems With a Semipopulation Approach," IEEE Transactions on Human-Machine Systems, vol. 46, pp. 101-112, 2016.
[79]
P. Arnon, "Classification model for multi-sensor data fusion apply for Human Activity Recognition," in Computer, Communications, and Control Technology (I4CT), 2014 International Conference on, 2014, pp. 415-419.
[80]
W. Tang and E. S. Sazonov, "Highly Accurate Recognition of Human Postures and Activities Through Classification With Rejection," IEEE Journal of Biomedical and Health Informatics, vol. 18, pp. 309-315, 2014.
[81]
I. Orha and S. Oniga, "Activity recognition using an e-textile data acquisition system," in Design and Technology in Electronic Packaging (SIITME), 2015 IEEE 21st International Symposium for, 2015, pp. 335-339.
[82]
P. Dohnalek, P. Gajdos, and T. Peterek, "Human activity recognition on raw sensor data via sparse approximation," in Telecommunications and Signal Processing (TSP), 2013 36th International Conference on, 2013, pp. 700-703.
[83]
L. Zhang, X. Wu, and D. Luo, "Improving activity recognition with context information," in 2015 IEEE International Conference on Mechatronics and Automation (ICMA), 2015, pp. 1241-1246.
184
[84]
C. Gao, H. Xu, J. Hu, and Y. Zhou, "Ar-tracker: Track the dynamics of mobile apps via user review mining," in Service-Oriented System Engineering (SOSE), 2015 IEEE Symposium on, 2015, pp. 284-290.
[85]
N. Győrbíró, Á. Fábián, and G. Hományi, "An Activity Recognition System For Mobile Phones," Mobile Networks & Applications, vol. 14, pp. 82-91, 2009.
[86]
L. Bao and S. S. Intille, "Activity recognition from user-annotated acceleration data," in Pervasive computing: Springer, 2004, pp. 1-17.
[87]
D. Roggen, K. Forster, A. Calatroni, T. Holleczek, Y. Fang, G. Troster, et al., "OPPORTUNITY: Towards opportunistic activity and context recognition systems," in World of Wireless, Mobile and Multimedia Networks & Workshops, 2009. WoWMoM 2009. IEEE International Symposium on a, 2009, pp. 1-6.
[88]
E. Kim, S. Helal, and D. Cook, "Human Activity Recognition and Pattern Discovery," IEEE Pervasive Computing, vol. 9, pp. 48-53, 2010.
[89]
D. Tran and A. Sorokin, "Human activity recognition with metric learning," in European conference on computer vision, 2008, pp. 548-561.
[90]
C. Liming, C. D. Nugent, and W. Hui, "A knowledge-driven approach to activity recognition in smart homes," IEEE Transactions on Knowledge and Data Engineering, p. 961, 2012.
[91]
Y. Wang, J. Lin, M. Annavaram, Q. A. Jacobson, J. Hong, B. Krishnamachari, et al., "A framework of energy efficient mobile sensing for automatic user state recognition," in Proceedings of the 7th international conference on Mobile systems, applications, and services, 2009, pp. 179-192.
[92]
S. Saleem, S. Ullah, and K. S. Kwak, "A study of IEEE 802.15.4 security framework for wireless body area networks," Sensors (Basel, Switzerland), vol. 11, pp. 1383-1395, 2011.
[93]
Gagandeep and Aashima, "Study on Sinkhole Attacks in Wireless Ad hoc Networks," International Journal on Computer Science and Engineering, p. 1078, 2012.
[94]
V. P. Singh, A. S. A. Ukey, and S. Jain, "Signal strength based hello flood attack detection and prevention in wireless sensor networks," International Journal of Computer Applications, vol. 62, 2013.
185
[95]
I. Rec, "X. 800 security architecture for open systems interconnection for ccitt applications," ITU-T (CCITT) Recommendation, 1991.
[96]
T. Chia, "Confidentiality, Integrity, and Availability: The Three Components of the CIA Triad," IT Security Community Blog, 2012.
[97]
A. S. Uluagac, C. P. Lee, R. A. Beyah, and J. A. Copeland, "Designing secure protocols for wireless sensor networks," in Wireless Algorithms, Systems, and Applications: Springer, 2008, pp. 503-514.
[98]
X. Recommendation, "805 Security architecture for systems providing endtoend communications," ITU-T Lead Study Group on Telecommunication Security, 2003.
[99]
A. Sunyaev, T. Dehling, P. L. Taylor, and K. D. Mandl, "Availability and quality of mobile health app privacy policies," Journal of the American Medical Informatics Association, vol. 22, pp. 28-33, 2015.
[100] W. Stallings, Cryptography and Network Security, 4th ed.: Pearson Education India, 2006. [101] Z. Xi, L. Li, G. Shi, and S. Wang, "A Comparative Study of Encryption Algorithms in Wireless Sensor Network," in Wireless Communications, Networking and Applications: Springer, 2016, pp. 1087-1097. [102] G. J. Simmons, "Symmetric and asymmetric encryption," ACM Computing Surveys (CSUR), vol. 11, pp. 305-330, 1979. [103] S. Irum, A. Ali, F. A. Khan, and H. Abbas, "A hybrid security mechanism for intra-WBAN and inter-WBAN communications," International Journal of Distributed Sensor Networks, 2013. [104] M. Faisal, J. Al-Muhtadi, and A. Al-Dhelaan, "Integrated protocols to ensure security services in wireless sensor networks," International Journal of Distributed Sensor Networks, 2013. [105] R. Krohn and D. Metcalf, mHealth Innovation: Best Practices from The Mobile Frontier: HIMSS, 2014. [106] S. Ullah, M. Mohaisen, and M. A. Alnuem, "A review of IEEE 802.15. 6 MAC, PHY, and security specifications," International Journal of Distributed Sensor Networks, 2013. [107] IEEE Standards Association, "IEEE standard for local and metropolitan area networks-part 15.6: wireless body area networks," IEEE Standard for Information Technology, IEEE, vol. 802, pp. 1-271, 2012.
186
[108] M. Toorani, "On vulnerabilities of the security association in the IEEE 802.15. 6 standard," in Financial Cryptography and Data Security: Springer, 2015, pp. 245-260. [109] M. Toorani and A. Beheshti, "LPKI-a lightweight public key infrastructure for the mobile environments," in Communication Systems, 2008. ICCS 2008. 11th IEEE Singapore International Conference on, 2008, pp. 162-166. [110] P. K. Sahoo, "Efficient security mechanisms for mHealth applications using wireless body sensor networks," Sensors, vol. 12, pp. 12606-12633, 2012. [111] N. Nasser and Y. Chen, "SEEM: Secure and energy-efficient multipath routing protocol for wireless sensor networks," Computer Communications, vol. 30, pp. 2401-2412, 2007. [112] Australian Government Department of Defence. DSD approval for the use of Suite B cryptography for CONFIDENTIAL and above. Available: http://www.asd.gov.au/publications/broadcast/20130100-suite-b-cryptoapproved.htm, [Accessed: 17 May 2016] [113] R. C. Sanderson, "TRUSTED COMPUTING USING IPSEC MINIMUM ESSENTIAL INTEROPERABILITY PROTOCOLS," presented at the 2nd NSA Trusted Computing Conference, Orlando, 2011. [114] Cisco.
Cisco
Next-Generation
Communications
and
Cryptography:
Enable
Collaboration.
Secure Available:
http://www.cisco.com/c/dam/en_us/solutions/industries/docs/gov/CIS44830_Suite-B_Whitepaper_1c-hi_res.pdf, [Accessed: 17 May 2016] [115] M. Campagna, "A Cryptographic Suite for Embedded Systems (SuiteE)," in 6th ETSI Security Workshop, Sophia Antipolis, France, 2011. [116] W. Kou, Networking security and standards vol. 394: Springer Science & Business Media, 2012. [117] N. Q. Mehmood and R. Culmone, "An ANT+ Protocol Based Health Care System," 2015 IEEE 29th International Conference on Advanced Information Networking & Applications Workshops, p. 193, 2015. [118] Y. Kim, S. Lee, and S. Lee, "Coexistence of ZigBee-Based WBAN and WiFi for Health Telemonitoring Systems," IEEE Journal of Biomedical & Health Informatics, vol. 20, pp. 222-230, 2016. [119] A. Alliance. What is zigbee? Available: http://www.zigbee.org/what-iszigbee/, [Accessed: 7 June 2016]
187
[120] G. V. Crosby, T. Ghosh, R. Murimi, and C. A. Chin, "Wireless body area networks for healthcare: a survey," International Journal of Ad Hoc, Sensor & Ubiquitous Computing, vol. 3, p. 1, 2012. [121] M. Siekkinen, M. Hiienkari, J. K. Nurminen, and J. Nieminen, "How low energy is bluetooth low energy? comparative measurements with zigbee/802.15. 4," in Wireless Communications and Networking Conference Workshops (WCNCW), 2012 IEEE, 2012, pp. 232-237. [122] J. Decuir, "Bluetooth 4.0: low energy," Cambridge, UK: Cambridge Silicon Radio SR plc, vol. 16, 2010. [123] A. Dementyev, S. Hodges, S. Taylor, and J. Smith, "Power consumption analysis of Bluetooth Low Energy, ZigBee and ANT sensor nodes in a cyclic sleep scenario," in Wireless Symposium (IWS), 2013 IEEE International, 2013, pp. 1-4. [124] R. Nilsson. Bluetooth Low Energy Technology Makes New Applications Possible. Available: http://www.connectblue.com/press/articles/bluetoothlow-energy-technology-makes-new-applications-possible/, [Accessed: 18 May 2016] [125] R. Nilsson and B. Saltzstein, "Bluetooth Low Energy vs. Classic Bluetooth: Choose the Best Wireless Technology For Your Application," Medical Electronics Design, 2012. [126] IEEE, "PHD - Personal Health Device," ed: IEEE, 2014. [127] "Health informatics - Personal health device communication Part 00103: Overview," IEEE Std 11073-00103-2012, pp. 1-80, 2012. [128] L. J. Vorvick, "Vital signs," U.S. National Library of Medicine, 2015. [129] B.
P.
UK.
Blood
pressure
chart.
Available:
http://www.bloodpressureuk.org/BloodPressureandyou/Thebasics/Bloodpre ssurechart, [Accessed: 6 October 2016] [130] L.
Sheldon.
Normal
Heart
Rate
When
Walking.
Available:
http://www.livestrong.com/article/401591-normal-heart-rate-when-walking/, [Accessed: 4 March 2016] [131] D. Longo, A. Fauci, D. Kasper, S. Hauser, L. Jameson, and J. Loscalzo, Harrison's principles of internal medicine. New York, United States: McGraw-Hill Education, 2011.
188
[132] W. F. Ganong and K. E. Barrett, Review of medical physiology: Appleton & Lange Norwalk, CT, 1995. [133] Cisco. Real-Time Traffic over Wireless LAN Solution Reference Network Design
Guide.
Available:
http://www.cisco.com/c/en/us/td/docs/solutions/Enterprise/Mobility/RToW LAN/CCVP_BK_R7805F20_00_rtowlansrnd/CCVP_BK_R7805F20_00_rtowlan-srnd_chapter_011.html, [Accessed: 7 October 2016] [134] C. L. Lim, C. Byrne, and J. K. Lee, "Human Thermoregulation and Measurement of Body Temperature in Exercise and Clinical Settings," Ann Acad Med Singapore, vol. 37, pp. 347-53, 2008. [135] D. Izadi, "Enhancing Wireless Sensor Networks Functionalities," PhD, Deakin University, 2014. [136] F. Xia, "QoS challenges and opportunities in wireless sensor/actuator networks," Sensors, vol. 8, pp. 1099-1110, 2008. [137] Laerd
Statistics.
Standard
Deviation.
Available:
https://statistics.laerd.com/statistical-guides/measures-of-spread-standarddeviation.php, [Accessed: 12 September 2016] [138] E.
R.
Laskowski.
Heart
rate:
What's
normal?
Available:
http://www.mayoclinic.org/healthy-lifestyle/fitness/expert-answers/heartrate/faq-20057979, [Accessed: 9 September 2016] [139] B. M. Bass, D. R. Henderson, E. H.-C. Ku, S. J. Lemke, J. M. Rash, L. B. Reiss, et al., "Simultaneous cut through and store-and-forward frame support in a network device," ed: Google Patents, 2000. [140] I. Orha and S. Oniga, "Study regarding the optimal sensors placement on the body for human activity recognition," in Design and Technology in Electronic Packaging (SIITME), 2014 IEEE 20th International Symposium for, 2014, pp. 203-206. [141] L. Atallah, B. Lo, R. King, and G. Z. Yang, "Sensor Positioning for Activity Recognition Using Wearable Accelerometers," IEEE Transactions on Biomedical Circuits and Systems, vol. 5, pp. 320-329, 2011. [142] P. Zappi, T. Stiefmeier, E. Farella, D. Roggen, L. Benini, and G. Troster, "Activity recognition from on-body sensors by classifier fusion: sensor
189
scalability and robustness," in Intelligent Sensors, Sensor Networks and Information, 2007. 3rd International Conference on, 2007, pp. 281-286. [143] Gartner.com.
Gartner
Says
4.9
Billion
Connected.
Available:
http://www.gartner.com/newsroom/id/2905717, [Accessed: 20 May 2015] [144] A. Pantelopoulos and N. G. Bourbakis, "A Survey on Wearable Sensor-Based Systems for Health Monitoring and Prognosis," Systems, Man, and Cybernetics, Part C: Applications and Reviews, IEEE Transactions on, vol. 40, pp. 1-12, 2010. [145] P. A. Mackowiak, "Temperature regulation and the pathogenesis of fever," Principles and practice of infectious diseases, vol. 6, pp. 703-718, 2000. [146] M. J. Karvonen, E. Kentala, and O. Mustala, "The effects of training on heart rate: a longitudinal study," JPAH, vol. 4, 2010. [147] R.
Wood.
Heart
Rate
Karvonen
Formula.
Available:
http://www.topendsports.com/fitness/karvonen-formula.htm, [Accessed: 13 October 2016] [148] R.
Wood.
Resting
Heart
Rate
Chart.
Available:
http://www.topendsports.com/testing/heart-rate-resting-chart.htm, [Accessed: 8 October 2016] [149] N. Evans, S. Marcel, A. Ross, and A. B. J. Teoh, "Biometrics Security and Privacy Protection," IEEE Signal Processing Magazine, vol. 32, p. 17, 2015. [150] J. Portilla, A. Otero, E. de la Torre, T. Riesgo, O. Stecklina, S. Peter, et al., "Adaptable security in wireless sensor networks by using reconfigurable ECC hardware coprocessors," International Journal of Distributed Sensor Networks, 2010. [151] A. Purwar, J. Do un, and C. Wan Young, "Activity monitoring from real-time triaxial accelerometer data using sensor network," in Control, Automation and Systems, 2007. ICCAS '07. International Conference on, 2007, pp. 24022406.
190
APPENDIX A. TEST PREPARATION AND SETUP A1: Data Population Request: data export from Fitbit server GET /1/user/-/activities/heart/date/2016-05-06/1d/1sec.json HTTP/1.1 Authorization: OAuth oauth_consumer_key="b54a8e0fe4314969b52505768c5f1d08",oauth_signature_method="HMACSHA1",oauth_timestamp="1462489086",oauth_nonce="441910193",oauth_version="1.0",oauth_token="905c7 6f7caaa9146614c34eae09fbad9",oauth_signature="8wsFXgLgDdPmRiT%2BzhluB2qfuRg%3D" Host: api.fitbit.com X-Target-URI: https://api.fitbit.com Connection: Keep-Alive
A2: Data Output: HTTP/1.1 200 OK Content-Language: en Cache-control: no-cache, private Fitbit-Rate-Limit-Limit: 150 Connection: keep-alive Server: Cloudflare-nginx X-Frame-Options: SAMEORIGIN Date: Thu, 05 May 2016 22:58:06 GMT Transfer-Encoding: chunked Vary: Accept-Encoding Fitbit-Rate-Limit-Remaining: 148 CF-RAY: 29e7cb968dec0844-IAD Fitbit-Rate-Limit-Reset: 114 Content-Type: application/json;charset=UTF-8 ( "activities-heart": [ ( "dateTime": "2016-05-06", "value": ( "customHeartRateZones": [
( "caloriesOut": 0, "max": 60, "min": 30, "minutes": 0, "name": "Below" ), ( "caloriesOut": 349.54101, "max": 170, "min": 60, "minutes": 409, "name": "Custom Zone" ), ( "caloriesOut": 0, "max": 220, "min": 170, "minutes": 0, "name": "Above" ) ], "heartRateZones": [ ( "caloriesOut": 346.47704, "max": 85, "min": 30, "minutes": 407, "name": "Out of Range" ), ( "caloriesOut": 3.06397, "max": 119, "min": 85, "minutes": 2, "name": "Fat Burn" ), ( "caloriesOut": 0, "max": 144, "min": 119, "minutes": 0, "name": "Cardio" ), ( "caloriesOut": 0, "max": 220, "min": 144, "minutes": 0, "name": "Peak" )
], "restingHeartRate": 70 ) ) ], "activities-heart-intraday": ( "dataset": [ ( "time": "00:00:05", "value": 74 ), ( "time": "00:00:10", "value": 75 ), ( "time": "00:00:20", "value": 75 ), ( "time": "00:00:30", "value": 74 ), ( "time": "00:00:40", "value": 74 ), ( "time": "00:00:55", "value": 74 ), ( "time": "00:01:00", "value": 74 ), ( "time": "00:01:10", "value": 75 ), ( "time": "00:01:20", "value": 75 ), ( "time": "00:01:30", "value": 75 ), ( "time": "00:01:40", "value": 75 ),
( "time": "00:01:55", "value": 75 ), ( "time": "00:02:10", "value": 74 ), ( "time": "00:02:20", "value": 76 ), ( "time": "00:02:30", "value": 75 ), ( "time": "00:02:45", "value": 75 ), ( "time": "00:03:00", "value": 75 ), ( "time": "00:03:15", "value": 75 ), ( "time": "00:03:20", "value": 76 ), ( "time": "00:03:30", "value": 76 ), ( "time": "00:03:40", "value": 75 ), ( "time": "00:03:50", "value": 76 ), ( "time": "00:04:00", "value": 76---------------Truncated
A3: Requestors’ MAC address allocation: Requestors’ MAC address is pre-defined in the registration as below.
Requestor registration check Physician - registered
User priority: RP
Action
MAC LAP_1
1
Set RP (1)
MAC LAP_2
1
MAC LAP_3
1
Set RP (1)
MAC LAP_4
2
Set RP (2)
MAC LAP_5
2
Set RP (2)
Set RP (1)
IoT device registered
MAC LAP_6
2
Set RP (2)
Unregistered - regular connection
MAC LAP_7
3
Set RP (3)
Unregistered - casual connection
MAC LAP_8
4
Set RP (4)
Unregistered - 1st time connection
MAC LAP_9
5
Set RP (5)
Input
Outcome
Action
valid
TRUE
Next step
invalid
FALSE
Ignore the request
Urgent
on-demand: RT(1)
Regular
scheduled: RT(2)
Unspecified
RT(3)
Data Validity check Data request type
User List type
Whitelist
Blacklist
Outcome: LT Whitelist
1
check Whitelist
Blacklist (default)
2
check Blacklist
MAC LAP_1
matched (TRUE)
Next step
MAC LAP_2
matched (TRUE)
Next step
MAC LAP_3
matched (TRUE)
Next step
unmatched (FALSE)
Ignore the request
MAC LAP_10
matched (TRUE)
Ignore the request
MAC LAP_11
matched (TRUE)
Ignore the request
MAC LAP_12
matched (TRUE)
Ignore the request
unmatched (FALSE)
Next step
A4: Data Export Program User Interface Screenshots:
(Courtesy of Ravi Nielson, Maple Hill Software USA)
A5: Inference logic calculations (examples): A 5.1 Apply variance rate to remove less changed data. In this case, 5% of variance range are removed to sample, and the variance rate can be adjusted to meet the requirements. If the variance rate is smaller, e.g. 1%, it is ‘fine’, and the larger, e.g. 5%, means ‘coarse’. =IF(OR(ABS(E424-E423)>VR_0.05*E423,ABS(E424-E425)>VR_0.05*E425),E424,0), where E423 is previous value, E424 is current and E425 is the next value of E424 with variance rate (VR). A 5.2 Remove duplicated data: data are removed until the last value has been changed. In sleeping mode, it is likely to have the same data without being changed for long period of time for heart rate. =IF(C1807C1806,C1807,NA())
A6: Matlab logic for averaging data values (example): matrix = ones (4,5) matrix = xlsread ('TEST.xlsx','Sheet1', 'A1:E4') avg = ones (4,5) avg(:,1)= a1 avg(:,2)= b1 avg(:,3)= c1 avg(:,4)= d1 avg(:,5)= e1 abs = abs(avg-matrix) for i =1:5 % max_M = max(abs,[],1) [M,I] = max(abs(:,i)) max_I = ones (1,5) max_I = I end
A7: App design for data request from sensors to smartphone: The data requests from the system/sensor nodes are as such: { "Status": "Normal", "Heart rate": 127, "Active?": ["Relaxed", "Active", "Very Active"] } The app looks at the ‘JSON key:value’ pairs and simply displays each line. If a key ends in a question mark, then it is presented as an input, with an array of options provided for the user. The user can ignore these questions. The app will take no action if no user input is received. It will simply refresh the screen with any new sensor information or request when it is next received. Thus the protocol is appropriate for its low-power energy requirements in WBANs as it is simple and lightweight. Upon reception of the user input, it is sent back to the same source IP address as: { "Active": "Very Active" }
A8: Inference algorithm to calculate variance rate application, which are used to apply different variance rates for sensed data in order to select samples to process and transmit: Algorithm: Inference Algorithm Input:
Variation rate (Var_N%), where N = 1 to 99 integer value
Output: Populated data applied with sampling rate Remark: VR formulas: =IF(OR(ABS(E(n)-E(n-1))>VR_K*E(n-1),ABS(E(n)E(n+1))> VR_K* E(n+1)),E(n),0), where E(n-1) is previous value, E(n) is current and E(n+1) is the next value of E(n) with variance rate (VR) of K(e.g. 0.5%) 1: Function Verify_API_1(Ref_SystemTimestamp As Date, Current_LocalTimeStamp As Date, Ref_BPM As Integer, Current_BPM As Integer) As Boolean 2: Adj_Time = Current_LocalTimeStamp.Subtract(Ref_SystemTimestamp) 3: Time = Adj_Time.ToString 4: APIIntervalPlannedSeconds = (Time.Hour * 3600) + (Time.Minute * 60) + (Time.Second) 5: If usePercent Then 6:
Current_ScheduledVariance = (Math.ABS(BPM_Curr - BPM_Refer) /
BPM_Refer) * 100 7:
APIFuncOut = (APIIntervalPlannedSeconds >= Upper_Sec) Or
(Current_ScheduledVariance >= FilterMinPCTVariance) 8:
Else
9:
Current_ScheduledVariance = (Math.ABS(BPM_Curr - BPM_Refer))
10:
APIFunc_Out = (APIIntervalPlannedSeconds >= Upper_Sec) Or
(Current_ScheduledVariance >= FilterMinBPMVariance) 11:End If 12:Return APIFuncOut 13:End Function 14: Function CheckActivityFilter(Time_Ref_Seconds As Integer, Time_As_Second As Integer, BPM_Refer As Integer, BPM_Curr As Integer) As Boolean 15: If usePercent Then 16:
Variance_Apply = (Math.ABS(BPM_Curr - BPM_Refer) / BPM_Refer)
* 100 17:
APIFunc_Out = ((Time_As_Second - Time_Ref_Seconds) >=
Upper_Sec) Or (Variance_Apply >= FilterMinPCTVariance) 18: Else 19:
Variance_Apply = (Math.ABS(BPM_Curr - BPM_Refer))
20:
APIFunc_Out = ((Time_As_Second - Time_Ref_Seconds) >=
Upper_Sec) Or (Variance_Apply >= FilterMinBPMVariance) 21: End If 22: Variance_Apply = (Math.ABS(BPM_Curr - BPM_Refer) / BPM_Refer) * 100 23: APIFunc_Out = ((Time_As_Second - Time_Ref_Seconds) >= Upper_Sec) Or (Variance_Apply >= FilterMinPCTVariance) 24: Return APIFuncOut 25: End Function
• Var_N%: variance rate to be defined by an integer value to apply an inference level when comparing adjacent data points for sampling • Variance_Apply: variance rate to be applied by calculation of percentage of data value difference of current value and adjacent values • APIFunc_Out: API function to export data from production servers. The outcome is shown in Appendix A
APPENDIX B. DATA TYPES AND STRUCTURE AND IEEE 11073-10404 PULSE RATE NUMERIC OBJECT ATTRIBUTES B1: Requirements of Data Types and Structure (Example): The purpose of this information is to give some examples of requirements for data types and structure only whilst it is out of scope as described in Section 1.5. As shown in Figure 2.1, communication protocols including layer 1 to 4 such as BT-LE, ZigBee and Wi-Fi are specified by existing standards. IEEE 11073-20601 [46] specifies how to exchange health data between sensors and agents (e.g. smartphone) followed by device domains. As an application layer is able to utilise the low layers (layer 1 to 6), there are various types of data in sensor nodes to be requested based on the application. For example, a glucose meter is already specified to comply with IEEE P11073 standards which specify numerous standards for each application, e.g. 11073-10419: Device Specialisation – Glucose Meter. Appendix B shows the attributes for reporting a pulse rate measurement for a Pulse Oximeter device specified in IEEE 11073-10404. Following paragraphs include requirements aspects that can be considered when designing interfaces. Attributes can include many types such as system/non-system, default/on-demand, and static/dynamic data. Some types of data can include user information, device information, sensed data, sensor condition, time stamp and battery monitor. Data can be various number of digits and the below data types are used for normal and abnormal data. For the abnormal ranges, three types are required to provide granulised conditions for the application and service provisioning. They are warning, severe and critical ranges and these ranges are defined by medical scientists who understand what value should trigger the alarms and alarm levels. Data types and ranges for alarm levels Data ID
unit32
Normal
Range
Normal
Start
End
float
float
Range
Warning Range
Severe Range
Critical Range
unit8
unit8
unit8
Unit8 is used for abnormal ranges consisting of 8 bits (i.e. unsigned integer 0 to 255). Unit32 is used for data ID providing the range of unsigned integer (0 to 4294967295), which will circulate when it has reached the last value. Float is used to provide start and end values. The primary sensed data types and ranges are shown below in addition to other applications specified by IEEE 11073. Figures have been created arbitrarily and should be defined by medical scientists in practice for each data type Data type
Unit
Normal range
Warning
Severe
Critical
Body temperature
Cº
36.5-37.2
± 10%
± 15%
± 20%
Heart pulse rate
bpm12
60-100
± 15%
± 20%
± 30%
Blood pressure
mmHg
110/70-120/80
± 18%
± 25%
± 35%
Respiration rate
b/m13
12-16
± 9%
± 18%
± 27%
The normal range is based on a customised value determined by a physician who may use big data in cloud server to compare their patient’s condition with the generic public data within the same sample group, e.g. race, age, gender. Warnings can be sub-divided 12 13
Beats per minute Breaths per minute
depending on the data type if required. Severe and critical states can trigger alarms. For all transfers, there are some default parameters to include such as device information (sensor ID), user information (pseudo ID) and static data (time stamp, device status and data normality (normal/alarm). For some transfers, there are parameters to include such as dynamic data (sensed value) as well as the motion status (e.g. walking, running resting, sleeping) in addition to the default data. When a request is made from requestors, it may include information as below. These data are received by sensors from information requestors from IoT or mHealth networks, and sensors use the data to identify the requestors to determine the service level, e.g. priority of the user. Attributes of Data Requests sent by requestors Attributes
Description
Requestor ID
MAC Low address part (LAP) of sender (origination)
Sensor device ID
MAC Low address part (LAP) of receiver (termination)
Handle ID
Target data, e.g. temperature, pulse rate
Request Sequence No
Requestor uses this information to verify corresponding response from sensors
Time stamp
Time stamp of the message sent
Information transfer form from sensors to the requestor network are as below. Attributes of Data Response sent by sensors Attributes
Description
Sensor device ID
MAC Low address part (LAP) of receiver (origination)
Requestor ID
MAC Low address part (LAP) of sender (termination)
Handle ID
Target data, e.g. temperature, pulse rate etc.
Request Sequence No
Requestor uses this information to verify corresponding response from sensors
Time stamp
Time stamp of the message sent
User Info
optional
System Info
optional
Data Types for Normality and Timestamps Normal (1)
Abnormal (0)
Battery status is in normal range specified
Battery is too low to be valid and needs replacing
Data is in the range as specified
Data is out of range for a valid result, e.g. 50 Celsius degree is not a human body
Sensor (e.g. electrode) is located correctly
Sensor is misplaced and malfunctioning
Time stamp (1)
Time stamp (2)
Absolute time stamp
Relative time stamp
Status
Capacity
Present
Time remaining (minutes)
Active
Percentage (%)
Charging Faulty
B2: IEEE 11073-10404 Pulse Rate Numeric Object Attributes:
Attribute name Handle Type
Supplemental -Types Metric-SpecSmall
Standard configuration (Dev-Configuration-Id = 0x0190)
Extended configuration Value See IEEE r 11073-20601-2008. (MDC_PART_SCADA, MDC_PULS_OXIM_PULS_RAT E) See following text.
Qual . M M
C
mss-avail-stored-data, mss-accmanager-initiated, mss-acc-agentinitiated. See following text. See IEEE Std 11073-20601-2008.
M
See IEEE Std 11073-20601-2008.
C
Metric-Id
See IEEE Std 11073-20601-2008.
NR
Metric-IdList
See IEEE Std 11073-20601-2008.
NR
Metric-IdPartition
See IEEE Std 11073-20601-2008.
NR
Unit-Code AttributeValue-Map SourceHandleReference Label-String
MDC_DIM_BEAT_PER_MIN See IEEE Std 11073-20601-2008.
M C
See IEEE Std 11073-20601-2008.
NR
See IEEE Std 11073-20601-2008.
O
UnitLabelString
See IEEE Std 11073-20601-2008.
O
AbsoluteTime-Stamp
See IEEE Std 11073-20601-2008.
C
RelativeTime-Stamp
See IEEE Std 11073-20601-2008.
C
HiRes-TimeStamp
See IEEE Std 11073-20601-2008.
C
MeasureActivePeriod
See IEEE Std 11073-20601-2008.
NR
MetricStructureSmall Measurement -Status
NR
Value 10 (MDC_PART_SCADA, MDC_PULS_OXIM_PULS_RATE)
Qual . M M
See IEEE Std 11073-20601-2008 and following text. mss-avail-stored-data, mss-accagent-initiated. See following text.
NR
Attribute not initially present. If present, follow IEEE Std 1107320601-2008. Attribute not initially present. If present, follow IEEE Std 1107320601-2008. Attribute not initially present. If present, follow IEEE Std 1107320601-2008. Attribute not initially present. If present, follow IEEE Std 1107320601-2008. Attribute not initially present. If present, follow IEEE Std 1107320601-2008. MDC_DIM_BEAT_PER_MIN MDC_ATTR_NU_VAL_OBS_BAS IC Attribute not initially present. If present, follow IEEE Std 1107320601-2008. Attribute not initially present. If present, follow IEEE Std 1107320601-2008. Attribute not initially present. If present, follow IEEE Std 1107320601-2008. Attribute not initially present. If present, follow IEEE Std 1107320601-2008. If fixed format is used and the standard configuration is not adjusted, this attribute is mandatory; otherwise, the conditions from IEEE Std 11073-20601-2008 apply. Attribute not initially present. If present, follow IEEE Std 1107320601-2008. Attribute not initially present. If present, follow IEEE Std 1107320601-2008. Attribute not initially present. If present, follow IEEE Std 1107320601-2008.
NR
M
O
NR
NR
NR
M M NR
O
O
C
C
C
NR
APPENDIX C. TEST DATA C1: AR data Date/time calories Basis HR skin-temp (F) Activity Datapoint 2016-03-24 22:41Z 2.1 99 91.4 2016-03-24 22:42Z 1.4 86 92.3 2016-03-24 22:43Z 1.1 78 92.3 2016-03-24 22:44Z 1.1 77 92.3 2016-03-24 22:45Z 1.1 81 93.2 2016-03-24 22:46Z 1.4 87 93.2 2016-03-24 22:47Z 1.2 79 94.1 2016-03-24 22:48Z 1.6 88 94.1 2016-03-24 22:49Z 2.5 106 94.1 2016-03-24 22:50Z 2.3 103 95 2016-03-24 22:51Z 2.4 105 95 2016-03-24 22:52Z 2.3 98 95 2016-03-24 22:53Z 2.5 104 95 2016-03-24 22:54Z 4.3 114 95 2016-03-24 22:55Z 4.1 114 95.9 2016-03-24 22:56Z 6.2 120 95.9 2016-03-24 22:57Z 8.2 122 95.9 2016-03-24 22:58Z 8.8 127 95.9 2016-03-24 22:59Z 10.7 144 95.9 2016-03-24 23:00Z 11 147 95.9 2016-03-24 23:01Z 11.4 149 95.9 2016-03-24 23:02Z 11.6 151 95.9 2016-03-24 23:03Z 12.6 158 96.8 2016-03-24 23:04Z 13.1 177 96.8 2016-03-24 23:05Z 13.8 177 96.8 2016-03-24 23:06Z 16.4 189 96.8 2016-03-24 23:07Z 16.4 189 95.9 2016-03-24 23:08Z 13.8 184 95.9 2016-03-24 23:09Z 11.8 177 95.9 2016-03-24 23:10Z 12.5 172 95.9 2016-03-24 23:11Z 11.5 155 95.9 2016-03-24 23:12Z 11.6 161 95.9 2016-03-24 23:13Z 13.8 180 95 2016-03-24 23:14Z 16.4 190 96.8 2016-03-24 23:15Z 14 180 96.8 2016-03-24 23:16Z 12.9 161 97.7 2016-03-24 23:17Z 12.1 157 97.7 2016-03-24 23:18Z 9.9 139 96.8 2016-03-24 23:19Z 7.4 120 96.8 2016-03-24 23:20Z 2.6 113 96.8 2016-03-24 23:21Z 3.3 114 96.8 2016-03-24 23:22Z 8.8 128 96.8 2016-03-24 23:23Z 3.9 115 96.8 2016-03-24 23:24Z 2.4 111 96.8 2016-03-24 23:25Z 6.3 117 96.8 2016-03-24 23:26Z 5.9 115 96.8 2016-03-24 23:27Z 4.8 116 96.8
skin-temp (C)
33.5 33.5 34 34 34.5 34.5 34.5 35 35 35 35 35 35.5 35.5 35.5 35.5 35.5 35.5 35.5 35.5 36 36 36 36 35.5 35.5 35.5 35.5 35.5 35.5 35 36 36 36.5 36.5 36 36 36 36 36 36 36 36 36 36
48 0 0 0 0 0 0 75 110 113 113 110 118 123 126 126 126 134 145 144 146 148 153 160 161 163 165 172 171 170 174 169 169 167 168 150 67 64 0 0 21 35 53 0 0 0 53
steps
Respiration
Fitbit HR
11 8 7 9 8 8 8 8 7 9 9 9 11 11 12 13 16 18 24 22 25 26 28 27 29 30 35 42 42 44 45 45 39 44 30 19 15 14 14 14 14 14 14 14 14
92 89 83 78 81 83 107 112 118 113 117 113 114 113 117 122 132 138 137 138 134 136 141 140 145 144 142 136 155 174 170 156 155 153 138 128 128 121 117 128 123 119 121 106 106
1 2 3 4 5 6 7 8 9 10 11 12 13 14 15 16 17 18 19 20 21 22 23 24 25 26 27 28 29 30 31 32 33 34 35 36 37 38 39 40 41 42 43 44 45
Sitting Sitting Sitting Sitting Sitting Walking Walking Walking Walking Walking Walking Walking Walking Walking Walking Walking Walking Walking Walking Walking Jogging Jogging Jogging Jogging Jogging Running Running Running Running Running Running Running Running Walk Walk Rest Rest Rest Rest
C2: Sleep Monitoring Data Modified time Basis heart-rate skin-temptemp celsius 23:00 108 85 96.5 23:01 82 73 77.5 23:02 61 62 61.5 23:03 61 61 61 23:04 61 61 61 23:05 59 59 59 23:06 60 59 59.5 23:07 60 61 60.5
Fitbit Heart rate Heart rate averaged 2.5% inference of avg hr 1% inference of skin t steps calories gsr 79.7 26.5 #N/A 0 2.4 6.06E-05 77.5 80.6 27 27 0 1.5 6.26E-05 61.5 #N/A 0 1.1 #N/A 80.6 27 27 0 1.3 6.16E-05 #N/A 81.5 27.5 27.5 0 1.3 6.12E-05 59 82.4 28 28 0 1.3 6.19E-05 #N/A 82.4 28 #N/A 0 1.3 6.23E-05 #N/A 83.3 28.5 28.5 0 1.2 6.29E-05
23:08 23:09 23:10 23:11 23:12 23:13 23:14 23:15 23:16 23:17 23:18 23:19 23:20 23:21 23:22 23:23 23:24 23:25 23:26 23:27 23:28 23:29 23:30 23:31 23:32 23:33 23:34 23:35 23:36 23:37 23:38 23:39 23:40 23:41 23:42 23:43 23:44 23:45 23:46 23:47 23:48 23:49 23:50 23:51 23:52 23:53 23:54 23:55 23:56 23:57 23:58 23:59 0:00 0:01 0:02 0:03 0:04 0:05 0:06 0:07 0:08 0:09 0:10 0:11 0:12 0:13 0:14
58 55 57 55 56 56 56 61 59
62 61 63 61 61 62 61 62 61 61 61 61 61 61 61 62 65 66 67 66 68 66 70 71 68 69 65 66 64 68 63 61 62 61 61 63 65 61
59 56 57 57 56 56 57 60 59 58 58 59 59 58 59 59 59 60 59 61 59 59 59 59 60 60 59 60 60 61 61 67 60 61 62 61 62 61 62 61 61 61 61 61 62 63 65 67 66 68 67 69 71 70 75 65 65 64 64 62 62 60 60 61 62 65 66
58.5 55.5 57 56 56 56 56.5 60.5 59 58 58 59 59 58 59 59 59 60 59 61 59 59 59 59 60 60 59 60 60 61.5 61 65 60.5 61 62 61 62 61 61.5 61 61 61 61 61 62 64 65.5 67 66 68 66.5 69.5 71 69 72 65 65.5 64 66 62.5 61.5 61 60.5 61 62.5 65 63.5
58.5 55.5 57 #N/A #N/A #N/A #N/A 60.5 #N/A #N/A #N/A #N/A #N/A #N/A #N/A #N/A #N/A #N/A #N/A 61 59 #N/A #N/A #N/A #N/A #N/A #N/A #N/A #N/A #N/A #N/A 65 60.5 #N/A #N/A #N/A #N/A #N/A #N/A #N/A #N/A #N/A #N/A #N/A #N/A 64 #N/A #N/A #N/A 68 #N/A 69.5 #N/A 69 72 65 #N/A #N/A 66 62.5 #N/A #N/A #N/A #N/A #N/A 65 #N/A
84.2 84.2 85.1 85.1 86 86 86 86.9 86.9
29 29 29.5 29.5 30 30 30 30.5 30.5
88.7 90.5 90.5 90.5 90.5 89.6 89.6 89.6 89.6 88.7 88.7 88.7 88.7 87.8 87.8 87.8 87.8 87.8 87.8 87.8 87.8 87.8 87.8 87.8 87.8 87.8 87.8 87.8 88.7 88.7 89.6 90.5 90.5 91.4 91.4 91.4 91.4
31.5 32.5 32.5 32.5 32.5 32 32 32 32 31.5 31.5 31.5 31.5 31 31 31 31 31 31 31 31 31 31 31 31 31 31 31 31.5 31.5 32 32.5 32.5 33 33 33 33
29 #N/A 29.5 #N/A 30 #N/A #N/A 30.5 #N/A #N/A #N/A #N/A #N/A #N/A #N/A #N/A #N/A #N/A #N/A #N/A #N/A #N/A #N/A #N/A #N/A #N/A #N/A #N/A #N/A #N/A 31.5 32.5 #N/A #N/A #N/A 32 #N/A #N/A #N/A 31.5 #N/A #N/A #N/A 31 #N/A #N/A #N/A #N/A #N/A #N/A #N/A #N/A #N/A #N/A #N/A #N/A #N/A #N/A 31.5 #N/A 32 32.5 #N/A 33 #N/A #N/A #N/A
0 0 0 0 0 0 0 0 0 0 0 0 0 0 0 0 0 0 0 0 0 0 0 0 0 0 0 0 0 0 0 0 0 0 0 0 0 0 0 0 0 0 0 0 0 0 0 0 0 0 0 0 0 0 0 0 0 0 0 0 0 0 0 0 0 0 0
1.3 1.3 1.3 1.3 1.3 1.3 1.2 1.3 1.3 1.3 1.3 1.2 1.3 1.3 1.3 1.3 1.3 1.2 1.3 1.3 1.3 1.3 1.3 1.3 1.2 1.3 1.3 1.3 1.3 1.1 1.3 1.3 1.3 1.3 1.3 1.2 1.3 1.3 1.3 1.3 1.3 1.3 1.2 1.3 1.3 1.3 1.3 1.3 1.2 1.3 1.3 1.3 1.2 1.3 1.3 1.2 1.3 1.3 1.3 1.3 1.3 1.3 1.2 1.3 1.3 1.3 1.3
6.29E-05 6.29E-05 6.26E-05 6.29E-05
6.36E-05 6.44E-05 6.40E-05
6.51E-05 6.73E-05 6.69E-05 6.88E-05 6.62E-05 6.65E-05 6.69E-05 6.58E-05 6.62E-05 6.58E-05 6.62E-05 6.51E-05 6.65E-05 6.51E-05 6.58E-05 6.58E-05 6.54E-05 6.54E-05 6.62E-05 6.54E-05 6.58E-05 6.58E-05 6.51E-05 6.58E-05 6.58E-05 6.62E-05 6.58E-05 6.73E-05 6.65E-05 6.62E-05 7.11E-05 7.43E-05 7.56E-05 7.60E-05 7.64E-05 7.23E-05 6.84E-05
0:15 0:16 0:17 0:18 0:19 0:20 0:21 0:22 0:23 0:24 0:25 0:26 0:27 0:28 0:29 0:30 0:31 0:32 0:33 0:34 0:35 0:36 0:37 0:38 0:39 0:40 0:41 0:42 0:43 0:44 0:45 0:46 0:47 0:48 0:49 0:50 0:51 0:52 0:53 0:54 0:55 0:56 0:57 0:58 0:59 1:00 1:01 1:02 1:03 1:04 1:05 1:06 1:07 1:08 1:09 1:10 1:11 1:12 1:13 1:14 1:15 1:16 1:17 1:18 1:19 1:20 1:21
57 62 58 59 58 60 57 56 58 58 59 57 57 57 58 57 57 57 56 57 55 57 58 58 60 59 59 56 56 55 56 55 54 54 55 54 55 53 54 54 53 53 53 53 59 54 54 58 55 56 56 58 54 57 54 61 60 58 59 62 62 62 62 62 61 60 60
59 60 62 57 58 59 61 61 60 59 59 57 56 56 58 57 57 57 57 56 57 57 58 59 59 54 55 55 56 56 56 56 56 56 55 55 55 55 54 54 54 54 54 54 56 56 53 57 57 55 55 56 56 55 56 56 62 59 59 62 64 63 62 63 60 61 60
58 61 60 58 58 59.5 59 58.5 59 58.5 59 57 56.5 56.5 58 57 57 57 56.5 56.5 56 57 58 58.5 59.5 56.5 57 55.5 56 55.5 56 55.5 55 55 55 54.5 55 54 54 54 53.5 53.5 53.5 53.5 57.5 55 53.5 57.5 56 55.5 55.5 57 55 56 55 58.5 61 58.5 59 62 63 62.5 62 62.5 60.5 60.5 60
58 61 #N/A 58 #N/A 59.5 #N/A #N/A #N/A #N/A #N/A 57 #N/A #N/A 58 #N/A #N/A #N/A #N/A #N/A #N/A #N/A #N/A #N/A #N/A 56.5 #N/A 55.5 #N/A #N/A #N/A #N/A #N/A #N/A #N/A #N/A #N/A #N/A #N/A #N/A #N/A #N/A #N/A #N/A 57.5 55 53.5 57.5 56 #N/A #N/A 57 55 #N/A #N/A 58.5 61 58.5 #N/A 62 #N/A #N/A #N/A #N/A 60.5 #N/A #N/A
91.4 90.5 89.6 89.6 88.7 87.8 87.8 87.8 86.9 86.9 86.9 86.9 86 86 86 86 86 86 86 86 86 86 86 86 85.1 85.1 85.1 86 86 86.9 86.9 87.8 87.8 88.7 88.7 88.7 88.7 89.6 89.6 89.6 89.6 89.6 89.6 89.6 90.5 89.6 89.6 88.7 88.7 87.8 87.8 86.9 86.9 86.9 86 86 86 86.9 86.9 86.9 87.8 87.8 88.7 88.7 88.7 89.6 89.6
33 32.5 32 32 31.5 31 31 31 30.5 30.5 30.5 30.5 30 30 30 30 30 30 30 30 30 30 30 30 29.5 29.5 29.5 30 30 30.5 30.5 31 31 31.5 31.5 31.5 31.5 32 32 32 32 32 32 32 32.5 32 32 31.5 31.5 31 31 30.5 30.5 30.5 30 30 30 30.5 30.5 30.5 31 31 31.5 31.5 31.5 32 32
#N/A 32.5 32 #N/A 31.5 31 #N/A #N/A 30.5 #N/A #N/A #N/A 30 #N/A #N/A #N/A #N/A #N/A #N/A #N/A #N/A #N/A #N/A #N/A 29.5 #N/A #N/A 30 #N/A 30.5 #N/A 31 #N/A 31.5 #N/A #N/A #N/A 32 #N/A #N/A #N/A #N/A #N/A #N/A 32.5 32 #N/A 31.5 #N/A 31 #N/A 30.5 #N/A #N/A 30 #N/A #N/A 30.5 #N/A #N/A 31 #N/A 31.5 #N/A #N/A 32 #N/A
0 0 0 0 0 0 0 0 0 0 0 0 0 0 0 0 0 0 0 0 0 0 0 0 0 0 0 0 0 0 0 0 0 0 0 0 0 0 0 0 0 0 0 0 0 0 0 0 0 0 0 0 0 0 0 0 0 0 0 0 0 0 0 0 0 0 0
1.3 1.3 1.2 1.3 1.3 1.3 1.3 1.3 1.2 1.3 1.3 1.3 1.3 1.3 1.3 1.2 1.3 1.3 1.3 1.3 1.3 1.2 1.3 1.3 1.3 1.3 1.3 1.3 1.2 1.3 1.3 1.3 1.3 1.3 1.2 1.3 1.3 1.3 1.3 1.3 1.3 1.2 1.3 1.3 1.3 1.3 1.3 1.2 1.3 1.3 1.3 1.3 1.3 1.3 1.2 1.3 1.3 1.3 1.3 1.3 1.2 1.3 1.3 1.3 1.3 1.3 1.3
6.84E-05 6.80E-05 6.80E-05 6.69E-05 6.62E-05 6.58E-05 6.58E-05 6.51E-05 6.51E-05 6.44E-05 6.44E-05 6.47E-05 6.40E-05 6.44E-05 6.44E-05 6.47E-05 6.44E-05 6.44E-05 6.40E-05 6.36E-05 6.44E-05 6.40E-05 6.40E-05 6.36E-05 6.40E-05 6.33E-05 6.47E-05 6.47E-05 6.51E-05 6.62E-05 6.80E-05 6.99E-05 7.07E-05 7.15E-05 7.27E-05 7.35E-05 7.35E-05 7.56E-05 6.99E-05 6.84E-05 6.92E-05 6.84E-05 6.84E-05 6.88E-05 6.84E-05 6.80E-05 6.76E-05 6.69E-05 6.65E-05 6.58E-05 6.62E-05 6.54E-05 6.54E-05 6.58E-05 6.47E-05 6.44E-05 6.36E-05 6.33E-05 6.40E-05 6.40E-05 6.44E-05 6.54E-05 6.62E-05 6.54E-05 6.58E-05 6.62E-05 7.03E-05
1:22 1:23 1:24 1:25 1:26 1:27 1:28 1:29 1:30 1:31 1:32 1:33 1:34 1:35 1:36 1:37 1:38 1:39 1:40 1:41 1:42 1:43 1:44 1:45 1:46 1:47 1:48 1:49 1:50 1:51 1:52 1:53 1:54 1:55 1:56 1:57 1:58 1:59 2:00 2:01 2:02 2:03 2:04 2:05 2:06 2:07 2:08 2:09 2:10 2:11 2:12 2:13 2:14 2:15 2:16 2:17 2:18 2:19 2:20 2:21 2:22 2:23 2:24 2:25 2:26 2:27 2:28
60 63 61 61 60 61 60 66 70 67 68 67 66 64 64 63 64 66 63 64 66 65 66 63 64 65 65 63 62 67 63 66 60 62 61 59 61 61 61 60 61 60 62 63 62 59 60 62 63 61 62 67 63 62 60 60 61 60 60 59 61 59 60 60 59 58 59
59 62 63 60 61 61 61 63 71 71 66 67 64
64 62 60
59 67 61 62 60 60 61 61 62 60 61 62 60 62 63 60 59 61 63 63 64 64 66 63 60 61 60 60 59 60 61 60 59 60 59 58 59
59.5 62.5 62 60.5 60.5 61 60.5 64.5 70.5 69 67 67 65 64 64 63 64 64 61.5 64 66 65 66 63 64 65 65 63 62 63 63 66.5 60.5 62 60.5 59.5 61 61 61.5 60 61 61 61 62.5 62.5 59.5 59.5 61.5 63 62 63 65.5 64.5 62.5 60 60.5 60.5 60 59.5 59.5 61 59.5 59.5 60 59 58 59
#N/A 62.5 #N/A #N/A #N/A #N/A #N/A 64.5 70.5 #N/A 67 #N/A 65 #N/A #N/A #N/A #N/A #N/A 61.5 64 66 #N/A #N/A 63 #N/A #N/A #N/A 63 #N/A #N/A #N/A 66.5 60.5 #N/A #N/A #N/A 61 #N/A #N/A #N/A #N/A #N/A #N/A #N/A #N/A 59.5 #N/A 61.5 #N/A #N/A #N/A 65.5 #N/A 62.5 60 #N/A #N/A #N/A #N/A #N/A 61 #N/A #N/A #N/A #N/A #N/A #N/A
89.6 90.5 90.5 90.5 90.5 90.5 91.4 91.4 91.4 91.4 91.4 92.3 91.4 91.4 91.4 91.4 91.4 91.4 92.3 92.3 92.3 92.3 92.3 92.3 92.3 92.3 92.3 92.3 92.3 92.3 92.3 92.3 92.3 93.2 93.2 93.2 93.2 93.2 93.2 93.2 92.3 92.3 92.3 92.3 92.3 92.3 92.3 92.3 92.3 92.3 92.3 92.3 92.3 92.3 91.4 90.5 89.6 88.7 88.7 87.8 86.9 86.9 86.9 86 86 86 86
32 32.5 32.5 32.5 32.5 32.5 33 33 33 33 33 33.5 33 33 33 33 33 33 33.5 33.5 33.5 33.5 33.5 33.5 33.5 33.5 33.5 33.5 33.5 33.5 33.5 33.5 33.5 34 34 34 34 34 34 34 33.5 33.5 33.5 33.5 33.5 33.5 33.5 33.5 33.5 33.5 33.5 33.5 33.5 33.5 33 32.5 32 31.5 31.5 31 30.5 30.5 30.5 30 30 30 30
#N/A 32.5 #N/A #N/A #N/A #N/A 33 #N/A #N/A #N/A #N/A 33.5 33 #N/A #N/A #N/A #N/A #N/A 33.5 #N/A #N/A #N/A #N/A #N/A #N/A #N/A #N/A #N/A #N/A #N/A #N/A #N/A #N/A 34 #N/A #N/A #N/A #N/A #N/A #N/A 33.5 #N/A #N/A #N/A #N/A #N/A #N/A #N/A #N/A #N/A #N/A #N/A #N/A #N/A 33 32.5 32 31.5 #N/A 31 30.5 #N/A #N/A 30 #N/A #N/A #N/A
0 0 0 0 0 0 0 0 0 0 0 0 0 0 0 0 0 0 0 0 0 0 0 0 0 0 0 0 0 0 0 0 0 0 0 0 0 0 0 0 0 0 0 0 0 0 0 0 0 0 0 0 0 0 0 0 0 0 0 0 0 0 0 0 0 0 0
1.2 1.3 1.3 1.3 1.3 1.3 1.3 1.2 1.3 1.3 1.3 1.3 1.3 1.2 1.3 1.3 1.3 1.3 1.3 1.3 1.2 1.3 1.3 1.3 1.3 1.3 1.2 1.3 1.3 1.3 1.3 1.3 1.3 1.2 1.3 1.3 1.3 1.3 1.3 1.2 1.3 1.3 1.3 1.3 1.3 1.3 1.2 1.3 1.3 1.3 1.3 1.3 1.2 1.3 1.3 1.3 1.3 1.3 1.3 1.2 1.3 1.3 1.3 1.3 1.3 1.2 1.3
7.43E-05 7.51E-05 7.64E-05 7.81E-05 7.85E-05 7.90E-05 8.16E-05 8.21E-05 8.30E-05 8.07E-05 6.76E-05 6.80E-05 6.65E-05 6.69E-05 6.69E-05 6.76E-05 6.73E-05 6.73E-05 6.73E-05 6.69E-05 6.69E-05 6.76E-05 6.73E-05 6.76E-05 6.84E-05 6.69E-05 6.69E-05 6.73E-05 6.84E-05 6.76E-05 6.76E-05 6.73E-05 7.99E-05 8.07E-05 7.90E-05 7.77E-05 7.77E-05 7.81E-05 6.88E-05 6.95E-05 6.84E-05 7.03E-05 6.88E-05 6.88E-05 6.84E-05 6.88E-05 6.76E-05 6.84E-05 6.88E-05 6.92E-05 7.23E-05 7.15E-05 6.92E-05 6.76E-05 6.65E-05 6.69E-05 6.58E-05 6.54E-05 6.54E-05 6.54E-05 6.44E-05 6.47E-05 6.33E-05 6.33E-05 6.44E-05 6.36E-05 6.33E-05
2:29 2:30 2:31 2:32 2:33 2:34 2:35 2:36 2:37 2:38 2:39 2:40 2:41 2:42 2:43 2:44 2:45 2:46 2:47 2:48 2:49 2:50 2:51 2:52 2:53 2:54 2:55 2:56 2:57 2:58 2:59 3:00 3:01 3:02 3:03 3:04 3:05 3:06 3:07 3:08 3:09 3:10 3:11 3:12 3:13 3:14 3:15 3:16 3:17 3:18 3:19 3:20 3:21 3:22 3:23 3:24 3:25 3:26 3:27 3:28 3:29 3:30 3:31 3:32 3:33 3:34 3:35
59 61 57 56 57 57 59 60 61 63 62 63 63 63 63 64 63 63 63 64 63 63 63 64 62 63 64 63 63 64 64 64 65 64 64 64 64 65 65 65 65 65 67 59 62 63 64 61 60 60 60 71 68 67 67 68 68 68 68 68 67 67 68 67 67 68 66
58 63 57 57 57 57 57 61 61 63 63 62 64 63 63 64 64 63 63 64 64 64 63 63 63 64 64 63 63 63 64 64 64 65 63 64 65 65 65 65 65 66 66 58 62 63 61 62 59 59 60 66 69 68 66 67 67
58.5 62 57 56.5 57 57 58 60.5 61 63 62.5 62.5 63.5 63 63 64 63.5 63 63 64 63.5 63.5 63 63.5 62.5 63.5 64 63 63 63.5 64 64 64.5 64.5 63.5 64 64.5 65 65 65 65 65.5 66.5 58.5 62 63 62.5 61.5 59.5 59.5 60 68.5 68.5 67.5 66.5 67.5 67.5 68 68 68 67 67 68 67 67 68 66
#N/A 62 57 #N/A #N/A #N/A #N/A 60.5 #N/A 63 #N/A #N/A #N/A #N/A #N/A #N/A #N/A #N/A #N/A #N/A #N/A #N/A #N/A #N/A #N/A #N/A #N/A #N/A #N/A #N/A #N/A #N/A #N/A #N/A #N/A #N/A #N/A #N/A #N/A #N/A #N/A #N/A #N/A 58.5 62 #N/A #N/A #N/A 59.5 #N/A #N/A 68.5 #N/A #N/A #N/A #N/A #N/A #N/A #N/A #N/A #N/A #N/A #N/A #N/A #N/A #N/A 66
85.1 85.1 85.1 85.1 85.1 85.1 84.2 84.2 84.2 85.1 85.1 86 86.9 86.9 87.8 87.8 88.7 88.7 89.6 89.6 89.6 90.5 90.5 90.5 90.5 91.4 91.4 91.4 91.4 91.4 92.3 92.3 92.3 92.3 92.3 92.3 92.3 92.3 92.3 92.3 92.3 92.3 93.2 93.2 93.2 93.2 93.2 93.2 92.3 92.3 91.4
29.5 29.5 29.5 29.5 29.5 29.5 29 29 29 29.5 29.5 30 30.5 30.5 31 31 31.5 31.5 32 32 32 32.5 32.5 32.5 32.5 33 33 33 33 33 33.5 33.5 33.5 33.5 33.5 33.5 33.5 33.5 33.5 33.5 33.5 33.5 34 34 34 34 34 34 33.5 33.5 33
90.5 90.5 90.5 90.5 90.5 91.4 91.4 91.4 91.4 91.4 92.3 92.3 92.3 92.3 92.3
32.5 32.5 32.5 32.5 32.5 33 33 33 33 33 33.5 33.5 33.5 33.5 33.5
29.5 #N/A #N/A #N/A #N/A #N/A 29 #N/A #N/A 29.5 #N/A 30 30.5 #N/A 31 #N/A 31.5 #N/A 32 #N/A #N/A 32.5 #N/A #N/A #N/A 33 #N/A #N/A #N/A #N/A 33.5 #N/A #N/A #N/A #N/A #N/A #N/A #N/A #N/A #N/A #N/A #N/A 34 #N/A #N/A #N/A #N/A #N/A 33.5 #N/A 33 #N/A 32.5 #N/A #N/A #N/A #N/A 33 #N/A #N/A #N/A #N/A 33.5 #N/A #N/A #N/A #N/A
0 0 0 0 0 0 0 0 0 0 0 0 0 0 0 0 0 0 0 0 0 0 0 0 0 0 0 0 0 0 0 0 0 0 0 0 0 0 0 0 0 0 0 0 0 0 0 0 0 0 0 0 0 0 0 0 0 0 0 0 0 0 0 0 0 0 0
1.3 1.3 1.3 1.3 1.3 1.2 1.3 1.3 1.3 1.3 1.3 1.3 1.2 1.3 1.3 1.3 1.3 1.3 1.2 1.3 1.3 1.3 1.3 1.3 1.3 1.2 1.3 1.3 1.3 1.3 1.3 1.2 1.3 1.3 1.3 1.3 1.3 1.3 1.2 1.3 1.3 1.3 1.3 1.3 1.2 1.3 1.3 1.3 1.3 1.3 1.4 1.1 1.3 1.3 1.3 1.3 1.2 1.3 1.3 1.3 1.3 1.3 1.3 1.2 1.3 1.3 1.3
6.33E-05 6.29E-05 6.36E-05 6.29E-05 6.36E-05 6.40E-05 6.33E-05 6.12E-05 6.26E-05 6.29E-05 6.29E-05 6.29E-05 6.33E-05 6.40E-05 6.47E-05 6.51E-05 6.51E-05 6.47E-05 6.54E-05 6.54E-05 6.62E-05 6.62E-05 6.54E-05 6.62E-05 6.62E-05 6.65E-05 6.65E-05 6.65E-05 6.69E-05 6.69E-05 6.73E-05 6.73E-05 6.80E-05 6.80E-05 6.76E-05 6.76E-05 6.73E-05 6.88E-05 6.84E-05 6.80E-05 6.84E-05 6.92E-05 6.84E-05 7.19E-05 6.80E-05 6.76E-05 7.99E-05 7.56E-05 6.73E-05 6.76E-05 6.65E-05 6.58E-05 6.54E-05 6.62E-05 6.58E-05 6.62E-05 6.65E-05 6.65E-05 6.62E-05 6.65E-05 6.69E-05 6.69E-05 6.76E-05 6.73E-05 6.76E-05 6.73E-05
3:36 3:37 3:38 3:39 3:40 3:41 3:42 3:43 3:44 3:45 3:46 3:47 3:48 3:49 3:50 3:51 3:52 3:53 3:54 3:55 3:56 3:57 3:58 3:59 4:00 4:01 4:02 4:03 4:04 4:05 4:06 4:07 4:08 4:09 4:10 4:11 4:12 4:13 4:14 4:15 4:16 4:17 4:18 4:19 4:20 4:21 4:22 4:23 4:24 4:25 4:26 4:27 4:28 4:29 4:30 4:31 4:32 4:33 4:34 4:35 4:36 4:37 4:38 4:39 4:40 4:41 4:42
67 68 69 69 68 67 67 69 71 69 65 64 65 64 63 62 64 65 64 65 65 64 64 65 64 65 65 65 66 62 61 63 63 61 63 64 62 62 63 63 63 63 63 63 63 68 63 65 76 76 63 64 65 65 64 67 65 65 69 66 72 65 64 66 64 64 63
77 66 64 65 64 62 62 66 66 64 64 66 64 64 66 65 64 65 74 65 62 62 62 64 62 63 62 63 63 63 63 63 61 62 63 63 63 62 63 62 62 63 63 63 62 63 63 63 64 63 64 68 66 65 66 65 66 63
67 68 69 69 68 67 67 69 71 73 65.5 64 65 64 62.5 62 65 65.5 64 64.5 65.5 64 64 65.5 64.5 64.5 65 69.5 65.5 62 61.5 62.5 63.5 61.5 63 63 62.5 62.5 63 63 63 62 62.5 63 63 65.5 62.5 64 69 69 63 63.5 64 63.5 63.5 65 64 64.5 66 65 70 65.5 64.5 66 64.5 65 63
#N/A #N/A #N/A #N/A #N/A #N/A #N/A 69 71 73 65.5 #N/A #N/A #N/A #N/A #N/A 65 #N/A #N/A #N/A #N/A #N/A #N/A #N/A #N/A #N/A #N/A 69.5 65.5 62 #N/A #N/A #N/A 61.5 #N/A #N/A #N/A #N/A #N/A #N/A #N/A #N/A #N/A #N/A #N/A 65.5 62.5 #N/A 69 #N/A 63 #N/A #N/A #N/A #N/A #N/A #N/A #N/A #N/A #N/A 70 65.5 #N/A #N/A #N/A #N/A 63
92.3 92.3 92.3 92.3 93.2 93.2 93.2 93.2 93.2 93.2 93.2 93.2 93.2 93.2 93.2 93.2 93.2 93.2 93.2 93.2 93.2 94.1 94.1 94.1 94.1 94.1 94.1 94.1 94.1 93.2 92.3 92.3 91.4 90.5 90.5 90.5 89.6 89.6 89.6 88.7 88.7 88.7 88.7 88.7 87.8 87.8 87.8 87.8 87.8 87.8 87.8 87.8 86.9 86.9 86.9 86.9 86.9 86.9 86.9 86.9 86.9 86.9 86.9 86.9 86.9 87.8 87.8
33.5 33.5 33.5 33.5 34 34 34 34 34 34 34 34 34 34 34 34 34 34 34 34 34 34.5 34.5 34.5 34.5 34.5 34.5 34.5 34.5 34 33.5 33.5 33 32.5 32.5 32.5 32 32 32 31.5 31.5 31.5 31.5 31.5 31 31 31 31 31 31 31 31 30.5 30.5 30.5 30.5 30.5 30.5 30.5 30.5 30.5 30.5 30.5 30.5 30.5 31 31
#N/A #N/A #N/A #N/A 34 #N/A #N/A #N/A #N/A #N/A #N/A #N/A #N/A #N/A #N/A #N/A #N/A #N/A #N/A #N/A #N/A 34.5 #N/A #N/A #N/A #N/A #N/A #N/A #N/A 34 33.5 #N/A 33 32.5 #N/A #N/A 32 #N/A #N/A 31.5 #N/A #N/A #N/A #N/A 31 #N/A #N/A #N/A #N/A #N/A #N/A #N/A 30.5 #N/A #N/A #N/A #N/A #N/A #N/A #N/A #N/A #N/A #N/A #N/A #N/A 31 #N/A
0 0 0 0 0 0 0 0 0 0 0 0 0 0 0 0 0 0 0 0 0 0 0 0 0 0 0 0 0 0 0 0 0 0 0 0 0 0 0 0 0 0 0 0 0 0 0 0 0 0 0 0 0 0 0 0 0 0 0 0 0 0 0 0 0 0 0
1.3 1.3 1.2 1.3 1.3 1.3 1.3 1.3 1.3 1.2 1.3 1.3 1.3 1.3 1.3 1.2 1.3 1.3 1.3 1.3 1.3 1.3 1.2 1.3 1.3 1.3 1.3 1.3 1.2 1.3 1.3 1.3 1.3 1.3 1.3 1.2 1.3 1.3 1.3 1.3 1.3 1.2 1.3 1.3 1.3 1.3 1.3 1.3 1.2 1.3 1.3 1.3 1.3 1.3 1.3 1.2 1.3 1.3 1.3 1.3 1.3 1.2 1.3 1.3 1.3 1.3 1.3
6.69E-05 6.73E-05 6.76E-05 6.69E-05 6.76E-05 7.03E-05 6.80E-05 6.76E-05 6.73E-05 6.80E-05 8.26E-05 8.49E-05 8.53E-05 8.73E-05 8.82E-05 8.92E-05 8.97E-05 9.07E-05 9.22E-05 9.27E-05 9.32E-05 9.38E-05 9.38E-05 9.43E-05 9.53E-05 9.64E-05 9.64E-05 9.91E-05 6.80E-05 6.95E-05 6.88E-05 6.88E-05 6.92E-05 6.80E-05 6.80E-05 6.76E-05 6.73E-05 6.73E-05 6.65E-05 6.69E-05 6.62E-05 6.65E-05 6.65E-05 6.62E-05 6.69E-05 6.65E-05 6.58E-05 6.62E-05 6.62E-05 6.62E-05 6.58E-05 6.62E-05 6.58E-05 6.58E-05 6.51E-05 6.62E-05 6.58E-05 6.58E-05 6.62E-05 6.65E-05 6.54E-05 7.03E-05 7.60E-05 7.56E-05 7.68E-05 7.81E-05 7.85E-05
4:43 4:44 4:45 4:46 4:47 4:48 4:49 4:50 4:51 4:52 4:53 4:54 4:55 4:56 4:57 4:58 4:59 5:00 5:01 5:02 5:03 5:04 5:05 5:06 5:07 5:08 5:09 5:10 5:11 5:12 5:13 5:14 5:15 5:16 5:17 5:18 5:19 5:20 5:21 5:22 5:23 5:24 5:25 5:26 5:27 5:28 5:29 5:30
63 66 70 67 67 67 64 66 66 69 65 66 68 65 68 66 67 67 69 68 68 67 68 70 69 67 69 69 69 69 68 72 69 67 74 77 70 70 67 67 66 68 66 67 66 66 65 66
62 65 71 69 68 69 65 67 67 68 67 68 68 66 69 66 67 67 73 68 67 66 67 68 69 68 67 69 69 68 69 71 68 64 69 74 70 71 69 66 67 67 68 68 67 66 65 67
62.5 65.5 70.5 68 67.5 68 64.5 66.5 66.5 68.5 66 67 68 65.5 68.5 66 67 67 71 68 67.5 66.5 67.5 69 69 67.5 68 69 69 68.5 68.5 71.5 68.5 65.5 71.5 75.5 70 70.5 68 66.5 66.5 67.5 67 67.5 66.5 66 65 66.5
Modified time Basis heart-rate skin-temptemp celsius 371 358 391
#N/A 65.5 70.5 68 #N/A #N/A 64.5 66.5 #N/A 68.5 66 #N/A #N/A 65.5 68.5 66 #N/A #N/A 71 68 #N/A #N/A #N/A #N/A #N/A #N/A #N/A #N/A #N/A #N/A #N/A 71.5 68.5 65.5 71.5 75.5 70 #N/A 68 #N/A #N/A #N/A #N/A #N/A #N/A #N/A #N/A #N/A
88.7 88.7 88.7 88.7 89.6 89.6 89.6 90.5 90.5 90.5 90.5 91.4 91.4 91.4 91.4 91.4 91.4 91.4 91.4 91.4 92.3 92.3 92.3 92.3 92.3 92.3 92.3 92.3 92.3 92.3 92.3 92.3 92.3 92.3 92.3 93.2 93.2 93.2 93.2 93.2 93.2 93.2 93.2 93.2 93.2 93.2 93.2 93.2
31.5 31.5 31.5 31.5 32 32 32 32.5 32.5 32.5 32.5 33 33 33 33 33 33 33 33 33 33.5 33.5 33.5 33.5 33.5 33.5 33.5 33.5 33.5 33.5 33.5 33.5 33.5 33.5 33.5 34 34 34 34 34 34 34 34 34 34 34 34 34
31.5 #N/A #N/A #N/A 32 #N/A #N/A 32.5 #N/A #N/A #N/A 33 #N/A #N/A #N/A #N/A #N/A #N/A #N/A #N/A 33.5 #N/A #N/A #N/A #N/A #N/A #N/A #N/A #N/A #N/A #N/A #N/A #N/A #N/A #N/A 34 #N/A #N/A #N/A #N/A #N/A #N/A #N/A #N/A #N/A #N/A #N/A #N/A
0 0 0 0 0 0 0 0 0 0 0 0 0 0 0 0 0 0 0 0 0 0 0 0 0 0 0 0 0 0 0 0 0 0 0 0 0 0 0 0 0 0 0 0 0 0 0 0
1.3 1.2 1.3 1.3 1.3 1.3 1.3 1.2 1.3 1.3 1.3 1.3 1.3 1.3 1.2 1.3 1.3 1.3 1.3 1.3 1.2 1.3 1.3 1.3 1.3 1.3 1.3 1.2 1.3 1.3 1.3 1.3 1.3 1.2 1.3 1.3 1.3 1.3 1.3 1.3 1.2 1.3 1.3 1.3 1.3 1.3 1.2 1.3
8.03E-05 8.16E-05 8.21E-05 6.51E-05 6.65E-05 6.76E-05 6.76E-05 6.84E-05 6.76E-05 6.84E-05 6.88E-05 6.88E-05 6.88E-05 6.84E-05 6.84E-05 6.88E-05 6.88E-05 6.92E-05 6.92E-05 8.12E-05 7.77E-05 7.60E-05 7.68E-05 7.35E-05 7.35E-05 7.35E-05 7.43E-05 7.39E-05 7.31E-05 7.47E-05 7.15E-05 7.11E-05 7.03E-05 7.11E-05 7.03E-05 7.07E-05 8.12E-05 9.12E-05 9.27E-05 9.43E-05 9.53E-05 9.69E-05 9.86E-05 9.91E-05 9.53E-05 9.17E-05 9.32E-05 9.32E-05
Fitbit Heart rate Heart rate averaged 2.5% inference of avg hr 1% inference of skin t steps calories gsr 103 368 88
C3: Walk Monitoring Data Time celsius 10:53 10:54 10:55 10:56 10:57 10:58 10:59 11:00 11:01
heart-rate Fitbit HR avg HR 1% inference of skin temp 82 104 93 84 104 94 95 104 99.5 110 111 110.5 127 112 119.5 113 113 113 103 108 105.5 128 104 116 130 105 117.5
2.5% inference of avg HR skin-tempgsr 10% gsr #N/A #N/A 24 #N/A #N/A 20.5 99.5 99.5 22 110.5 110.5 23 119.5 119.5 23.5 113 113 24 105.5 105.5 24 116 116 24.5 #N/A #N/A 24.5
5% inference of avg HR
Temp
#N/A 20.5 22 23 23.5 24 #N/A 24.5 #N/A
#N/A #N/A #N/A 6.26E-05 #N/A #N/A #N/A #N/A #N/A
75.2 68.9 71.6 73.4 74.3 75.2 75.2 76.1 76.1
5.86E-05 6.02E-05 5.54E-05 6.26E-05 6.16E-05 6.23E-05 6.36E-05 6.33E-05 6.40E-05
11:02 11:03 11:04 11:05 11:06 11:07 11:08 11:09 11:10 11:11 11:12 11:13 11:14 11:15 11:16 11:17 11:18 11:19 11:20 11:21 11:22 11:23 11:24 11:25 11:26 11:27 11:28 11:29 11:30 11:31 11:32 11:33 11:34 11:35 11:36 11:37 11:38 11:39 11:40 11:41 11:42 11:43 11:44 11:45 11:46 11:47 11:48 11:49 11:50 11:51 11:52 11:53 11:54 11:55 11:56
112 124 117 119 121 102 114 124 126 117 122 122 120 123 117 121 113 1.70E-04 103 108 #N/A 104 3.33E-04 113 4.20E-04 121 #N/A 113 117 109 1.97E-03 105 111 #N/A 115 4.00E-03 111 9.32E-03 112 #N/A 111 2.44E-02 109 5.10E-02 111 111 117 121 124 120 113 112 111 117 113 116 117 113 119 119 112 112 108 107 103 95 96
113 116 112 108 99 102 105 110 119 119 114 116 117 115 116 112 109
112.5 120 114.5 113.5 110 102 109.5 117 122.5 118 118 119 118.5 119 116.5 116.5 111
112.5 120 114.5 #N/A 110 102 109.5 117 122.5 118 #N/A #N/A #N/A #N/A #N/A #N/A 111
#N/A 120 #N/A #N/A #N/A 102 109.5 117 #N/A #N/A #N/A #N/A #N/A #N/A #N/A #N/A #N/A
25 25 25 25 25 25 25 25 24.5 24.5 24.5 24.5 24.5 24.5 24.5 24.5 24.5
25 #N/A #N/A #N/A #N/A #N/A #N/A #N/A 24.5 #N/A #N/A #N/A #N/A #N/A #N/A #N/A #N/A
77 77 77 77 77 77 77 77 76.1 76.1 76.1 76.1 76.1 76.1 76.1 76.1 76.1
6.26E-05 #N/A 6.06E-05 #N/A 6.16E-05 #N/A 6.16E-05 #N/A 6.16E-05 #N/A 6.06E-05 #N/A 6.12E-05 #N/A 6.19E-05 #N/A 6.16E-05 #N/A 6.19E-05 #N/A 6.26E-05 #N/A 6.26E-05 #N/A 6.36E-05 #N/A 6.40E-05 #N/A 6.76E-05 #N/A 7.07E-05 #N/A 0.0001695
106 107
104.5 107.5
104.5 107.5
104.5 #N/A
24.5 25
#N/A 25
76.1 77
0.000264 2.64E-04 0.0002389
106
105
#N/A
#N/A
25
#N/A
77
0.0003331
105
109
109
#N/A
25
#N/A
77
0.0004202
100
110.5
#N/A
#N/A
25.5
25.5
77.9
0.0004133
108 111 114
110.5 114 111.5
#N/A 114 #N/A
#N/A #N/A #N/A
25.5 26 26
#N/A 26 #N/A
77.9 78.8 78.8
0.000488 4.88E-04 0.000411 4.11E-04 0.0019685
105 108
105 109.5
105 109.5
105 #N/A
26 26
#N/A #N/A
78.8 78.8
0.002965 2.96E-03 0.0031686
114
114.5
114.5
#N/A
26.5
26.5
79.7
0.0039979
112
111.5
111.5
#N/A
26.5
#N/A
79.7
0.0093242
112
112
#N/A
#N/A
26.5
#N/A
79.7
0.0088221
112
111.5
#N/A
#N/A
26.5
#N/A
79.7
0.0244274
110
109.5
#N/A
#N/A
27
27
80.6
0.0510017
110 111 115 121 123 121 115 113 111 118 114 114 118 113 118 118 112 101 108 108 105 101 95
110.5 111 116 121 123.5 120.5 114 112.5 111 117.5 113.5 115 117.5 113 118.5 118.5 112 106.5 108 107.5 104 98 95.5
#N/A #N/A 116 121 #N/A #N/A 114 #N/A #N/A 117.5 113.5 #N/A #N/A 113 118.5 #N/A 112 106.5 #N/A #N/A 104 98 95.5
#N/A #N/A #N/A #N/A #N/A #N/A 114 #N/A #N/A 117.5 #N/A #N/A #N/A #N/A #N/A #N/A 112 #N/A #N/A #N/A #N/A 98 #N/A
27 27.5 27.5 28 28 28 28.5 28.5 29 29 29.5 29.5 29.5 30 30 30 30.5 30.5 30.5 31 30.5 30.5 30.5
#N/A 27.5 #N/A 28 #N/A #N/A 28.5 #N/A 29 #N/A 29.5 #N/A #N/A 30 #N/A #N/A 30.5 #N/A #N/A 31 30.5 #N/A #N/A
80.6 81.5 81.5 82.4 82.4 82.4 83.3 83.3 84.2 84.2 85.1 85.1 85.1 86 86 86 86.9 86.9 86.9 87.8 86.9 86.9 86.9
0.180159 1.80E-01 0.342372 3.42E-01 0.459093 4.59E-01 0.56656 5.67E-01 0.672612 6.73E-01 0.78103 7.81E-01 0.901918 9.02E-01 1.05896 1.06E+00 1.22286 1.22E+00 1.55146 1.55E+00 1.714 1.71E+00 2.09193 2.09E+00 3.5985 3.60E+00 4.15548 4.16E+00 4.87901 4.88E+00 5.1853 #N/A 4.2958 4.30E+00 2.91593 2.92E+00 4.20174 4.20E+00 2.85208 2.85E+00 0.62246 6.22E-01 0.504389 5.04E-01 0.128535 1.29E-01
11:57 11:58 11:59 12:00 12:01 12:02
95 95 94 94 94 7.43E-02 94 3.42E-02
12:03
95 93 92 84 84
95 94 93 89 89
#N/A #N/A #N/A 89 #N/A
#N/A #N/A #N/A #N/A #N/A
30.5 30 30 30 30.5
#N/A 30 #N/A #N/A 30.5
86.9 86 86 86 86.9
0.490622 4.91E-01 0.404216 4.04E-01 0.293219 2.93E-01 0.165805 1.66E-01 0.0743095
92
93
93
#N/A
30.5
#N/A
86.9
0.0342381
96
96
96
#N/A
30.5
#N/A
86.9
0.0401995
71
71
39
16
71
24
71
71
4.02E-02 dp count 70
42
C4: Walk Monitoring Data seconds StartSecond A: BPM, B: remove same, C: 1% BPM (coarse inference), D: remove same, E: 1% + beacon (remove same), F: Beacon, G: 0.8% (fine inference), H: 0.8% + beacon, I: 1% + beacon Time A 10:53:03 AM 10:53:06 AM 10:53:09 AM 10:53:12 AM 10:53:15 AM 10:53:18 AM 10:53:19 AM 10:53:20 AM 10:53:21 AM 10:53:24 AM 10:53:25 AM 10:53:26 AM 10:53:27 AM 10:54:02 AM 10:54:03 AM 10:54:04 AM 10:54:07 AM 10:54:10 AM 10:54:13 AM 10:54:16 AM 10:54:19 AM 10:54:22 AM 10:54:25 AM 10:54:28 AM 10:54:31 AM 10:54:32 AM 10:54:35 AM 10:54:36 AM 10:54:37 AM 10:54:38 AM 10:54:39 AM 10:54:42 AM 10:54:45 AM 10:54:48 AM 10:54:49 AM 10:54:51 AM 10:54:53 AM 10:54:56 AM 10:54:59 AM 10:55:02 AM 10:55:05 AM 10:55:08 AM 10:55:11 AM 10:55:14 AM 10:55:17 AM 10:55:18 AM 10:55:21 AM
B 70 70 70 70 70 70 84 88 105 114 120 127 133 96 95 94 94 94 94 94 94 94 94 94 94 94 95 96 98 99 100 101 101 101 101 100 101 101 101 101 101 100 100 100 100 101 101
C 70
D
E
F 70
84 88 105 114 120 127 133 96 95 94
84 88 105 114 120 127 133 96 95 94
88 105 114 120 127 133 96 95 94
88 105 114 120 127 133 96 95 94
95 96 98 99 100 101
95 96 98 99 100
96 98 99 100
96 98 99 100
G 70
96
100 101
101 100
101
101
H 70
I 70
70
88 105 114 120 127 133 96 95 94
88 105 114 120 127 133 96 95 94
84 88 105 114 120 127 133 96 95 94
96 98 99 100 101
96 98 99 100 101
101
101
101
95 96 98 99 100
101
10:55:24 AM 10:55:27 AM 10:55:30 AM 10:55:32 AM 10:55:34 AM 10:55:35 AM 10:55:36 AM 10:55:37 AM 10:55:39 AM 10:55:40 AM 10:55:41 AM 10:55:42 AM 10:55:43 AM 10:55:46 AM 10:55:48 AM 10:55:50 AM 10:55:52 AM 10:55:53 AM 10:55:54 AM 10:55:55 AM 10:55:56 AM 10:55:57 AM 10:55:58 AM 10:55:59 AM 10:56:00 AM 10:56:02 AM 10:56:04 AM 10:56:05 AM 10:56:06 AM 10:56:07 AM 10:56:09 AM 10:56:10 AM 10:56:11 AM 10:56:12 AM 10:56:15 AM 10:56:18 AM 10:56:21 AM 10:56:22 AM 10:56:25 AM 10:56:27 AM 10:56:29 AM 10:56:32 AM 10:56:33 AM 10:56:35 AM 10:56:37 AM 10:56:38 AM 10:56:40 AM 10:56:43 AM 10:56:46 AM 10:56:48 AM 10:56:51 AM 10:56:52 AM 10:56:53 AM 10:56:54 AM 10:56:55 AM 10:56:56 AM 10:56:57 AM 10:56:58 AM 10:56:59 AM 10:57:00 AM 10:57:03 AM 10:57:06 AM 10:57:08 AM 10:57:09 AM 10:57:10 AM 10:57:11 AM 10:57:12 AM
101 101 101 100 101 101 102 102 104 105 106 107 108 109 110 111 112 111 109 108 107 106 105 104 104 103 104 105 106 107 108 108 109 110 110 110 110 111 111 112 113 113 114 113 112 111 110 110 110 111 112 113 114 115 116 115 114 115 116 116 115 115 114 112 111 109 108
100 101
101
101
105 106 107 108 109 110 111 112 111 109 108 107 106 105 104
105 106 107 108 109 110 111 112 111 109 108 107 106 105 104
103 104 105 106 107 108
104 105 106 107 108
104 105 106 107 108
109 110
110
110
112 113
113
113
114 113 112 111 110
113 112 111 110
113 112 111 110
111 112 113 114 115 116 115 114 115 116
112 113 114 115 116 115 114 115 116
112 113 114 115 116 115 114 115 116 116
102 104 105 106 107 108 109 110 111 112 111 109 108 107 106 105 104
104
109
104
109
109
109
111
116
116
116
115 114 112 111 109 108
112
112
112
109
109
109
112 111 109 108
112 111 109 108
112 109
10:57:13 AM 10:57:14 AM 10:57:15 AM 10:57:16 AM 10:57:17 AM 10:57:20 AM 10:57:21 AM 10:57:24 AM 10:57:26 AM 10:57:28 AM 10:57:31 AM 10:57:32 AM 10:57:33 AM 10:57:34 AM 10:57:35 AM 10:57:36 AM 10:57:37 AM 10:57:39 AM 10:57:40 AM 10:57:41 AM 10:57:42 AM 10:57:43 AM 10:57:44 AM 10:57:45 AM 10:57:46 AM 10:57:47 AM 10:57:49 AM 10:57:51 AM 10:57:52 AM 10:57:54 AM 10:57:55 AM 10:57:57 AM 10:58:00 AM 10:58:01 AM 10:58:03 AM 10:58:04 AM 10:58:05 AM 10:58:06 AM 10:58:07 AM 10:58:08 AM 10:58:11 AM 10:58:14 AM 10:58:17 AM 10:58:20 AM 10:58:23 AM 10:58:24 AM 10:58:25 AM 10:58:26 AM 10:58:27 AM 10:58:28 AM 10:58:31 AM 10:58:32 AM 10:58:33 AM 10:58:34 AM 10:58:35 AM 10:58:36 AM 10:58:37 AM 10:58:38 AM 10:58:39 AM 10:58:40 AM 10:58:42 AM 10:58:43 AM 10:58:44 AM 10:58:46 AM 10:58:48 AM 10:58:49 AM 10:58:51 AM
107 108 110 111 112 112 113 114 115 116 115 116 116 116 116 116 117 118 119 117 116 114 113 112 111 110 109 108 107 106 105 104 104 105 106 107 108 109 110 111 112 113 114 115 115 116 116 117 118 119 120 118 117 116 115 114 113 111 110 109 108 108 107 108 109 110 111
107 108 110 111 112
107 108 110 111 112
107 108 110 111 112
113 114 115 116 115 116
114 115 116 115 116
114 115 116 115 116
117 118 119 117 116 114 113 112 111 110 109 108 107 106 105 104
118 119 117 116 114 113 112 111 110 109 108 107 106 105 104
118 119 117 116 114 113 112 111 110 109 108 107 106 105 104 104
110
110
110
117
117
117
114
114
114
104 105 106 107 108 109 110 111 112 113 114 115
104 106 107 108 109 110 111 112 113 114 115
106 107 108 109 110 111 112 113 114 115
118 119 120 118 117 116 115 114 113 111 110 109 108
118 119 120 118 117 116 115 114 113 111 110 109 108
108 109 110 111
108 109 110 111
110
117 114
104
116 117 118 119 120 118 117 116 115 114 113 111 110 109 108 107 108 109 110 111
118
118
118
111
111
111
118
111
10:58:54 AM 10:58:55 AM 10:58:56 AM 10:58:58 AM 10:58:59 AM 10:59:02 AM 10:59:03 AM 10:59:04 AM 10:59:07 AM 10:59:10 AM 10:59:13 AM 10:59:14 AM 10:59:15 AM 10:59:16 AM 10:59:17 AM 10:59:18 AM 10:59:19 AM 10:59:20 AM 10:59:21 AM 10:59:22 AM 10:59:24 AM 10:59:27 AM 10:59:30 AM 10:59:33 AM 10:59:34 AM 10:59:37 AM 10:59:40 AM 10:59:43 AM 10:59:46 AM 10:59:49 AM 10:59:51 AM 10:59:54 AM 10:59:55 AM 10:59:56 AM 10:59:58 AM 10:59:59 AM 11:00:02 AM 11:00:05 AM 11:00:08 AM 11:00:11 AM 11:00:14 AM 11:00:15 AM 11:00:18 AM 11:00:21 AM 11:00:23 AM 11:00:25 AM 11:00:28 AM 11:00:31 AM 11:00:32 AM 11:00:34 AM 11:00:37 AM 11:00:39 AM 11:00:40 AM 11:00:43 AM 11:00:45 AM 11:00:47 AM 11:00:50 AM 11:00:53 AM 11:00:56 AM 11:00:58 AM 11:00:59 AM 11:01:02 AM 11:01:05 AM 11:01:06 AM 11:01:09 AM 11:01:10 AM 11:01:13 AM
111 110 109 108 107 106 106 105 104 105 105 106 107 109 110 111 112 113 114 113 112 111 110 110 109 109 108 108 108 108 107 107 106 106 106 105 105 105 105 105 105 105 105 105 104 103 103 102 103 104 105 107 107 106 105 104 104 104 104 103 103 103 103 103 103 102 102
110 109 108 107 106
106
106
105 104 105 106 107 109 110 111 112 113 114 113 112 111 110
109
109
109
109 108 107 106
109 108 107 106
104 105
104 105
107 109 110 111 112 113 114 113 112 111 110
107 109 110 111 112 113 114 113 112 111 110
106
109
109 108
107 106
105 105
105
105
104 103
103
103
102 103 104 105 107
103 104 105 107
103 104 105 107
105 104
105 104
107
107
107
106 105 104
105
107
103 103
102
103
103
103
11:01:16 AM 11:01:19 AM 11:01:20 AM 11:01:22 AM 11:01:24 AM 11:01:26 AM 11:01:29 AM 11:01:31 AM 11:01:33 AM 11:01:35 AM 11:01:37 AM 11:01:38 AM 11:01:40 AM 11:01:43 AM 11:01:46 AM 11:01:49 AM 11:01:51 AM 11:01:54 AM 11:01:55 AM 11:01:57 AM 11:01:58 AM 11:02:01 AM 11:02:04 AM 11:02:07 AM 11:02:08 AM 11:02:09 AM 11:02:12 AM 11:02:15 AM 11:02:18 AM 11:02:20 AM 11:02:23 AM 11:02:26 AM 11:02:29 AM 11:02:31 AM 11:02:32 AM 11:02:33 AM 11:02:35 AM 11:02:38 AM 11:02:39 AM 11:02:42 AM 11:02:43 AM 11:02:45 AM 11:02:46 AM 11:02:48 AM 11:02:49 AM 11:02:52 AM 11:02:53 AM 11:02:54 AM 11:02:55 AM 11:02:56 AM 11:02:59 AM 11:03:02 AM 11:03:03 AM 11:03:04 AM 11:03:06 AM 11:03:07 AM 11:03:10 AM 11:03:11 AM 11:03:12 AM 11:03:15 AM 11:03:16 AM 11:03:19 AM 11:03:22 AM 11:03:25 AM 11:03:28 AM 11:03:31 AM 11:03:34 AM
102 101 101 101 102 101 102 103 104 105 106 107 108 108 109 108 109 109 110 111 112 112 112 112 113 111 111 111 111 110 110 110 111 112 113 114 115 115 116 116 116 116 116 116 116 116 116 117 117 117 117 117 116 115 114 114 114 115 114 114 115 116 116 116 116 116 116
101
102 101 102 103 104 105 106 107 108
101 102 103 104 105 106 107 108
101 102 103 104 105 106 107 108
109 108 109
108 109
108 109
110 111 112
111 112
111 112 112
112
111
111
111
112 113 114 115
112 113 114 115
112
113 111
111
111
112
111
110
111 112 113 114 115 116
117
117
117
116 115 114
117
117
115 114
115 114
115 114
114
114
115 116
116
116
117
11:03:37 AM 11:03:40 AM 11:03:43 AM 11:03:46 AM 11:03:49 AM 11:03:52 AM 11:03:55 AM 11:03:56 AM 11:03:59 AM 11:04:02 AM 11:04:05 AM 11:04:08 AM 11:04:09 AM 11:04:11 AM 11:04:12 AM 11:04:15 AM 11:04:17 AM 11:04:20 AM 11:04:23 AM 11:04:26 AM 11:04:27 AM 11:04:29 AM 11:04:32 AM 11:04:35 AM 11:04:38 AM 11:04:40 AM 11:04:43 AM 11:04:46 AM 11:04:49 AM 11:04:50 AM 11:04:53 AM 11:04:56 AM 11:04:57 AM 11:05:00 AM 11:05:01 AM 11:05:04 AM 11:05:07 AM 11:05:10 AM 11:05:11 AM 11:05:12 AM 11:05:13 AM 11:05:14 AM 11:05:15 AM 11:05:17 AM 11:05:18 AM 11:05:21 AM 11:05:24 AM 11:05:25 AM 11:05:26 AM 11:05:27 AM 11:05:28 AM 11:05:29 AM 11:05:30 AM 11:05:31 AM 11:05:32 AM 11:05:34 AM 11:05:36 AM 11:05:39 AM 11:05:40 AM 11:05:41 AM 11:05:44 AM 11:05:45 AM 11:05:46 AM 11:05:49 AM 11:05:52 AM 11:05:54 AM 11:05:57 AM
116 116 116 116 116 116 116 116 116 116 116 116 115 114 113 113 112 112 113 113 114 113 113 113 113 112 111 110 110 109 109 109 110 111 111 111 111 112 111 110 109 108 107 106 105 105 106 107 108 109 110 111 112 113 112 111 110 110 109 108 107 106 105 105 104 103 103
115 114 113
114 113
114 113
114 113
113
113
112 111 110
111 110
111 110
111
111
112 111 110 109 108 107 106 105
111 110 109 108 107 106 105
111 110 109 108 107 106 105
106 107 108 109 110 111 112 113 112 111 110
107 108 109 110 111 112 113 112 111 110
107 108 109 110 111 112 113 112 111 110
109 108 107 106 105
108 107 106 105
108 107 106 105
104 103
103
103
112 113
109
110 111
111
111
111
11:05:58 AM 11:06:01 AM 11:06:04 AM 11:06:07 AM 11:06:10 AM 11:06:11 AM 11:06:14 AM 11:06:17 AM 11:06:20 AM 11:06:23 AM 11:06:26 AM 11:06:27 AM 11:06:28 AM 11:06:29 AM 11:06:30 AM 11:06:32 AM 11:06:35 AM 11:06:37 AM 11:06:40 AM 11:06:42 AM 11:06:44 AM 11:06:45 AM 11:06:48 AM 11:06:50 AM 11:06:51 AM 11:06:54 AM 11:06:56 AM 11:06:57 AM 11:06:59 AM 11:07:02 AM 11:07:05 AM 11:07:08 AM 11:07:11 AM 11:07:13 AM 11:07:16 AM 11:07:19 AM 11:07:22 AM 11:07:23 AM 11:07:24 AM 11:07:25 AM 11:07:26 AM 11:07:27 AM 11:07:28 AM 11:07:30 AM 11:07:32 AM 11:07:33 AM 11:07:34 AM 11:07:36 AM 11:07:37 AM 11:07:39 AM 11:07:42 AM 11:07:43 AM 11:07:44 AM 11:07:45 AM 11:07:46 AM 11:07:49 AM 11:07:50 AM 11:07:51 AM 11:07:52 AM 11:07:54 AM 11:07:57 AM 11:08:00 AM 11:08:03 AM 11:08:05 AM 11:08:08 AM 11:08:11 AM 11:08:14 AM
102 102 102 102 101 100 100 100 99 99 99 98 97 96 95 96 96 97 98 99 100 100 100 99 99 99 99 100 101 102 102 103 103 104 104 104 103 102 101 99 98 96 95 96 97 99 100 100 101 101 101 102 102 103 104 105 106 106 107 106 106 106 105 104 103 103 103
102 102
102
101 100
102
100
100
102
99
98 97 96 95 96
98 97 96 95 96
97 96 95 96
97 96 95 96
97 96 95 96
97 96 95 96
98 97 96 95 96
97 98 99 100
97 98 99 100
98 99 100
98 99 100
98 99 100
98 99 100
97 98 99 100
102
101 102
101 102
102
102 101 99 98 96 95 96 97 99 100
102 101 99 98 96 95 96 97 99 100
99 98 96 95 96 97 99 100
103 104 105 106
104 105 106
104 105 106
107 106
106
106
99
100 101 102
100
100 102
103 104
103 102 101 99 98 96 95 96 97 99 100
99 98 96 95 96 97 99 100
99 98 96 95 96 97 99 100
99 98 96 95 96 97 99 100
101
102
106 105 104 103
106
106 104 103
104 103
106
11:08:17 AM 11:08:20 AM 11:08:21 AM 11:08:22 AM 11:08:23 AM 11:08:26 AM 11:08:29 AM 11:08:31 AM 11:08:32 AM 11:08:35 AM 11:08:38 AM 11:08:39 AM 11:08:42 AM 11:08:43 AM 11:08:46 AM 11:08:49 AM 11:08:52 AM 11:08:53 AM 11:08:56 AM 11:08:59 AM 11:09:02 AM 11:09:05 AM 11:09:08 AM 11:09:11 AM 11:09:14 AM 11:09:16 AM 11:09:19 AM 11:09:20 AM 11:09:23 AM 11:09:26 AM 11:09:27 AM 11:09:29 AM 11:09:31 AM 11:09:34 AM 11:09:35 AM 11:09:36 AM 11:09:37 AM 11:09:38 AM 11:09:39 AM 11:09:41 AM 11:09:42 AM 11:09:43 AM 11:09:45 AM 11:09:47 AM 11:09:48 AM 11:09:49 AM 11:09:51 AM 11:09:52 AM 11:09:53 AM 11:09:54 AM 11:09:56 AM 11:09:59 AM 11:10:01 AM 11:10:04 AM 11:10:06 AM 11:10:09 AM 11:10:12 AM 11:10:15 AM 11:10:18 AM 11:10:19 AM 11:10:22 AM 11:10:25 AM 11:10:26 AM 11:10:27 AM 11:10:30 AM 11:10:31 AM 11:10:33 AM
103 105 106 107 106 106 106 105 105 105 105 104 104 104 104 104 104 105 105 105 105 104 104 105 105 106 106 107 108 109 110 111 112 112 112 112 112 113 113 113 113 113 114 114 114 114 114 114 114 114 114 114 115 116 117 117 117 117 117 118 119 119 119 120 120 120 120
105 106 107 106
105
105 106 107 106
106 107 106
105
104
105
105
105
105
105
104 105 106 107 108 109 110 111 112
108 109 110 111 112
108 109 110 111 112
116 117
115 116 117
119
119
113
114
115 116 117
118 119
120
115
115
115
11:10:36 AM 11:10:39 AM 11:10:40 AM 11:10:43 AM 11:10:46 AM 11:10:49 AM 11:10:51 AM 11:10:54 AM 11:10:57 AM 11:11:00 AM 11:11:03 AM 11:11:06 AM 11:11:09 AM 11:11:12 AM 11:11:14 AM 11:11:17 AM 11:11:18 AM 11:11:19 AM 11:11:22 AM 11:11:23 AM 11:11:26 AM 11:11:27 AM 11:11:28 AM 11:11:30 AM 11:11:33 AM 11:11:36 AM 11:11:39 AM 11:11:40 AM 11:11:43 AM 11:11:46 AM 11:11:49 AM 11:11:50 AM 11:11:53 AM 11:11:56 AM 11:11:59 AM 11:12:01 AM 11:12:03 AM 11:12:06 AM 11:12:09 AM 11:12:12 AM 11:12:15 AM 11:12:18 AM 11:12:21 AM 11:12:24 AM 11:12:27 AM 11:12:30 AM 11:12:33 AM 11:12:36 AM 11:12:38 AM 11:12:39 AM 11:12:42 AM 11:12:45 AM 11:12:48 AM 11:12:50 AM 11:12:53 AM 11:12:56 AM 11:12:58 AM 11:13:01 AM 11:13:02 AM 11:13:05 AM 11:13:08 AM 11:13:11 AM 11:13:14 AM 11:13:15 AM 11:13:18 AM 11:13:19 AM 11:13:22 AM
120 120 121 121 121 121 122 122 122 122 122 122 122 122 121 120 121 120 120 119 119 120 120 119 119 118 118 117 117 117 117 116 116 116 115 116 115 115 115 115 115 114 114 114 114 114 115 115 114 114 114 114 114 113 113 113 114 114 115 115 115 115 115 116 116 115 115
121
122
122
122
121 120 121 120
122
120 121 120
120 121 120
122
119 120 119 118 117
116
115 116 115
116
116
116 115
116 115
116
114
114
114
114
114
114
115 114
113
114 115
116 115
11:13:25 AM 11:13:28 AM 11:13:31 AM 11:13:34 AM 11:13:35 AM 11:13:38 AM 11:13:41 AM 11:13:44 AM 11:13:47 AM 11:13:48 AM 11:13:51 AM 11:13:54 AM 11:13:57 AM 11:13:59 AM 11:14:02 AM 11:14:05 AM 11:14:08 AM 11:14:09 AM 11:14:12 AM 11:14:15 AM 11:14:16 AM 11:14:19 AM 11:14:21 AM 11:14:24 AM 11:14:27 AM 11:14:30 AM 11:14:33 AM 11:14:36 AM 11:14:39 AM 11:14:42 AM 11:14:45 AM 11:14:48 AM 11:14:51 AM 11:14:54 AM 11:14:57 AM 11:15:00 AM 11:15:01 AM 11:15:02 AM 11:15:04 AM 11:15:05 AM 11:15:06 AM 11:15:07 AM 11:15:10 AM 11:15:11 AM 11:15:12 AM 11:15:15 AM 11:15:17 AM 11:15:19 AM 11:15:20 AM 11:15:23 AM 11:15:24 AM 11:15:26 AM 11:15:29 AM 11:15:30 AM 11:15:31 AM 11:15:32 AM 11:15:34 AM 11:15:37 AM 11:15:40 AM 11:15:43 AM 11:15:46 AM 11:15:49 AM 11:15:51 AM 11:15:52 AM 11:15:55 AM 11:15:58 AM 11:16:01 AM
116 116 116 116 117 117 117 117 118 118 118 118 118 119 119 119 119 118 117 118 118 118 117 117 117 117 117 117 117 117 117 117 117 117 117 117 117 117 117 117 117 117 117 117 117 117 117 117 116 116 115 114 114 113 112 112 113 114 114 115 115 115 115 115 115 115 115
116
117
118
119 119
119
118 117 118
119
117 118
119
117 118
117
117
117
117
117
116 115 114
114
114
113 112
112
112
113 114
114
114
115
115
115
115
115
11:16:04 AM 11:16:06 AM 11:16:08 AM 11:16:11 AM 11:16:12 AM 11:16:15 AM 11:16:18 AM 11:16:21 AM 11:16:24 AM 11:16:27 AM 11:16:30 AM 11:16:33 AM 11:16:36 AM 11:16:39 AM 11:16:42 AM 11:16:45 AM 11:16:48 AM 11:16:50 AM 11:16:53 AM 11:16:54 AM 11:16:56 AM 11:16:57 AM 11:17:00 AM 11:17:01 AM 11:17:03 AM 11:17:05 AM 11:17:07 AM 11:17:10 AM 11:17:13 AM 11:17:16 AM 11:17:19 AM 11:17:22 AM 11:17:25 AM 11:17:28 AM 11:17:31 AM 11:17:34 AM 11:17:37 AM 11:17:40 AM 11:17:41 AM 11:17:44 AM 11:17:47 AM 11:17:50 AM 11:17:53 AM 11:17:56 AM 11:17:59 AM 11:18:02 AM 11:18:05 AM 11:18:08 AM 11:18:11 AM 11:18:14 AM 11:18:15 AM 11:18:16 AM 11:18:19 AM 11:18:22 AM 11:18:24 AM 11:18:27 AM 11:18:30 AM 11:18:33 AM 11:18:36 AM 11:18:39 AM 11:18:42 AM 11:18:45 AM 11:18:46 AM 11:18:49 AM 11:18:51 AM 11:18:54 AM 11:18:57 AM
115 116 115 115 116 116 116 116 116 116 116 116 117 117 117 117 117 116 116 115 115 114 114 114 113 113 113 113 113 113 113 113 113 113 112 112 112 112 111 111 111 111 111 110 110 110 110 110 110 109 109 110 110 110 109 109 109 109 109 109 109 109 108 108 107 107 107
116 115
115
115
116
117
116 115 114 114
114
114
114
110
110
110
110
113
112
111
110
109 110
109
108 107
11:18:58 AM 11:19:01 AM 11:19:04 AM 11:19:07 AM 11:19:10 AM 11:19:13 AM 11:19:14 AM 11:19:17 AM 11:19:20 AM 11:19:23 AM 11:19:24 AM 11:19:27 AM 11:19:30 AM 11:19:33 AM 11:19:36 AM 11:19:39 AM 11:19:41 AM 11:19:44 AM 11:19:45 AM 11:19:48 AM 11:19:51 AM 11:19:54 AM 11:19:57 AM 11:19:58 AM 11:20:01 AM 11:20:04 AM 11:20:07 AM 11:20:08 AM 11:20:11 AM 11:20:14 AM 11:20:17 AM 11:20:20 AM 11:20:23 AM 11:20:26 AM 11:20:28 AM 11:20:31 AM 11:20:34 AM 11:20:35 AM 11:20:38 AM 11:20:41 AM 11:20:44 AM 11:20:45 AM 11:20:48 AM 11:20:49 AM 11:20:52 AM 11:20:55 AM 11:20:56 AM 11:20:57 AM 11:20:58 AM 11:21:00 AM 11:21:01 AM 11:21:02 AM 11:21:04 AM 11:21:06 AM 11:21:09 AM 11:21:10 AM 11:21:13 AM 11:21:16 AM 11:21:19 AM 11:21:22 AM 11:21:25 AM 11:21:26 AM 11:21:29 AM 11:21:30 AM 11:21:31 AM 11:21:32 AM 11:21:33 AM
106 106 106 107 107 107 106 106 106 106 106 106 106 106 106 106 107 107 106 107 107 107 107 106 106 106 106 107 107 107 107 107 107 107 106 106 106 106 106 106 106 107 107 108 108 109 110 111 112 111 110 109 108 107 107 106 106 106 105 105 105 104 105 106 106 106 105
106 106
106
106
106
107
106
107 106 107
107
107
106 106
106
106
106
107
106
107 108 109 110 111 112 111 110 109 108 107
111
111
110 111 112 111 110 109 108 107
110 111 112 111 110 109 108 107
105 106
105 106
106
105
104 105 106
105
111
11:21:35 AM 11:21:37 AM 11:21:39 AM 11:21:40 AM 11:21:43 AM 11:21:46 AM 11:21:49 AM 11:21:51 AM 11:21:54 AM 11:21:57 AM 11:22:00 AM 11:22:03 AM 11:22:06 AM 11:22:09 AM 11:22:12 AM 11:22:15 AM 11:22:18 AM 11:22:21 AM 11:22:24 AM 11:22:25 AM 11:22:26 AM 11:22:27 AM 11:22:28 AM 11:22:29 AM 11:22:30 AM 11:22:31 AM 11:22:32 AM 11:22:33 AM 11:22:34 AM 11:22:36 AM 11:22:39 AM 11:22:42 AM 11:22:45 AM 11:22:48 AM 11:22:51 AM 11:22:53 AM 11:22:56 AM 11:22:59 AM 11:23:00 AM 11:23:02 AM 11:23:04 AM 11:23:05 AM 11:23:06 AM 11:23:07 AM 11:23:08 AM 11:23:10 AM 11:23:11 AM 11:23:12 AM 11:23:13 AM 11:23:14 AM 11:23:17 AM 11:23:18 AM 11:23:21 AM 11:23:24 AM 11:23:27 AM 11:23:28 AM 11:23:31 AM 11:23:34 AM 11:23:35 AM 11:23:36 AM 11:23:39 AM 11:23:42 AM 11:23:45 AM 11:23:48 AM 11:23:50 AM 11:23:53 AM 11:23:54 AM
106 105 105 104 104 104 104 103 103 103 103 104 104 104 104 104 104 104 104 103 104 105 106 107 108 109 110 109 108 107 106 105 104 104 104 103 103 102 100 100 99 97 96 95 96 97 98 97 96 98 99 99 100 100 100 101 101 101 100 101 102 102 102 103 104 104 105
106 105
106 105
106 105
104
103
103
103
103
103
104
103 104 105 106 107 108 109 110 109 108 107 106 105 104
104 105 106 107 108 109 110 109 108 107 106 105 104
104 105 106 107 108 109 110 109 108 107 106 105 104
100
100
100
97 96 95 96 97 98 97 96 98 99
97 96 95 96 97 98 97 96 98 99
97 96 95 96 97 98 97 96 98 99
103 102 100
100
100
100
99 97 96 95 96 97 98 97 96 98 99
97 96 95 96 97 98 97 96 98 99
97 96 95 96 97 98 97 96 98 99
97 96 95 96 97 98 97 96 98 99
100
100
100
100
101
100 101 102
101 102
101 102
103 104
104
104
105
11:23:55 AM 11:23:58 AM 11:24:01 AM 11:24:04 AM 11:24:06 AM 11:24:09 AM 11:24:12 AM 11:24:15 AM 11:24:18 AM 11:24:21 AM 11:24:23 AM 11:24:24 AM 11:24:27 AM 11:24:29 AM 11:24:32 AM 11:24:35 AM 11:24:38 AM 11:24:39 AM 11:24:42 AM 11:24:43 AM 11:24:46 AM 11:24:48 AM 11:24:51 AM 11:24:53 AM 11:24:56 AM 11:24:59 AM 11:25:02 AM 11:25:03 AM 11:25:05 AM 11:25:08 AM 11:25:11 AM 11:25:13 AM 11:25:16 AM 11:25:19 AM 11:25:22 AM 11:25:25 AM 11:25:28 AM 11:25:31 AM 11:25:32 AM 11:25:34 AM 11:25:36 AM 11:25:37 AM 11:25:40 AM 11:25:43 AM 11:25:45 AM 11:25:48 AM 11:25:49 AM 11:25:52 AM 11:25:55 AM 11:25:58 AM 11:26:01 AM 11:26:04 AM 11:26:07 AM 11:26:08 AM 11:26:10 AM 11:26:12 AM 11:26:14 AM 11:26:16 AM 11:26:18 AM 11:26:20 AM 11:26:23 AM 11:26:26 AM 11:26:29 AM 11:26:32 AM 11:26:34 AM 11:26:35 AM 11:26:36 AM
106 106 106 106 105 105 105 105 105 105 106 106 106 107 107 108 109 110 110 111 111 112 112 113 113 113 113 112 111 111 111 112 112 112 112 112 112 112 112 111 110 109 109 109 110 110 111 111 111 111 111 111 112 113 114 115 116 117 118 119 120 120 119 118 117 117 116
106
106 106
106
106 106
106
105
106
107 108 109 110
109 110
109 110
111 112 113
113
113
112 111
113 111
111
110 109
110 109
113
112
111 110 109
110 111
111
111
111
112 113 114 115 116 117 118 119 120
113 114 115 116 117 118 119 120
113 114 115 116 117 118 119 120
119 118 117
118 117
118 117
116
111
11:26:38 AM 11:26:39 AM 11:26:41 AM 11:26:42 AM 11:26:44 AM 11:26:46 AM 11:26:49 AM 11:26:52 AM 11:26:53 AM 11:26:56 AM 11:26:59 AM 11:27:02 AM 11:27:05 AM 11:27:07 AM 11:27:10 AM 11:27:11 AM 11:27:14 AM 11:27:17 AM 11:27:20 AM 11:27:23 AM 11:27:26 AM 11:27:29 AM 11:27:30 AM 11:27:33 AM 11:27:36 AM 11:27:37 AM 11:27:39 AM 11:27:41 AM 11:27:44 AM 11:27:47 AM 11:27:50 AM 11:27:53 AM 11:27:56 AM 11:27:59 AM 11:28:01 AM 11:28:04 AM 11:28:07 AM 11:28:10 AM 11:28:11 AM 11:28:14 AM 11:28:17 AM 11:28:20 AM 11:28:22 AM 11:28:23 AM 11:28:26 AM 11:28:27 AM 11:28:29 AM 11:28:31 AM 11:28:33 AM 11:28:36 AM 11:28:39 AM 11:28:40 AM 11:28:41 AM 11:28:43 AM 11:28:46 AM 11:28:49 AM 11:28:52 AM 11:28:53 AM 11:28:56 AM 11:28:59 AM 11:29:00 AM 11:29:01 AM 11:29:04 AM 11:29:05 AM 11:29:06 AM 11:29:09 AM 11:29:12 AM
115 114 113 112 111 110 109 109 108 108 108 108 107 106 106 105 105 105 105 105 105 105 104 104 104 104 105 104 104 104 104 104 104 104 105 105 105 105 106 106 106 107 106 105 106 107 108 109 110 111 111 111 111 110 109 109 109 110 110 110 110 111 111 111 112 112 112
115 114 113 112 111 110 109
115 114 113 112 111 110 109
115 114 113 112 111 110 109
108
108
108
107 106
108 106
106
104
104
108
105
104
105 104
105
105
105
105
105
106
107 106 105 106 107 108 109 110 111
106 105 106 107 108 109 110 111
106 105 106 107 108 109 110 111
110 109
109
109
110
110 111
112
110
110
110
11:29:15 AM 11:29:17 AM 11:29:20 AM 11:29:22 AM 11:29:25 AM 11:29:27 AM 11:29:30 AM 11:29:32 AM 11:29:35 AM 11:29:38 AM 11:29:41 AM 11:29:44 AM 11:29:45 AM 11:29:48 AM 11:29:51 AM 11:29:54 AM 11:29:55 AM 11:29:58 AM 11:30:01 AM 11:30:04 AM 11:30:07 AM 11:30:10 AM 11:30:13 AM 11:30:16 AM 11:30:19 AM 11:30:21 AM 11:30:24 AM 11:30:27 AM 11:30:30 AM 11:30:33 AM 11:30:36 AM 11:30:37 AM 11:30:40 AM 11:30:43 AM 11:30:45 AM 11:30:47 AM 11:30:50 AM 11:30:53 AM 11:30:56 AM 11:30:57 AM 11:31:00 AM 11:31:03 AM 11:31:05 AM 11:31:08 AM 11:31:11 AM 11:31:14 AM 11:31:17 AM 11:31:20 AM 11:31:23 AM 11:31:26 AM 11:31:29 AM 11:31:31 AM 11:31:33 AM 11:31:36 AM 11:31:38 AM 11:31:41 AM 11:31:44 AM 11:31:47 AM 11:31:48 AM 11:31:51 AM 11:31:54 AM 11:31:55 AM 11:31:56 AM 11:31:59 AM 11:32:02 AM 11:32:05 AM 11:32:06 AM
112 113 113 114 114 115 115 116 116 116 116 116 116 115 115 115 114 114 114 114 114 113 113 113 113 112 112 112 112 112 112 111 111 111 112 111 111 111 111 111 111 111 110 111 111 111 111 111 111 111 111 112 113 113 114 113 113 113 114 114 114 113 114 114 113 113 113
113 114 115 116
115
114 114
114
114
114
113
112
111
112 111
111
111
111
111
111
110 111
111
111
112 113
113
113
114 113
113
113
114
114
111
114
113 114 113
113
113
113
113
11:32:09 AM 11:32:12 AM 11:32:15 AM 11:32:18 AM 11:32:21 AM 11:32:24 AM 11:32:27 AM 11:32:30 AM 11:32:33 AM 11:32:35 AM 11:32:38 AM 11:32:41 AM 11:32:44 AM 11:32:47 AM 11:32:49 AM 11:32:52 AM 11:32:55 AM 11:32:58 AM 11:33:01 AM 11:33:04 AM 11:33:06 AM 11:33:09 AM 11:33:10 AM 11:33:11 AM 11:33:14 AM 11:33:17 AM 11:33:18 AM 11:33:21 AM 11:33:24 AM 11:33:27 AM 11:33:30 AM 11:33:33 AM 11:33:36 AM 11:33:39 AM 11:33:42 AM 11:33:45 AM 11:33:47 AM 11:33:49 AM 11:33:52 AM 11:33:54 AM 11:33:57 AM 11:34:00 AM 11:34:03 AM 11:34:06 AM 11:34:09 AM 11:34:11 AM 11:34:14 AM 11:34:17 AM 11:34:20 AM 11:34:23 AM 11:34:26 AM 11:34:29 AM 11:34:30 AM 11:34:31 AM 11:34:34 AM 11:34:37 AM 11:34:39 AM 11:34:40 AM 11:34:43 AM 11:34:46 AM 11:34:48 AM 11:34:49 AM 11:34:52 AM 11:34:55 AM 11:34:58 AM 11:35:00 AM 11:35:03 AM
113 113 113 113 113 113 113 113 113 112 112 112 111 111 110 110 110 110 110 110 109 109 110 110 110 110 110 109 110 110 110 110 110 109 109 109 110 110 110 109 110 111 111 111 111 111 111 111 111 111 111 111 110 110 111 111 112 111 111 110 109 108 108 108 108 109 109
112
111 110
110
110
110
110
110
110
110 111
110 111
112 111
111
111
110 109 108
109 108
109 108
110
109 110
109 110
109
110
109 110 111
111
111
111
110 111
109
109
109
109
109
11:35:05 AM 11:35:08 AM 11:35:11 AM 11:35:14 AM 11:35:17 AM 11:35:20 AM 11:35:23 AM 11:35:26 AM 11:35:29 AM 11:35:31 AM 11:35:34 AM 11:35:37 AM 11:35:40 AM 11:35:41 AM 11:35:44 AM 11:35:47 AM 11:35:50 AM 11:35:53 AM 11:35:56 AM 11:35:59 AM 11:36:02 AM 11:36:04 AM 11:36:06 AM 11:36:09 AM 11:36:12 AM 11:36:15 AM 11:36:18 AM 11:36:20 AM 11:36:23 AM 11:36:24 AM 11:36:27 AM 11:36:30 AM 11:36:31 AM 11:36:34 AM 11:36:37 AM 11:36:40 AM 11:36:42 AM 11:36:43 AM 11:36:44 AM 11:36:47 AM 11:36:48 AM 11:36:51 AM 11:36:52 AM 11:36:55 AM 11:36:58 AM 11:37:00 AM 11:37:03 AM 11:37:06 AM 11:37:09 AM 11:37:11 AM 11:37:14 AM 11:37:17 AM 11:37:20 AM 11:37:23 AM 11:37:26 AM 11:37:29 AM 11:37:32 AM 11:37:35 AM 11:37:38 AM 11:37:39 AM 11:37:42 AM 11:37:45 AM 11:37:48 AM 11:37:49 AM 11:37:52 AM 11:37:55 AM 11:37:58 AM
110 111 111 111 111 112 112 112 112 111 111 111 111 111 111 111 112 112 112 112 112 113 112 112 112 112 112 113 113 114 114 114 115 115 115 115 116 117 118 118 118 118 119 119 120 121 121 121 121 120 120 120 119 119 119 120 120 120 120 121 121 121 121 122 122 122 122
110 111
111
111
112
111
112
112
112
113 112
112 112
112
117 118
117 118
121
121
112
113 114
115
116 117 118
119 120 121
120
119
120
121
122
121
121
121
11:37:59 AM 11:38:02 AM 11:38:05 AM 11:38:07 AM 11:38:10 AM 11:38:13 AM 11:38:15 AM 11:38:18 AM 11:38:21 AM 11:38:24 AM 11:38:27 AM 11:38:30 AM 11:38:31 AM 11:38:33 AM 11:38:36 AM 11:38:39 AM 11:38:42 AM 11:38:45 AM 11:38:48 AM 11:38:51 AM 11:38:52 AM 11:38:55 AM 11:38:58 AM 11:39:01 AM 11:39:04 AM 11:39:06 AM 11:39:08 AM 11:39:09 AM 11:39:10 AM 11:39:12 AM 11:39:15 AM 11:39:18 AM 11:39:21 AM 11:39:24 AM 11:39:27 AM 11:39:28 AM 11:39:31 AM 11:39:34 AM 11:39:37 AM 11:39:40 AM 11:39:43 AM 11:39:46 AM 11:39:49 AM 11:39:51 AM 11:39:54 AM 11:39:56 AM 11:39:59 AM 11:40:02 AM 11:40:05 AM 11:40:08 AM 11:40:09 AM 11:40:12 AM 11:40:14 AM 11:40:17 AM 11:40:18 AM 11:40:21 AM 11:40:24 AM 11:40:26 AM 11:40:29 AM 11:40:32 AM 11:40:35 AM 11:40:38 AM 11:40:40 AM 11:40:43 AM 11:40:46 AM 11:40:47 AM 11:40:48 AM
122 122 122 121 121 121 122 123 123 123 123 123 124 124 124 124 124 124 124 124 123 123 123 122 122 122 122 122 122 123 122 122 122 122 121 120 120 120 120 120 120 120 120 119 119 119 119 118 118 118 117 117 116 116 116 115 115 114 114 114 113 113 114 114 115 116 115
122
122
122
122
121
122 123
123
123
124
123
122
122
122
122
123 122
122
122
121 120
120
120
122
119
118
118
118
118
117 116
115 114
113 114 115 116 115
116 115
116 115
118
11:40:51 AM 11:40:54 AM 11:40:57 AM 11:41:00 AM 11:41:03 AM 11:41:06 AM 11:41:09 AM 11:41:12 AM 11:41:13 AM 11:41:16 AM 11:41:19 AM 11:41:20 AM 11:41:23 AM 11:41:26 AM 11:41:27 AM 11:41:30 AM 11:41:33 AM 11:41:36 AM 11:41:38 AM 11:41:41 AM 11:41:44 AM 11:41:47 AM 11:41:49 AM 11:41:52 AM 11:41:55 AM 11:41:58 AM 11:42:01 AM 11:42:04 AM 11:42:07 AM 11:42:10 AM 11:42:13 AM 11:42:16 AM 11:42:19 AM 11:42:22 AM 11:42:25 AM 11:42:28 AM 11:42:31 AM 11:42:34 AM 11:42:37 AM 11:42:40 AM 11:42:43 AM 11:42:44 AM 11:42:47 AM 11:42:50 AM 11:42:51 AM 11:42:53 AM 11:42:56 AM 11:42:58 AM 11:43:01 AM 11:43:04 AM 11:43:07 AM 11:43:09 AM 11:43:12 AM 11:43:13 AM 11:43:16 AM 11:43:17 AM 11:43:20 AM 11:43:22 AM 11:43:25 AM 11:43:28 AM 11:43:30 AM 11:43:33 AM 11:43:36 AM 11:43:37 AM 11:43:39 AM 11:43:42 AM 11:43:44 AM
115 115 115 114 114 114 114 114 115 115 115 114 114 114 113 113 113 113 112 112 112 112 111 111 111 111 111 111 110 110 110 110 111 111 111 111 111 111 111 111 111 111 111 111 112 113 114 115 115 115 115 116 116 117 117 118 118 119 119 119 119 119 119 118 118 118 118
114
114
114
114
114
111
111
111
111
113 114 115 115
115
115
114
113
112
111
110
111
112 113 114 115 115
116 117 118 119
118
115
113 114 115 115
11:43:47 AM 11:43:48 AM 11:43:51 AM 11:43:54 AM 11:43:57 AM 11:44:00 AM 11:44:03 AM 11:44:06 AM 11:44:09 AM 11:44:12 AM 11:44:14 AM 11:44:17 AM 11:44:19 AM 11:44:22 AM 11:44:25 AM 11:44:28 AM 11:44:31 AM 11:44:34 AM 11:44:37 AM 11:44:39 AM 11:44:41 AM 11:44:42 AM 11:44:43 AM 11:44:46 AM 11:44:49 AM 11:44:50 AM 11:44:53 AM 11:44:56 AM 11:44:57 AM 11:44:58 AM 11:44:59 AM 11:45:00 AM 11:45:02 AM 11:45:04 AM 11:45:06 AM 11:45:08 AM 11:45:09 AM 11:45:10 AM 11:45:13 AM 11:45:16 AM 11:45:17 AM 11:45:20 AM 11:45:23 AM 11:45:25 AM 11:45:28 AM 11:45:31 AM 11:45:34 AM 11:45:37 AM 11:45:40 AM 11:45:42 AM 11:45:45 AM 11:45:47 AM 11:45:48 AM 11:45:51 AM 11:45:54 AM 11:45:55 AM 11:45:56 AM 11:45:59 AM 11:46:01 AM 11:46:04 AM 11:46:07 AM 11:46:09 AM 11:46:11 AM 11:46:14 AM 11:46:15 AM 11:46:18 AM 11:46:21 AM
118 118 117 117 117 117 117 117 117 117 116 116 115 115 115 115 115 115 115 115 113 111 110 110 110 111 112 112 112 111 110 109 108 107 108 109 110 111 112 113 113 114 114 115 116 116 116 116 116 116 116 117 117 117 117 117 118 118 117 117 117 118 119 119 120 119 119
117
117
117
117
117
116 115
113 111 110
113 111
111
111
111 112
111 110 109 108 107 108 109 110 111 112 113
109
109
111 110
111 110
112
112
110 109 108 107 108 109 110 111 112 113
110 109 108 107 108 109 110 111 112 113
116
116
113 111
109
114 115 116
117
118 117
117
117
117
118 119
119
119
120 119
119
119
117
11:46:24 AM 11:46:25 AM 11:46:28 AM 11:46:31 AM 11:46:33 AM 11:46:34 AM 11:46:37 AM 11:46:39 AM 11:46:42 AM 11:46:45 AM 11:46:48 AM 11:46:51 AM 11:46:54 AM 11:46:57 AM 11:46:59 AM 11:47:00 AM 11:47:02 AM 11:47:03 AM 11:47:06 AM 11:47:09 AM 11:47:12 AM 11:47:15 AM 11:47:18 AM 11:47:21 AM 11:47:24 AM 11:47:27 AM 11:47:30 AM 11:47:33 AM 11:47:36 AM 11:47:39 AM 11:47:42 AM 11:47:45 AM 11:47:46 AM 11:47:49 AM 11:47:52 AM 11:47:55 AM 11:47:57 AM 11:48:00 AM 11:48:03 AM 11:48:06 AM 11:48:09 AM 11:48:11 AM 11:48:12 AM 11:48:15 AM 11:48:18 AM 11:48:21 AM 11:48:23 AM 11:48:26 AM 11:48:29 AM 11:48:30 AM 11:48:33 AM 11:48:36 AM 11:48:39 AM 11:48:41 AM 11:48:44 AM 11:48:47 AM 11:48:49 AM 11:48:52 AM 11:48:55 AM 11:48:58 AM 11:49:01 AM 11:49:04 AM 11:49:07 AM 11:49:10 AM 11:49:13 AM 11:49:16 AM 11:49:19 AM
119 118 118 118 117 118 118 117 117 117 117 117 117 116 115 114 113 112 112 112 112 112 112 112 112 113 113 113 113 113 113 113 114 114 114 114 115 115 115 115 115 116 116 116 117 117 118 118 118 119 119 119 119 120 120 120 119 119 119 119 119 119 119 118 118 118 118
118
117 118
118
118
115 114 113 112
115 114 113 112
117
116 115 114 113 112
114
114
114
115
115
115
115
119
119
119
119
113
114
115
116
117 118
119
120
119
118
11:49:21 AM 11:49:24 AM 11:49:25 AM 11:49:28 AM 11:49:29 AM 11:49:32 AM 11:49:33 AM 11:49:36 AM 11:49:38 AM 11:49:41 AM 11:49:44 AM 11:49:47 AM 11:49:50 AM 11:49:53 AM 11:49:54 AM 11:49:57 AM 11:50:00 AM 11:50:03 AM 11:50:06 AM 11:50:07 AM 11:50:09 AM 11:50:11 AM 11:50:14 AM 11:50:17 AM 11:50:20 AM 11:50:21 AM 11:50:23 AM 11:50:26 AM 11:50:29 AM 11:50:30 AM 11:50:33 AM 11:50:36 AM 11:50:39 AM 11:50:42 AM 11:50:43 AM 11:50:44 AM 11:50:45 AM 11:50:46 AM 11:50:49 AM 11:50:52 AM 11:50:55 AM 11:50:56 AM 11:50:58 AM 11:50:59 AM 11:51:00 AM 11:51:01 AM 11:51:03 AM 11:51:06 AM 11:51:07 AM 11:51:09 AM 11:51:11 AM 11:51:14 AM 11:51:15 AM 11:51:18 AM 11:51:19 AM 11:51:20 AM 11:51:21 AM 11:51:22 AM 11:51:25 AM 11:51:28 AM 11:51:31 AM 11:51:34 AM 11:51:35 AM 11:51:36 AM 11:51:37 AM 11:51:40 AM 11:51:42 AM
117 118 118 118 116 116 115 115 116 117 117 118 119 119 118 119 119 119 118 117 116 115 115 115 115 114 113 112 112 112 112 112 111 110 109 110 109 107 107 107 105 106 105 103 102 100 99 100 101 102 101 101 102 102 102 102 101 102 103 103 103 101 100 99 98 98 99
117 118
116
118
118
116
116
115 116 117
117
117
118 119
119
119
119
119 119
118 119 119
119
118 117 116 115
117 116 115
117 116 115
114 113 112
113 112
113 112
111 110 109 110 109 107
110 109 110 109 107
110 109 110 109 107
106 105 103 102 100 99 100 101 102 101
106 105 103 102 100 99 100 101 102 101
102 103
102 103
100 99 98
100 99 98
105 106 105 103 102 100 99 100 101 102 101
107
107
107
105
103
119
107
105
103
100
100
103 102 100
100
100
100
102
103 102 100 100
102
101 102 103
101 100 99 98
101
99
99
98
101
98
98
98 99
11:51:44 AM 11:51:47 AM 11:51:50 AM 11:51:52 AM 11:51:53 AM 11:51:54 AM 11:51:56 AM 11:51:59 AM 11:52:02 AM 11:52:05 AM 11:52:08 AM 11:52:11 AM 11:52:12 AM 11:52:13 AM 11:52:16 AM 11:52:19 AM 11:52:20 AM 11:52:22 AM 11:52:23 AM 11:52:24 AM 11:52:27 AM 11:52:29 AM 11:52:32 AM 11:52:34 AM 11:52:36 AM 11:52:39 AM 11:52:42 AM 11:52:45 AM 11:52:46 AM 11:52:47 AM 11:52:48 AM 11:52:49 AM 11:52:51 AM 11:52:53 AM 11:52:56 AM 11:52:59 AM 11:53:00 AM 11:53:03 AM 11:53:06 AM 11:53:09 AM 11:53:10 AM 11:53:13 AM 11:53:15 AM 11:53:16 AM 11:53:18 AM 11:53:19 AM 11:53:21 AM 11:53:24 AM 11:53:27 AM 11:53:30 AM 11:53:33 AM 11:53:36 AM 11:53:39 AM 11:53:42 AM 11:53:45 AM 11:53:48 AM 11:53:51 AM 11:53:53 AM 11:53:54 AM 11:53:55 AM 11:53:57 AM 11:54:00 AM 11:54:03 AM 11:54:06 AM 11:54:09 AM 11:54:12 AM 11:54:15 AM
100 100 100 101 102 103 104 104 104 104 103 103 104 103 103 103 103 102 101 100 99 100 101 102 103 103 103 103 104 106 107 108 109 109 109 109 108 108 108 108 109 110 110 109 108 108 109 109 109 108 108 108 108 108 108 109 109 108 107 106 105 104 104 104 104 105 106
100
100
100
100
101 102 103 104 104
100
100
102 103 104
102 103 104
104
104
100
104
103 104 103
103
103
102 101 100 99 100 101 102 103
101 100 99 100 101 102 103
101 100 99 100 101 102 103
106 107 108 109
106 107 108 109
106
108
108
108
109 110
110
110
109 108
108
108
107 106 105 104
107 106 105 104
106
106
104 106 107 108 109
108
100
100
100
106
106
106
108
108
100
109
108
109 108 107 106 105 104
105 106
104
104
104
11:54:18 AM 11:54:21 AM 11:54:24 AM 11:54:25 AM 11:54:28 AM 11:54:31 AM 11:54:33 AM 11:54:36 AM 11:54:39 AM 11:54:41 AM 11:54:44 AM 11:54:47 AM 11:54:50 AM 11:54:53 AM 11:54:56 AM 11:54:59 AM 11:55:00 AM 11:55:02 AM 11:55:03 AM 11:55:04 AM 11:55:07 AM 11:55:10 AM 11:55:11 AM 11:55:14 AM 11:55:17 AM 11:55:20 AM 11:55:23 AM 11:55:25 AM 11:55:28 AM 11:55:31 AM 11:55:32 AM 11:55:35 AM 11:55:36 AM 11:55:38 AM 11:55:41 AM 11:55:43 AM 11:55:44 AM 11:55:45 AM 11:55:47 AM 11:55:50 AM 11:55:53 AM 11:55:55 AM 11:55:57 AM 11:55:59 AM 11:56:02 AM 11:56:05 AM 11:56:08 AM 11:56:11 AM 11:56:13 AM 11:56:16 AM 11:56:19 AM 11:56:22 AM 11:56:25 AM 11:56:28 AM 11:56:29 AM 11:56:32 AM 11:56:35 AM 11:56:36 AM 11:56:39 AM 11:56:40 AM 11:56:41 AM 11:56:44 AM 11:56:47 AM 11:56:50 AM 11:56:53 AM 11:56:56 AM 11:56:59 AM
106 106 106 106 106 106 107 106 105 104 104 104 104 104 104 103 102 101 100 101 100 100 100 100 100 100 100 101 101 102 102 102 103 102 101 100 99 98 97 97 97 96 95 94 94 94 94 93 93 93 93 94 94 94 95 95 95 95 95 95 96 96 96 95 95 95 95
107 106 105 104
103 102 101 100 101 100
102
102
106 105 104
106 105 104
102 101 100 101 100
102 101 100 101 100
102 101 100 99 98 97
102 101 100 99 98 97
98 97
95 94
95 94 94
96 95 94 94
102
101 102
103 102 101 100 99 98 97
98 97
98 97
98 97
96 95 94
96 95 94
95 94
95 94 94
94
93
93
93
94
94
94
95
95
95
96
96
96
95
95
95
11:57:02 AM 11:57:05 AM 11:57:08 AM 11:57:11 AM 11:57:14 AM 11:57:17 AM 11:57:19 AM 11:57:21 AM 11:57:24 AM 11:57:27 AM 11:57:30 AM 11:57:33 AM 11:57:34 AM 11:57:35 AM 11:57:36 AM 11:57:38 AM 11:57:41 AM 11:57:42 AM 11:57:44 AM 11:57:47 AM 11:57:50 AM 11:57:53 AM 11:57:56 AM 11:57:59 AM 11:58:00 AM 11:58:03 AM 11:58:06 AM 11:58:09 AM 11:58:12 AM 11:58:15 AM 11:58:18 AM 11:58:19 AM 11:58:21 AM 11:58:24 AM 11:58:27 AM 11:58:30 AM 11:58:33 AM 11:58:35 AM 11:58:38 AM 11:58:41 AM 11:58:44 AM 11:58:47 AM 11:58:48 AM 11:58:50 AM 11:58:59 AM 11:59:02 AM 11:59:04 AM 11:59:07 AM 11:59:08 AM 11:59:10 AM 11:59:13 AM 11:59:16 AM 11:59:19 AM 11:59:21 AM 11:59:24 AM 11:59:27 AM 11:59:29 AM 11:59:32 AM 11:59:34 AM 11:59:37 AM 11:59:40 AM 11:59:42 AM 11:59:43 AM 11:59:46 AM 11:59:49 AM 11:59:52 AM 11:59:55 AM
95 95 95 95 95 95 95 96 96 96 96 96 95 94 93 94 94 94 95 96 96 96 96 96 95 95 95 95 95 95 96 95 94 94 94 93 93 92 92 92 92 92 91 91 91 91 91 91 92 93 93 94 94 95 95 95 94 94 93 93 92 91 90 90 90 90 90
95
95
95
95
96
96
96
95 94 93 94
95 94 93 94
94 93 94
94 93 94
94 93 94
94 93 94
95 94 93 94
95 96
95 96
96
96
96
96
95 96
95
95
95
95
96 95 94
96 95 94
95 94
96 95 94
93
93
93
92
92
92
91
91
91
95
95 94
95
95 94
91
95 94
91
91
91
93
92 93
92 93
92 93
94
94
94
95
95
95
94
94
94
93
93
93
92 91 90
92 91 90
93
91 90
93
91 90
93
91 90
91 90
92 91 90
11:59:58 AM 12:00:01 PM 12:00:04 PM 12:00:07 PM 12:00:10 PM 12:00:13 PM 12:00:14 PM 12:00:15 PM 12:00:16 PM 12:00:17 PM 12:00:19 PM 12:00:20 PM 12:00:23 PM 12:00:26 PM 12:00:29 PM 12:00:30 PM 12:00:33 PM 12:00:36 PM 12:00:37 PM 12:00:38 PM 12:00:39 PM 12:00:42 PM 12:00:45 PM 12:00:48 PM 12:00:51 PM 12:00:54 PM 12:00:57 PM 12:01:00 PM 12:01:03 PM 12:01:06 PM 12:01:07 PM 12:01:10 PM 12:01:13 PM 12:01:16 PM 12:01:18 PM 12:01:21 PM 12:01:24 PM 12:01:27 PM 12:01:30 PM 12:01:33 PM 12:01:36 PM 12:01:39 PM 12:01:40 PM 12:01:43 PM 12:01:46 PM 12:01:48 PM 12:01:51 PM 12:01:54 PM 12:01:57 PM 12:02:00 PM 12:02:03 PM 12:02:04 PM 12:02:07 PM 12:02:10 PM 12:02:13 PM 12:02:16 PM 12:02:19 PM 12:02:20 PM 12:02:21 PM 12:02:24 PM 12:02:27 PM 12:02:30 PM 12:02:33 PM 12:02:36 PM 12:02:39 PM 12:02:42 PM 12:02:45 PM
90 90 90 90 90 90 91 92 92 93 78 77 77 77 77 78 78 79 80 81 82 82 82 82 82 82 82 82 82 82 81 81 81 81 80 80 80 81 83 83 83 84 85 85 85 91 92 92 92 93 93 94 94 94 94 94 94 94 93 93 93 93 93 93 93 93 93
90
90
90
90
91 92
91 92
92
92
92
92
91 92
93 78 77
93 78 77
78 77
78 77
78 77
78 77
93 78 77
78
78
79 80 81 82
79 80 81 82
78
80 81 82
80 81 82
82
80 81 82
82
80 81 82
79 80 81 82
82
82
81
81
81
80
80
80
81 83
81 83
83
83
83
83
81 83
84 85
84 85
85
85
85
85
84 85
91 92
91 92
92
92
92
92
91 92
93
93
93
93
94
94
94
93
93
93
93
93
12:02:46 PM 12:02:47 PM 12:02:49 PM 12:02:50 PM 12:02:52 PM 12:02:55 PM 12:02:56 PM 12:02:59 PM 12:03:01 PM 12:03:03 PM 12:03:05 PM 12:03:06 PM 12:03:07 PM 12:03:10 PM 12:03:11 PM 12:03:12 PM 12:03:13 PM
92 91 90 89 89 89 90 91 92 93 94 95 96 96 97 99 100
92 91 90 89
92 91 90 89
91 90 89
91 90 89
91 90 89
91 90 89
92 91 90 89
90 91 92 93 94 95 96
90 91 92 93 94 95 96
91 92 93 94 95 96
91 92 93 94 95 96
91 92 93 94 95 96
91 92 93 94 95 96
90 91 92 93 94 95 96
97 99 100
97 99 100
99 100
99 100
99 100
99 100
97 99 100
92
100
dp count 1806 799 140 92 158 70 450 498 204 StartSecond BPM remove same 1% BPM (course inference) 1% BPM (course inference) remove same 1% + beacon (remove same) Beacon 0.8% (fine inference) 0.8% + beacon 1% + beacon
APPENDIX D. MATLAB CODE AND TEST DATA D1: Aggregate.m: function mu = aggregate (M, S, W, alpha) %Penalty based aggregation function by using Huber loss function. % mu is the expected value for the aggreated average % M is the peer marked score in a 1Xn vector % S is the marker selection vector (1Xn) of binary values where % value `1 ' means selected and value `0' means not selected. % There should be m markers, that is, m `1's in S % W is the markers' reliability weight vector (1Xn), and this vector is % normalized % alpha value is required for caculating Huber loss function, alpha = 0.3 % The function implements argmin_y(sum w_i* Hub(|x_i - y|)) % For example, M = [0.6 0.6 0.6 0]; S = [1 1 1 1]; W=[0.25 0.25 0.25 0.25]; mu=0.5 [m dummy] = size(nonzeros(S)); [n dummy] = size(M'); % Shorten the lists of M and W (both of size 1Xn) to X and w (size 1Xm) %X = nonzeros(M.*S); % this is not correct when the mark is zero; %w = nonzeros(W.*S); % this is not correct when the weight is zero; X = zeros(1,m); w = zeros(1,m); i = 1; for iprime = 1:n if S(1,iprime) == 1 X(1,i) = M(1,iprime); w(1,i) = W(1,iprime); i = i+1; end end
% Numerical solution for y = 0:0.0001:1 Y = [0:0.0001:1]; for i = 1: size(Y') % we need to iterate through all possible y values sum(1,i) = 0; for iprime=1:m sum(1,i) = sum(1,i) + w(1,iprime)* Hub(X(1,iprime), Y(1,i), alpha); end; end; [sum_sorted,Ind] = sort(sum); % Obtain the minimal solution's index mu = Y(1, Ind(1,1)); % Obtain the y value which has minimal penalty end function p = Hub(x,y,alpha) if abs(x-y) < alpha p = 0.5 * (abs(x-y)^2); else p = alpha * (abs(x-y) - 0.5 * alpha); end; end
D2: FeaturesFromBuffer.m: function feat = featuresFromBuffer(at, fs) % featuresFromBuffer Extract vector of features from raw data buffer % % Copyright 2014-2015 The MathWorks, Inc. % Initialize digital filter
persistent fhp if(isempty(fhp)) fhp = hpfilter; fhp.PersistentMemory = false; end % Initialize feature vector feat = zeros(1,60); % Remove gravitational contributions with digital filter ab = filter(fhp,at); % Average value in signal buffer for all three acceleration components (1 each) feat(1:3) = mean(at,1); % RMS value in signal buffer for all three acceleration components (1 each) feat(4:6) = rms(ab,1); % Autocorrelation features for all three acceleration components (3 each): % height of main peak; height and position of second peak feat(7:15) = autocorrFeatures(ab, fs); % Spectral peak features (12 each): height and position of first 6 peaks feat(16:51) = spectralPeaksFeatures(ab, fs); % Spectral power features (5 each): total power in 5 adjacent % and pre-defined frequency bands feat(52:60) = spectralPowerFeatures(ab, fs); % --- Helper functions function feats = autocorrFeatures(x, fs) n_channels = size(x,2); feats = zeros(1,3*n_channels); [c,lags] =arrayfun(@(i) xcorr(x(:,i)),1:n_channels,'UniformOutput',false); minprom = 0.0005; mindist_xunits = 0.3; minpkdist = floor(mindist_xunits/(1/fs)); % Separate peak analysis for all channels for k = 1:n_channels [pks,locs] = findpeaks(c{k}Methodology of sapl,... 'minpeakprominence',minprom,... 'minpeakdistance',minpkdist); tc = (1/fs)*lags{k}; tcl = tc(locs); % Feature 1 - peak height at 0 if(~isempty(tcl)) % else f1 already 0 feats(n_channels*(k-1)+1) = pks((end+1)/2); end % Features 2 and 3 - position and height of first peak if(length(tcl) >= 2) % else f2,f3 already 0 feats(n_channels*(k-1)+2) = tcl(2); feats(n_channels*(k-1)+3) = pks(2); end end function feats = spectralPeaksFeatures(x, fs) n_channels = size(x,2); mindist_xunits = 0.3; feats = zeros(1,12*n_channels); N = 4096;
minpkdist = floor(mindist_xunits/(fs/N)); % Cycle through number of channels for k = 1:n_channels [p, f] = periodogram(x(:,k),rectwin(length(x)),4096,fs); [pks,locs] = findpeaks(p,'npeaks',20,'minpeakdistance',minpkdist); if(~isempty(pks)) mx = min(6,length(pks)); [spks, idx] = sort(pks,'descend'); slocs = locs(idx); pks = spks(1:mx); locs = slocs(1:mx); [slocs, idx] = sort(locs,'ascend'); spks = pks(idx); opks = spks; locs = slocs; end ofpk = f(locs); % Features 1-6 positions of highest 6 peaks feats(12*(k-1)+(1:length(opks))) = ofpk; % Features 7-12 power levels of highest 6 peaks feats(12*(k-1)+(7:7+length(opks)-1)) = opks; end function feats = spectralPowerFeatures(x, fs) n_channels = size(x,2); edges = [0.5, 1.5, 5, 10]; n_feats = length(edges)-1; feats = zeros(1,n_feats*n_channels); for k=1:n_channels [p, f] = periodogram(x(:,k),rectwin(length(x)),4096,fs); for kband = 1:n_feats feats(n_feats*(k-1)+kband) = sum(p( (f>=edges(kband)) & (f= 2) % else f2,f3 already 0 feats(n_channels*(k-1)+2) = tcl(2); feats(n_channels*(k-1)+3) = pks(2); end end === function feats = spectralPeaksFeatures(xpsd, f) n_channels = size(xpsd,2); mindist_xunits = 0.3; feats = zeros(1,12*n_channels);
minpkdist = floor(mindist_xunits/f(2)); % Cycle through number of channels nfinalpeaks = 6; for k = 1:n_channels [pks,locs] = findpeaks(xpsd(:,k),'npeaks',20,'minpeakdistance',minpkdist); opks = zeros(nfinalpeaks,1); if(~isempty(pks)) mx = min(6,length(pks)); [spks, idx] = sort(pks,'descend'); slocs = locs(idx); pkssel = spks(1:mx); locssel = slocs(1:mx); [olocs, idx] = sort(locssel,'ascend'); opks = pkssel(idx); end ofpk = f(olocs); % Features 1-6 positions of highest 6 peaks feats(12*(k-1)+(1:length(opks))) = ofpk; % Features 7-12 power levels of highest 6 peaks feats(12*(k-1)+(7:7+length(opks)-1)) = opks; end function feats = spectralPowerFeatures(xpsd, f) n_channels = size(xpsd,2); edges = [0.5, 1.5, 5, 10]; n_feats = length(edges)-1; featstmp = zeros(n_feats,n_channels); for kband = 1:length(edges)-1 featstmp(kband,:) = sum(xpsd( (f>=edges(kband)) & (f 58931 [ACK] Seq=1
95
Server: Protocol (SSH-2.0-
1006 60
Server: Key Exchange Init 22 > 58931 [ACK] Seq=994
262
Server: Diffie-Hellman Key
60
22 > 58931 [ACK] Seq=1202
98
Server: Encrypted packet
98
Server: [TCP Retransmission] ,
106
Server: Encrypted packet
60
22 > 58931 [ACK] Seq=1298
82
Server: Encrypted packet
60
22 > 58931 [ACK] Seq=1326
98
Server: Encrypted packet
60
22 > 58931 [ACK] Seq=1370
126
Server: Encrypted packet
242
Server: Encrypted packet
130
Server: Encrypted packet
178
Server: Encrypted packet
106
Server: Encrypted packet
122
Server: Encrypted packet
218
Server: Encrypted packet
130
Server: Encrypted packet
106
Server: Encrypted packet
60
22 > 58931 [ACK] Seq=2242
60
22 > 58931 [ACK] Seq=2242
60
22 > 58931 [ACK] Seq=2242
1514
Server: Encrypted packet
1514
Server: Encrypted packet
1514
Server: Encrypted packet
199 2.758004 192.168.1.8 (len=1460) 201 2.759167 192.168.1.8 (len=1460) 202 2.759713 192.168.1.8 (len=1460) 204 2.760206 192.168.1.8 (len=1460) 205 2.761428 192.168.1.8 (len=1460) 207 2.76193 192.168.1.8 (len=1460) 208 2.762576 192.168.1.8 (len=1460) 209 2.762577 192.168.1.8 Ack=7372 Win=34224 Len=0 211 2.762804 192.168.1.8 Ack=8528 Win=34224 Len=0 212 2.764502 192.168.1.8 Ack=9208 Win=34224 Len=0 213 2.764502 192.168.1.8 Ack=10364 Win=34224 Len=0 214 2.764934 192.168.1.8 (len=1460) 215 2.765307 192.168.1.8 (len=1460) 217 2.765807 192.168.1.8 (len=1460) 218 2.766516 192.168.1.8 (len=1460) 220 2.767051 192.168.1.8 (len=1460) 221 2.767767 192.168.1.8 (len=1460) 223 2.768248 192.168.1.8 (len=1460) 224 2.768875 192.168.1.8 (len=1460) 226 2.770598 192.168.1.8 (len=1460) 227 2.770599 192.168.1.8 (len=1460) 229 2.770839 192.168.1.8 (len=1460) 230 2.770839 192.168.1.8 (len=1460) 232 2.771255 192.168.1.8 (len=1460) 233 2.771799 192.168.1.8 (len=1460) 235 2.772487 192.168.1.8 (len=1460) 237 2.773128 192.168.1.8 (len=1460) 238 2.773606 192.168.1.8 (len=1460) 240 2.774331 192.168.1.8 (len=1460) 241 2.775093 192.168.1.8 (len=1460) 243 2.775589 192.168.1.8 (len=1460) 244 2.776292 192.168.1.8 (len=1460) 246 2.776786 192.168.1.8 (len=1460)
192.168.2.170
SSHv2
1514
Server: Encrypted packet
192.168.2.170
SSHv2
1514
Server: Encrypted packet
192.168.2.170
SSHv2
1514
Server: Encrypted packet
192.168.2.170
SSHv2
1514
Server: Encrypted packet
192.168.2.170
SSHv2
1514
Server: Encrypted packet
192.168.2.170
SSHv2
1514
Server: Encrypted packet
192.168.2.170
SSHv2
1514
Server: Encrypted packet
192.168.2.170
TCP
60
22 > 58931 [ACK] Seq=16842
192.168.2.170
TCP
60
22 > 58931 [ACK] Seq=16842
192.168.2.170
TCP
60
22 > 58931 [ACK] Seq=16842
192.168.2.170
TCP
60
22 > 58931 [ACK] Seq=16842
192.168.2.170
SSHv2
1514
Server: Encrypted packet
192.168.2.170
SSHv2
1514
Server: Encrypted packet
192.168.2.170
SSHv2
1514
Server: Encrypted packet
192.168.2.170
SSHv2
1514
Server: Encrypted packet
192.168.2.170
SSHv2
1514
Server: Encrypted packet
192.168.2.170
SSHv2
1514
Server: Encrypted packet
192.168.2.170
SSHv2
1514
Server: Encrypted packet
192.168.2.170
SSHv2
1514
Server: Encrypted packet
192.168.2.170
SSHv2
1514
Server: Encrypted packet
192.168.2.170
SSHv2
1514
Server: Encrypted packet
192.168.2.170
SSHv2
1514
Server: Encrypted packet
192.168.2.170
SSHv2
1514
Server: Encrypted packet
192.168.2.170
SSHv2
1514
Server: Encrypted packet
192.168.2.170
SSHv2
1514
Server: Encrypted packet
192.168.2.170
SSHv2
1514
Server: Encrypted packet
192.168.2.170
SSHv2
1514
Server: Encrypted packet
192.168.2.170
SSHv2
1514
Server: Encrypted packet
192.168.2.170
SSHv2
1514
Server: Encrypted packet
192.168.2.170
SSHv2
1514
Server: Encrypted packet
192.168.2.170
SSHv2
1514
Server: Encrypted packet
192.168.2.170
SSHv2
1514
Server: Encrypted packet
192.168.2.170
SSHv2
1514
Server: Encrypted packet
247 2.77756 192.168.1.8 (len=1460) 249 2.778453 192.168.1.8 (len=1132) 250 2.779256 192.168.1.8 (len=1460) 252 2.780075 192.168.1.8 (len=1460) 253 2.780837 192.168.1.8 (len=1460) 255 2.781375 192.168.1.8 (len=1460) 256 2.782 192.168.1.8 (len=1460) 258 2.7825 192.168.1.8 (len=1460) 259 2.783215 192.168.1.8 (len=1460) 261 2.784455 192.168.1.8 (len=1460) 262 2.785915 192.168.1.8 (len=1460) 264 2.787137 192.168.1.8 (len=1460) 265 2.787591 192.168.1.8 (len=1460) 267 2.788092 192.168.1.8 (len=1460) 268 2.788347 192.168.1.8 (len=1460) 270 2.789015 192.168.1.8 (len=1460) 271 2.789674 192.168.1.8 (len=1460) 273 2.790159 192.168.1.8 (len=1460) 274 2.790766 192.168.1.8 (len=1460) 276 2.791261 192.168.1.8 (len=1460) 277 2.791997 192.168.1.8 (len=1460) 279 2.792397 192.168.1.8 (len=1460) 280 2.793206 192.168.1.8 (len=1460) 282 2.794484 192.168.1.8 (len=1460) 283 2.796803 192.168.1.8 (len=1460) 285 2.797424 192.168.1.8 (len=1460) 287 2.798197 192.168.1.8 (len=1460) 288 2.799108 192.168.1.8 (len=1460) 290 2.799713 192.168.1.8 (len=1460) 291 2.800397 192.168.1.8 (len=1460) 293 2.800889 192.168.1.8 (len=1460) 294 2.801551 192.168.1.8 (len=1460) 296 2.802076 192.168.1.8 (len=1460)
192.168.2.170
SSHv2
1514
Server: Encrypted packet
192.168.2.170
SSHv2
1186
Server: Encrypted packet
192.168.2.170
SSHv2
1514
Server: Encrypted packet
192.168.2.170
SSHv2
1514
Server: Encrypted packet
192.168.2.170
SSHv2
1514
Server: Encrypted packet
192.168.2.170
SSHv2
1514
Server: Encrypted packet
192.168.2.170
SSHv2
1514
Server: Encrypted packet
192.168.2.170
SSHv2
1514
Server: Encrypted packet
192.168.2.170
SSHv2
1514
Server: Encrypted packet
192.168.2.170
SSHv2
1514
Server: Encrypted packet
192.168.2.170
SSHv2
1514
Server: Encrypted packet
192.168.2.170
SSHv2
1514
Server: Encrypted packet
192.168.2.170
SSHv2
1514
Server: Encrypted packet
192.168.2.170
SSHv2
1514
Server: Encrypted packet
192.168.2.170
SSHv2
1514
Server: Encrypted packet
192.168.2.170
SSHv2
1514
Server: Encrypted packet
192.168.2.170
SSHv2
1514
Server: Encrypted packet
192.168.2.170
SSHv2
1514
Server: Encrypted packet
192.168.2.170
SSHv2
1514
Server: Encrypted packet
192.168.2.170
SSHv2
1514
Server: Encrypted packet
192.168.2.170
SSHv2
1514
Server: Encrypted packet
192.168.2.170
SSHv2
1514
Server: Encrypted packet
192.168.2.170
SSHv2
1514
Server: Encrypted packet
192.168.2.170
SSHv2
1514
Server: Encrypted packet
192.168.2.170
SSHv2
1514
Server: Encrypted packet
192.168.2.170
SSHv2
1514
Server: Encrypted packet
192.168.2.170
SSHv2
1514
Server: Encrypted packet
192.168.2.170
SSHv2
1514
Server: Encrypted packet
192.168.2.170
SSHv2
1514
Server: Encrypted packet
192.168.2.170
SSHv2
1514
Server: Encrypted packet
192.168.2.170
SSHv2
1514
Server: Encrypted packet
192.168.2.170
SSHv2
1514
Server: Encrypted packet
192.168.2.170
SSHv2
1514
Server: Encrypted packet
297 2.802724 192.168.1.8 (len=1460) 299 2.803214 192.168.1.8 (len=1460) 300 2.803893 192.168.1.8 (len=1460) 302 2.804841 192.168.1.8 (len=1460) 303 2.805484 192.168.1.8 (len=1460) 305 2.806027 192.168.1.8 (len=1460) 306 2.806749 192.168.1.8 (len=1460) 308 2.807225 192.168.1.8 (len=1460) 309 2.808192 192.168.1.8 (len=1460) 311 2.813178 192.168.1.8 (len=1460) 312 2.813904 192.168.1.8 (len=1460) 314 2.814325 192.168.1.8 (len=1460) 315 2.815059 192.168.1.8 (len=1460) 317 2.815489 192.168.1.8 (len=1460) 318 2.815902 192.168.1.8 (len=1460) 321 2.816625 192.168.1.8 (len=1460) 322 2.822311 192.168.1.8 (len=1460) 324 2.822911 192.168.1.8 (len=1460) 325 2.823456 192.168.1.8 (len=1460) 327 2.823908 192.168.1.8 (len=1460) 328 2.824217 192.168.1.8 (len=1460) 330 2.827909 192.168.1.8 (len=1412) 332 2.83559 192.168.1.8 (len=68) 333 2.835803 192.168.1.8 (len=68) 336 2.850276 192.168.1.8 (len=68) 342 3.548984 192.168.1.8 Ack=1784 Win=34224 Len=0 1 0 192.168.2.1 239.255.255.250 3 0.349152 192.168.2.1 4 0.349547 192.168.2.1 5 0.349547 192.168.2.1 6 0.349549 192.168.2.1 7 0.34955 192.168.2.1 8 0.34955 192.168.2.1 9 0.549672 192.168.2.1 10 0.550067 192.168.2.1 11 0.550068 192.168.2.1 12 0.550069 192.168.2.1 13 0.55007 192.168.2.1 14 0.550071 192.168.2.1 344 3.553179 192.168.2.1
192.168.2.170
SSHv2
1514
Server: Encrypted packet
192.168.2.170
SSHv2
1514
Server: Encrypted packet
192.168.2.170
SSHv2
1514
Server: Encrypted packet
192.168.2.170
SSHv2
1514
Server: Encrypted packet
192.168.2.170
SSHv2
1514
Server: Encrypted packet
192.168.2.170
SSHv2
1514
Server: Encrypted packet
192.168.2.170
SSHv2
1514
Server: Encrypted packet
192.168.2.170
SSHv2
1514
Server: Encrypted packet
192.168.2.170
SSHv2
1514
Server: Encrypted packet
192.168.2.170
SSHv2
1514
Server: Encrypted packet
192.168.2.170
SSHv2
1514
Server: Encrypted packet
192.168.2.170
SSHv2
1514
Server: Encrypted packet
192.168.2.170
SSHv2
1514
Server: Encrypted packet
192.168.2.170
SSHv2
1514
Server: Encrypted packet
192.168.2.170
SSHv2
1514
Server: Encrypted packet
192.168.2.170
SSHv2
1514
Server: Encrypted packet
192.168.2.170
SSHv2
1514
Server: Encrypted packet
192.168.2.170
SSHv2
1514
Server: Encrypted packet
192.168.2.170
SSHv2
1514
Server: Encrypted packet
192.168.2.170
SSHv2
1514
Server: Encrypted packet
192.168.2.170
SSHv2
1514
Server: Encrypted packet
192.168.2.170
SSHv2
1466
Server: Encrypted packet
192.168.2.170
SSHv2
122
Server: Encrypted packet
192.168.2.170
SSHv2
122
Server: Encrypted packet
192.168.2.170
SSHv2
122
Server: Encrypted packet
192.168.2.170
TCP
60
22 > 58931 [ACK] Seq=1370
239.255.255.250
IGMPv2 60
Membership Report group
239.255.255.250 239.255.255.250 239.255.255.250 239.255.255.250 239.255.255.250 239.255.255.250 239.255.255.250 239.255.255.250 239.255.255.250 239.255.255.250 239.255.255.250 239.255.255.250 239.255.255.250
SSDP SSDP SSDP SSDP SSDP SSDP SSDP SSDP SSDP SSDP SSDP SSDP SSDP
NOTIFY * HTTP/1.1 NOTIFY * HTTP/1.1 NOTIFY * HTTP/1.1 NOTIFY * HTTP/1.1 NOTIFY * HTTP/1.1 NOTIFY * HTTP/1.1 NOTIFY * HTTP/1.1 NOTIFY * HTTP/1.1 NOTIFY * HTTP/1.1 NOTIFY * HTTP/1.1 NOTIFY * HTTP/1.1 NOTIFY * HTTP/1.1 NOTIFY * HTTP/1.1
340 331 383 395 397 411 340 331 383 395 397 411 340
345 3.553551 192.168.2.1 239.255.255.250 346 3.553552 192.168.2.1 239.255.255.250 347 3.553553 192.168.2.1 239.255.255.250 348 3.553554 192.168.2.1 239.255.255.250 349 3.553557 192.168.2.1 239.255.255.250 350 3.708384 192.168.2.1 239.255.255.250 351 3.708727 192.168.2.1 239.255.255.250 352 3.708729 192.168.2.1 239.255.255.250 353 3.708729 192.168.2.1 239.255.255.250 354 3.70873 192.168.2.1 239.255.255.250 355 3.709152 192.168.2.1 239.255.255.250 356 3.709153 192.168.2.1 239.255.255.250 357 3.709154 192.168.2.1 239.255.255.250 358 3.709155 192.168.2.1 239.255.255.250 359 3.709155 192.168.2.1 239.255.255.250 360 3.709158 192.168.2.1 239.255.255.250 361 3.753698 192.168.2.1 239.255.255.250 362 3.754047 192.168.2.1 239.255.255.250 363 3.754048 192.168.2.1 239.255.255.250 364 3.754049 192.168.2.1 239.255.255.250 365 3.75405 192.168.2.1 239.255.255.250 366 3.754051 192.168.2.1 239.255.255.250 367 3.959921 192.168.2.1 239.255.255.250 368 3.959922 192.168.2.1 239.255.255.250 369 3.959922 192.168.2.1 239.255.255.250 370 3.96025 192.168.2.1 239.255.255.250 371 3.960252 192.168.2.1 239.255.255.250 372 3.960252 192.168.2.1 239.255.255.250 373 3.960252 192.168.2.1 239.255.255.250 374 3.960252 192.168.2.1 239.255.255.250 375 3.960253 192.168.2.1 239.255.255.250 376 3.960253 192.168.2.1 239.255.255.250 377 3.960519 192.168.2.1 239.255.255.250 17 1.727803 192.168.2.170 192.168.1.8 Win=65535 Len=0 MSS=1460 SACK_PERM=1 19 1.802528 192.168.2.170 192.168.1.8 Ack=1 Win=65535 Len=0 20 1.802886 192.168.2.170 192.168.1.8 PuTTY_Local:_Mar_16_2016_11:17:04) 23 1.857412 192.168.2.170 192.168.1.8 25 1.871661 192.168.2.170 192.168.1.8 Exchange Init 31 1.964878 192.168.2.170 192.168.1.8 Ack=1202 Win=65535 Len=0 33 2.181801 192.168.2.170 192.168.1.8 34 2.181976 192.168.2.170 192.168.1.8 (len=44) 40 2.426595 192.168.2.170 192.168.1.8 Ack=1246 Win=65535 Len=0 SLE=1202 SRE=1246 41 2.426754 192.168.2.170 192.168.1.8 (len=60) 43 2.456495 192.168.2.170 192.168.1.8 (len=288) 47 2.651499 192.168.2.170 192.168.1.8 (len=52) 50 2.703065 192.168.2.170 192.168.1.8 (len=76) 51 2.703111 192.168.2.170 192.168.1.8 (len=52) 54 2.71194 192.168.2.170 192.168.1.8 (len=44) 56 2.721895 192.168.2.170 192.168.1.8 (len=52) 58 2.724076 192.168.2.170 192.168.1.8 (len=84) 60 2.729561 192.168.2.170 192.168.1.8 (len=84)
SSDP SSDP SSDP SSDP SSDP SSDP SSDP SSDP SSDP SSDP SSDP SSDP SSDP SSDP SSDP SSDP SSDP SSDP SSDP SSDP SSDP SSDP SSDP SSDP SSDP SSDP SSDP SSDP SSDP SSDP SSDP SSDP SSDP TCP
331 383 395 397 411 424 496 433 492 433 472 433 504 486 488 488 340 331 383 395 397 411 488 488 486 504 433 472 433 492 433 496 424 62
NOTIFY * HTTP/1.1 NOTIFY * HTTP/1.1 NOTIFY * HTTP/1.1 NOTIFY * HTTP/1.1 NOTIFY * HTTP/1.1 NOTIFY * HTTP/1.1 NOTIFY * HTTP/1.1 NOTIFY * HTTP/1.1 NOTIFY * HTTP/1.1 NOTIFY * HTTP/1.1 NOTIFY * HTTP/1.1 NOTIFY * HTTP/1.1 NOTIFY * HTTP/1.1 NOTIFY * HTTP/1.1 NOTIFY * HTTP/1.1 NOTIFY * HTTP/1.1 NOTIFY * HTTP/1.1 NOTIFY * HTTP/1.1 NOTIFY * HTTP/1.1 NOTIFY * HTTP/1.1 NOTIFY * HTTP/1.1 NOTIFY * HTTP/1.1 NOTIFY * HTTP/1.1 NOTIFY * HTTP/1.1 NOTIFY * HTTP/1.1 NOTIFY * HTTP/1.1 NOTIFY * HTTP/1.1 NOTIFY * HTTP/1.1 NOTIFY * HTTP/1.1 NOTIFY * HTTP/1.1 NOTIFY * HTTP/1.1 NOTIFY * HTTP/1.1 NOTIFY * HTTP/1.1 58931 > 22 [SYN] Seq=0
TCP
54
58931 > 22 [ACK] Seq=1
SSHv2
97
Client: Protocol (SSH-2.0-
SSHv2 SSHv2
1158 102
Client: Key Exchange Init Client: Diffie-Hellman Key
TCP
54
58931 > 22 [ACK] Seq=1196
SSHv2 SSHv2
70 98
Client: New Keys Client: Encrypted packet
TCP
66
58931 > 22 [ACK] Seq=1256
SSHv2
114
Client: Encrypted packet
SSHv2
342
Client: Encrypted packet
SSHv2
106
Client: Encrypted packet
SSHv2
130
Client: Encrypted packet
SSHv2
106
Client: Encrypted packet
SSHv2
98
Client: Encrypted packet
SSHv2
106
Client: Encrypted packet
SSHv2
138
Client: Encrypted packet
SSHv2
138
Client: Encrypted packet
62 2.731225 192.168.2.170 (len=52) 64 2.733479 192.168.2.170 (len=100) 66 2.736777 192.168.2.170 (len=100) 68 2.739654 192.168.2.170 (len=108) 70 2.741596 192.168.2.170 (len=68) 71 2.741663 192.168.2.170 (len=68) 72 2.741693 192.168.2.170 (len=68) 73 2.741729 192.168.2.170 (len=68) 74 2.741786 192.168.2.170 (len=68) 75 2.741863 192.168.2.170 (len=68) 76 2.741946 192.168.2.170 (len=68) 77 2.741991 192.168.2.170 (len=68) 78 2.742053 192.168.2.170 (len=68) 79 2.742086 192.168.2.170 (len=68) 80 2.742109 192.168.2.170 (len=68) 81 2.742129 192.168.2.170 (len=68) 82 2.742167 192.168.2.170 (len=68) 83 2.742198 192.168.2.170 (len=68) 84 2.742234 192.168.2.170 (len=68) 85 2.742269 192.168.2.170 (len=68) 86 2.742305 192.168.2.170 (len=68) 87 2.742335 192.168.2.170 (len=68) 88 2.742371 192.168.2.170 (len=68) 89 2.742419 192.168.2.170 (len=68) 90 2.74247 192.168.2.170 (len=68) 91 2.742489 192.168.2.170 (len=68) 92 2.742541 192.168.2.170 (len=68) 93 2.742561 192.168.2.170 (len=68) 94 2.742592 192.168.2.170 (len=68) 95 2.742612 192.168.2.170 (len=68) 96 2.742645 192.168.2.170 (len=68) 97 2.742677 192.168.2.170 (len=68) 98 2.742698 192.168.2.170 (len=68)
192.168.1.8
SSHv2
106
Client: Encrypted packet
192.168.1.8
SSHv2
154
Client: Encrypted packet
192.168.1.8
SSHv2
154
Client: Encrypted packet
192.168.1.8
SSHv2
162
Client: Encrypted packet
192.168.1.8
SSHv2
122
Client: Encrypted packet
192.168.1.8
SSHv2
122
Client: Encrypted packet
192.168.1.8
SSHv2
122
Client: Encrypted packet
192.168.1.8
SSHv2
122
Client: Encrypted packet
192.168.1.8
SSHv2
122
Client: Encrypted packet
192.168.1.8
SSHv2
122
Client: Encrypted packet
192.168.1.8
SSHv2
122
Client: Encrypted packet
192.168.1.8
SSHv2
122
Client: Encrypted packet
192.168.1.8
SSHv2
122
Client: Encrypted packet
192.168.1.8
SSHv2
122
Client: Encrypted packet
192.168.1.8
SSHv2
122
Client: Encrypted packet
192.168.1.8
SSHv2
122
Client: Encrypted packet
192.168.1.8
SSHv2
122
Client: Encrypted packet
192.168.1.8
SSHv2
122
Client: Encrypted packet
192.168.1.8
SSHv2
122
Client: Encrypted packet
192.168.1.8
SSHv2
122
Client: Encrypted packet
192.168.1.8
SSHv2
122
Client: Encrypted packet
192.168.1.8
SSHv2
122
Client: Encrypted packet
192.168.1.8
SSHv2
122
Client: Encrypted packet
192.168.1.8
SSHv2
122
Client: Encrypted packet
192.168.1.8
SSHv2
122
Client: Encrypted packet
192.168.1.8
SSHv2
122
Client: Encrypted packet
192.168.1.8
SSHv2
122
Client: Encrypted packet
192.168.1.8
SSHv2
122
Client: Encrypted packet
192.168.1.8
SSHv2
122
Client: Encrypted packet
192.168.1.8
SSHv2
122
Client: Encrypted packet
192.168.1.8
SSHv2
122
Client: Encrypted packet
192.168.1.8
SSHv2
122
Client: Encrypted packet
192.168.1.8
SSHv2
122
Client: Encrypted packet
99 (len=68) 100 (len=68) 101 (len=68) 102 (len=68) 103 (len=68) 104 (len=68) 105 (len=68) 106 (len=68) 107 (len=68) 108 (len=68) 109 (len=68) 110 (len=68) 111 (len=68) 112 (len=68) 113 (len=68) 114 (len=68) 115 (len=68) 116 (len=68) 117 (len=68) 118 (len=68) 119 (len=68) 120 (len=68) 121 (len=68) 122 (len=68) 123 (len=68) 124 (len=68) 125 (len=68) 126 (len=68) 127 (len=68) 128 (len=68) 129 (len=68) 130 (len=68) 131 (len=68)
2.742717 192.168.2.170
192.168.1.8
SSHv2
122
Client: Encrypted packet
2.742762 192.168.2.170
192.168.1.8
SSHv2
122
Client: Encrypted packet
2.742782 192.168.2.170
192.168.1.8
SSHv2
122
Client: Encrypted packet
2.742801 192.168.2.170
192.168.1.8
SSHv2
122
Client: Encrypted packet
2.742834 192.168.2.170
192.168.1.8
SSHv2
122
Client: Encrypted packet
2.742884 192.168.2.170
192.168.1.8
SSHv2
122
Client: Encrypted packet
2.742904 192.168.2.170
192.168.1.8
SSHv2
122
Client: Encrypted packet
2.742922 192.168.2.170
192.168.1.8
SSHv2
122
Client: Encrypted packet
2.742952 192.168.2.170
192.168.1.8
SSHv2
122
Client: Encrypted packet
2.742972 192.168.2.170
192.168.1.8
SSHv2
122
Client: Encrypted packet
2.742989 192.168.2.170
192.168.1.8
SSHv2
122
Client: Encrypted packet
2.74301 192.168.2.170
192.168.1.8
SSHv2
122
Client: Encrypted packet
2.743041 192.168.2.170
192.168.1.8
SSHv2
122
Client: Encrypted packet
2.743071 192.168.2.170
192.168.1.8
SSHv2
122
Client: Encrypted packet
2.74309 192.168.2.170
192.168.1.8
SSHv2
122
Client: Encrypted packet
2.743108 192.168.2.170
192.168.1.8
SSHv2
122
Client: Encrypted packet
2.743128 192.168.2.170
192.168.1.8
SSHv2
122
Client: Encrypted packet
2.743148 192.168.2.170
192.168.1.8
SSHv2
122
Client: Encrypted packet
2.743168 192.168.2.170
192.168.1.8
SSHv2
122
Client: Encrypted packet
2.743185 192.168.2.170
192.168.1.8
SSHv2
122
Client: Encrypted packet
2.743233 192.168.2.170
192.168.1.8
SSHv2
122
Client: Encrypted packet
2.743256 192.168.2.170
192.168.1.8
SSHv2
122
Client: Encrypted packet
2.743286 192.168.2.170
192.168.1.8
SSHv2
122
Client: Encrypted packet
2.74332 192.168.2.170
192.168.1.8
SSHv2
122
Client: Encrypted packet
2.74334 192.168.2.170
192.168.1.8
SSHv2
122
Client: Encrypted packet
2.743377 192.168.2.170
192.168.1.8
SSHv2
122
Client: Encrypted packet
2.743412 192.168.2.170
192.168.1.8
SSHv2
122
Client: Encrypted packet
2.743444 192.168.2.170
192.168.1.8
SSHv2
122
Client: Encrypted packet
2.743475 192.168.2.170
192.168.1.8
SSHv2
122
Client: Encrypted packet
2.743496 192.168.2.170
192.168.1.8
SSHv2
122
Client: Encrypted packet
2.743514 192.168.2.170
192.168.1.8
SSHv2
122
Client: Encrypted packet
2.743535 192.168.2.170
192.168.1.8
SSHv2
122
Client: Encrypted packet
2.743568 192.168.2.170
192.168.1.8
SSHv2
122
Client: Encrypted packet
132 (len=68) 133 (len=68) 134 (len=68) 135 (len=68) 136 (len=68) 137 (len=68) 138 (len=68) 139 (len=68) 140 (len=68) 141 (len=68) 142 (len=68) 143 (len=68) 144 (len=68) 145 (len=68) 146 (len=68) 147 (len=68) 148 (len=68) 149 (len=68) 150 (len=68) 151 (len=68) 152 (len=68) 153 (len=68) 154 (len=68) 155 (len=68) 156 (len=68) 157 (len=68) 158 (len=68) 159 (len=68) 160 (len=68) 161 (len=68) 162 (len=68) 163 (len=68) 164 (len=68)
2.7436
192.168.2.170
192.168.1.8
SSHv2
122
Client: Encrypted packet
2.743646 192.168.2.170
192.168.1.8
SSHv2
122
Client: Encrypted packet
2.743679 192.168.2.170
192.168.1.8
SSHv2
122
Client: Encrypted packet
2.743712 192.168.2.170
192.168.1.8
SSHv2
122
Client: Encrypted packet
2.743729 192.168.2.170
192.168.1.8
SSHv2
122
Client: Encrypted packet
2.743748 192.168.2.170
192.168.1.8
SSHv2
122
Client: Encrypted packet
2.74377 192.168.2.170
192.168.1.8
SSHv2
122
Client: Encrypted packet
2.743791 192.168.2.170
192.168.1.8
SSHv2
122
Client: Encrypted packet
2.74381 192.168.2.170
192.168.1.8
SSHv2
122
Client: Encrypted packet
2.74383 192.168.2.170
192.168.1.8
SSHv2
122
Client: Encrypted packet
2.743849 192.168.2.170
192.168.1.8
SSHv2
122
Client: Encrypted packet
2.743867 192.168.2.170
192.168.1.8
SSHv2
122
Client: Encrypted packet
2.743886 192.168.2.170
192.168.1.8
SSHv2
122
Client: Encrypted packet
2.743902 192.168.2.170
192.168.1.8
SSHv2
122
Client: Encrypted packet
2.743921 192.168.2.170
192.168.1.8
SSHv2
122
Client: Encrypted packet
2.743941 192.168.2.170
192.168.1.8
SSHv2
122
Client: Encrypted packet
2.74396 192.168.2.170
192.168.1.8
SSHv2
122
Client: Encrypted packet
2.743979 192.168.2.170
192.168.1.8
SSHv2
122
Client: Encrypted packet
2.743999 192.168.2.170
192.168.1.8
SSHv2
122
Client: Encrypted packet
2.744018 192.168.2.170
192.168.1.8
SSHv2
122
Client: Encrypted packet
2.744036 192.168.2.170
192.168.1.8
SSHv2
122
Client: Encrypted packet
2.74417 192.168.2.170
192.168.1.8
SSHv2
122
Client: Encrypted packet
2.74419 192.168.2.170
192.168.1.8
SSHv2
122
Client: Encrypted packet
2.744211 192.168.2.170
192.168.1.8
SSHv2
122
Client: Encrypted packet
2.74423 192.168.2.170
192.168.1.8
SSHv2
122
Client: Encrypted packet
2.74425 192.168.2.170
192.168.1.8
SSHv2
122
Client: Encrypted packet
2.744297 192.168.2.170
192.168.1.8
SSHv2
122
Client: Encrypted packet
2.744316 192.168.2.170
192.168.1.8
SSHv2
122
Client: Encrypted packet
2.744336 192.168.2.170
192.168.1.8
SSHv2
122
Client: Encrypted packet
2.744356 192.168.2.170
192.168.1.8
SSHv2
122
Client: Encrypted packet
2.744374 192.168.2.170
192.168.1.8
SSHv2
122
Client: Encrypted packet
2.744391 192.168.2.170
192.168.1.8
SSHv2
122
Client: Encrypted packet
2.744411 192.168.2.170
192.168.1.8
SSHv2
122
Client: Encrypted packet
165 2.744429 192.168.2.170 (len=68) 166 2.744449 192.168.2.170 (len=68) 167 2.744467 192.168.2.170 (len=68) 168 2.744486 192.168.2.170 (len=68) 169 2.744505 192.168.2.170 (len=68) 170 2.744524 192.168.2.170 (len=68) 171 2.744544 192.168.2.170 (len=68) 172 2.744561 192.168.2.170 (len=68) 173 2.74458 192.168.2.170 (len=68) 174 2.7446 192.168.2.170 (len=68) 175 2.744647 192.168.2.170 (len=68) 176 2.744665 192.168.2.170 (len=68) 177 2.744684 192.168.2.170 (len=68) 178 2.744703 192.168.2.170 (len=68) 179 2.744722 192.168.2.170 (len=68) 180 2.744741 192.168.2.170 (len=68) 181 2.744758 192.168.2.170 (len=68) 182 2.744777 192.168.2.170 (len=68) 183 2.744796 192.168.2.170 (len=68) 184 2.744842 192.168.2.170 (len=68) 185 2.744861 192.168.2.170 (len=68) 186 2.744879 192.168.2.170 (len=68) 187 2.744898 192.168.2.170 (len=68) 188 2.744917 192.168.2.170 (len=68) 189 2.744938 192.168.2.170 (len=68) 190 2.744956 192.168.2.170 (len=68) 193 2.754154 192.168.2.170 (len=476) 197 2.756419 192.168.2.170 Ack=5162 Win=65535 Len=0 200 2.758018 192.168.2.170 Ack=8082 Win=65535 Len=0 203 2.759725 192.168.2.170 Ack=11002 Win=65535 Len=0 206 2.761446 192.168.2.170 Ack=13922 Win=65535 Len=0 210 2.762601 192.168.2.170 Ack=16842 Win=65535 Len=0 216 2.765339 192.168.2.170 Ack=19762 Win=65535 Len=0
192.168.1.8
SSHv2
122
Client: Encrypted packet
192.168.1.8
SSHv2
122
Client: Encrypted packet
192.168.1.8
SSHv2
122
Client: Encrypted packet
192.168.1.8
SSHv2
122
Client: Encrypted packet
192.168.1.8
SSHv2
122
Client: Encrypted packet
192.168.1.8
SSHv2
122
Client: Encrypted packet
192.168.1.8
SSHv2
122
Client: Encrypted packet
192.168.1.8
SSHv2
122
Client: Encrypted packet
192.168.1.8
SSHv2
122
Client: Encrypted packet
192.168.1.8
SSHv2
122
Client: Encrypted packet
192.168.1.8
SSHv2
122
Client: Encrypted packet
192.168.1.8
SSHv2
122
Client: Encrypted packet
192.168.1.8
SSHv2
122
Client: Encrypted packet
192.168.1.8
SSHv2
122
Client: Encrypted packet
192.168.1.8
SSHv2
122
Client: Encrypted packet
192.168.1.8
SSHv2
122
Client: Encrypted packet
192.168.1.8
SSHv2
122
Client: Encrypted packet
192.168.1.8
SSHv2
122
Client: Encrypted packet
192.168.1.8
SSHv2
122
Client: Encrypted packet
192.168.1.8
SSHv2
122
Client: Encrypted packet
192.168.1.8
SSHv2
122
Client: Encrypted packet
192.168.1.8
SSHv2
122
Client: Encrypted packet
192.168.1.8
SSHv2
122
Client: Encrypted packet
192.168.1.8
SSHv2
122
Client: Encrypted packet
192.168.1.8
SSHv2
122
Client: Encrypted packet
192.168.1.8
SSHv2
122
Client: Encrypted packet
192.168.1.8
SSHv2
530
Client: Encrypted packet
192.168.1.8
TCP
54
58931 > 22 [ACK] Seq=11112
192.168.1.8
TCP
54
58931 > 22 [ACK] Seq=11112
192.168.1.8
TCP
54
58931 > 22 [ACK] Seq=11112
192.168.1.8
TCP
54
58931 > 22 [ACK] Seq=11112
192.168.1.8
TCP
54
58931 > 22 [ACK] Seq=11112
192.168.1.8
TCP
54
58931 > 22 [ACK] Seq=11112
219 2.766527 192.168.2.170 Ack=22682 Win=65535 Len=0 222 2.767778 192.168.2.170 Ack=25602 Win=65535 Len=0 225 2.768887 192.168.2.170 Ack=28522 Win=65535 Len=0 228 2.770634 192.168.2.170 Ack=31442 Win=65535 Len=0 231 2.770854 192.168.2.170 Ack=34362 Win=65535 Len=0 234 2.77181 192.168.2.170 Ack=37282 Win=65535 Len=0 236 2.772872 192.168.2.170 (len=68) 239 2.773617 192.168.2.170 Ack=41662 Win=65535 Len=0 242 2.775104 192.168.2.170 Ack=44582 Win=65535 Len=0 245 2.776302 192.168.2.170 Ack=47502 Win=65535 Len=0 248 2.77757 192.168.2.170 Ack=50422 Win=65535 Len=0 251 2.77927 192.168.2.170 Ack=53014 Win=65535 Len=0 254 2.780853 192.168.2.170 Ack=55934 Win=65535 Len=0 257 2.782015 192.168.2.170 Ack=58854 Win=65535 Len=0 260 2.783226 192.168.2.170 Ack=61774 Win=65535 Len=0 263 2.785926 192.168.2.170 Ack=64694 Win=65535 Len=0 266 2.787602 192.168.2.170 Ack=67614 Win=65535 Len=0 269 2.788359 192.168.2.170 Ack=70534 Win=65535 Len=0 272 2.789687 192.168.2.170 Ack=73454 Win=65535 Len=0 275 2.790779 192.168.2.170 Ack=76374 Win=65535 Len=0 278 2.792008 192.168.2.170 Ack=79294 Win=65535 Len=0 281 2.793217 192.168.2.170 Ack=82214 Win=65535 Len=0 284 2.796829 192.168.2.170 Ack=85134 Win=65535 Len=0 286 2.797713 192.168.2.170 (len=68) 289 2.79912 192.168.2.170 Ack=89514 Win=65535 Len=0 292 2.800408 192.168.2.170 Ack=92434 Win=65535 Len=0 295 2.801562 192.168.2.170 Ack=95354 Win=65535 Len=0 298 2.802735 192.168.2.170 Ack=98274 Win=65535 Len=0 301 2.803906 192.168.2.170 Ack=101194 Win=65535 Len=0 304 2.805513 192.168.2.170 Ack=104114 Win=65535 Len=0 307 2.80676 192.168.2.170 Ack=107034 Win=65535 Len=0 310 2.808203 192.168.2.170 Ack=109954 Win=65535 Len=0 313 2.813923 192.168.2.170 Ack=112874 Win=65535 Len=0
192.168.1.8
TCP
54
58931 > 22 [ACK] Seq=11112
192.168.1.8
TCP
54
58931 > 22 [ACK] Seq=11112
192.168.1.8
TCP
54
58931 > 22 [ACK] Seq=11112
192.168.1.8
TCP
54
58931 > 22 [ACK] Seq=11112
192.168.1.8
TCP
54
58931 > 22 [ACK] Seq=11112
192.168.1.8
TCP
54
58931 > 22 [ACK] Seq=11112
192.168.1.8
SSHv2
122
Client: Encrypted packet
192.168.1.8
TCP
54
58931 > 22 [ACK] Seq=11180
192.168.1.8
TCP
54
58931 > 22 [ACK] Seq=11180
192.168.1.8
TCP
54
58931 > 22 [ACK] Seq=11180
192.168.1.8
TCP
54
58931 > 22 [ACK] Seq=11180
192.168.1.8
TCP
54
58931 > 22 [ACK] Seq=11180
192.168.1.8
TCP
54
58931 > 22 [ACK] Seq=11180
192.168.1.8
TCP
54
58931 > 22 [ACK] Seq=11180
192.168.1.8
TCP
54
58931 > 22 [ACK] Seq=11180
192.168.1.8
TCP
54
58931 > 22 [ACK] Seq=11180
192.168.1.8
TCP
54
58931 > 22 [ACK] Seq=11180
192.168.1.8
TCP
54
58931 > 22 [ACK] Seq=11180
192.168.1.8
TCP
54
58931 > 22 [ACK] Seq=11180
192.168.1.8
TCP
54
58931 > 22 [ACK] Seq=11180
192.168.1.8
TCP
54
58931 > 22 [ACK] Seq=11180
192.168.1.8
TCP
54
58931 > 22 [ACK] Seq=11180
192.168.1.8
TCP
54
58931 > 22 [ACK] Seq=11180
192.168.1.8
SSHv2
122
Client: Encrypted packet
192.168.1.8
TCP
54
58931 > 22 [ACK] Seq=11248
192.168.1.8
TCP
54
58931 > 22 [ACK] Seq=11248
192.168.1.8
TCP
54
58931 > 22 [ACK] Seq=11248
192.168.1.8
TCP
54
58931 > 22 [ACK] Seq=11248
192.168.1.8
TCP
54
58931 > 22 [ACK] Seq=11248
192.168.1.8
TCP
54
58931 > 22 [ACK] Seq=11248
192.168.1.8
TCP
54
58931 > 22 [ACK] Seq=11248
192.168.1.8
TCP
54
58931 > 22 [ACK] Seq=11248
192.168.1.8
TCP
54
58931 > 22 [ACK] Seq=11248
316 2.81509 192.168.2.170 192.168.1.8 TCP 54 58931 > 22 [ACK] Seq=11248 Ack=115794 Win=65535 Len=0 319 2.815933 192.168.2.170 192.168.1.8 TCP 54 58931 > 22 [ACK] Seq=11248 Ack=118714 Win=65535 Len=0 320 2.816195 192.168.2.170 192.168.1.8 SSHv2 122 Client: Encrypted packet (len=68) 323 2.822327 192.168.2.170 192.168.1.8 TCP 54 58931 > 22 [ACK] Seq=11316 Ack=121634 Win=65535 Len=0 326 2.823468 192.168.2.170 192.168.1.8 TCP 54 58931 > 22 [ACK] Seq=11316 Ack=124554 Win=65535 Len=0 329 2.824228 192.168.2.170 192.168.1.8 TCP 54 58931 > 22 [ACK] Seq=11316 Ack=127474 Win=65535 Len=0 331 2.82813 192.168.2.170 192.168.1.8 SSHv2 122 Client: Encrypted packet (len=68) 334 2.835817 192.168.2.170 192.168.1.8 TCP 54 58931 > 22 [ACK] Seq=11384 Ack=129022 Win=65535 Len=0 335 2.848832 192.168.2.170 192.168.1.8 SSHv2 106 Client: Encrypted packet (len=52) 337 2.856884 192.168.2.170 192.168.1.8 TCP 54 58931 > 22 [ACK] Seq=11436 Ack=129090 Win=65535 Len=0 340 3.086419 192.168.2.170 224.0.0.253 IGMPv2 46 Membership Report group 224.0.0.253 343 3.549075 192.168.2.170 192.168.1.8 TCP 54 [TCP Dup ACK 337#1] 58931 > 22 [ACK] Seq=11436 Ack=129090 Win=65535 Len=0 2 0.018631 192.168.2.193 224.0.0.251 MDNS 119 Standard query 0x0000 PTR _DE8535E3._sub._googlecast._tcp.local, "QM" question PTR _233637DE._sub._googlecast._tcp.local, "QM" question PTR _googlecast._tcp.local, "QM" question 26 1.903467 192.168.2.39 192.168.2.255 NBNS 92 Name query NB ISATAP 28 1.905323 192.168.2.39 224.0.0.252 LLMNR 66 Standard query 0x72e5 A isatap 37 2.321017 192.168.2.39 224.0.0.252 LLMNR 66 Standard query 0x72e5 A isatap 45 2.643931 192.168.2.39 192.168.2.255 NBNS 92 Name query NB ISATAP 341 3.394503 192.168.2.39 192.168.2.255 NBNS 92 Name query NB ISATAP 15 0.879045 AsustekC_e0:c4:08 Spanning-tree-(for-bridges)_00 STP 60 Conf. Root = 32768/0/d0:17:c2:e0:c4:08 Cost = 0 Port = 0x8001 16 1.019054 AsustekC_e0:c4:08 BroadcastARP 60 Who has 192.168.2.26? Tell 192.168.2.1 32 2.019002 AsustekC_e0:c4:08 BroadcastARP 60 Who has 192.168.2.26? Tell 192.168.2.1 338 2.879535 AsustekC_e0:c4:08 Spanning-tree-(for-bridges)_00 STP 60 Conf. Root = 32768/0/d0:17:c2:e0:c4:08 Cost = 0 Port = 0x8001 339 3.019027 AsustekC_e0:c4:08 BroadcastARP 60 Who has 192.168.2.26? Tell 192.168.2.1 27 1.904571 fe80::44db:8799:6143:8005 ff02::1:3 LLMNR 86 Standard query 0x72e5 A isatap 36 2.320638 fe80::44db:8799:6143:8005 ff02::1:3 LLMNR 86 Standard query 0x72e5 A isatap
E2: HR_data_1 DP: Transmitted data: Single HR data: 1 data point 25/03/2016 12:00:10 AM 12:00:10 AM 15 72 Captured Data: 192.168.1.8 (sensor: Raspberry Pi3), 192.168.2.170 (smartphone/IoT: PC) No. Time Source Destination Protocol Length Info 1 0 192.168.2.193 239.255.255.250 SSDP 167 M-SEARCH * HTTP/1.1 2 0.995985 AsustekC_e0:c4:08 Spanning-tree-(for-bridges)_00 STP 60 Conf. Root = 32768/0/d0:17:c2:e0:c4:08 Cost = 0 Port = 0x8001 3 1.5395 192.168.2.170 192.168.1.8 SSH 146 Client: Encrypted packet (len=92) 4 1.547707 192.168.1.8 192.168.2.170 SSH 202 Server: Encrypted packet (len=148) 5 1.547892 192.168.2.170 192.168.1.8 SSH 146 Client: Encrypted packet (len=92) 6 1.551016 192.168.1.8 192.168.2.170 SSH 130 Server: Encrypted packet (len=76) 7 1.551219 192.168.2.170 192.168.1.8 SSH 154 Client: Encrypted packet (len=100)
8 (len=52) 9 (len=68) 10 (len=68) 11 (len=68) 12 (len=68) 13 (len=68) 14 (len=68) 15 (len=68) 16 (len=68) 17 (len=68) 18 (len=68) 19 (len=68) 20 (len=68) 21 (len=68) 22 (len=68) 23 (len=68) 24 (len=68) 25 (len=68) 26 (len=68) 27 (len=68) 28 (len=68) 29 (len=68) 30 (len=68) 31 (len=68) 32 (len=68) 33 (len=68) 34 (len=68) 35 (len=68) 36 (len=68) 37 (len=68) 38 (len=68) 39 (len=68) 40 (len=68)
1.55244 192.168.1.8
192.168.2.170
SSH
106
Server: Encrypted packet
1.553019 192.168.2.170
192.168.1.8
SSH
122
Client: Encrypted packet
1.553067 192.168.2.170
192.168.1.8
SSH
122
Client: Encrypted packet
1.553109 192.168.2.170
192.168.1.8
SSH
122
Client: Encrypted packet
1.553146 192.168.2.170
192.168.1.8
SSH
122
Client: Encrypted packet
1.553264 192.168.2.170
192.168.1.8
SSH
122
Client: Encrypted packet
1.553321 192.168.2.170
192.168.1.8
SSH
122
Client: Encrypted packet
1.553372 192.168.2.170
192.168.1.8
SSH
122
Client: Encrypted packet
1.553406 192.168.2.170
192.168.1.8
SSH
122
Client: Encrypted packet
1.553442 192.168.2.170
192.168.1.8
SSH
122
Client: Encrypted packet
1.553462 192.168.2.170
192.168.1.8
SSH
122
Client: Encrypted packet
1.553484 192.168.2.170
192.168.1.8
SSH
122
Client: Encrypted packet
1.553532 192.168.2.170
192.168.1.8
SSH
122
Client: Encrypted packet
1.553586 192.168.2.170
192.168.1.8
SSH
122
Client: Encrypted packet
1.553646 192.168.2.170
192.168.1.8
SSH
122
Client: Encrypted packet
1.553727 192.168.2.170
192.168.1.8
SSH
122
Client: Encrypted packet
1.553801 192.168.2.170
192.168.1.8
SSH
122
Client: Encrypted packet
1.553838 192.168.2.170
192.168.1.8
SSH
122
Client: Encrypted packet
1.553871 192.168.2.170
192.168.1.8
SSH
122
Client: Encrypted packet
1.553925 192.168.2.170
192.168.1.8
SSH
122
Client: Encrypted packet
1.553943 192.168.2.170
192.168.1.8
SSH
122
Client: Encrypted packet
1.553978 192.168.2.170
192.168.1.8
SSH
122
Client: Encrypted packet
1.554025 192.168.2.170
192.168.1.8
SSH
122
Client: Encrypted packet
1.554058 192.168.2.170
192.168.1.8
SSH
122
Client: Encrypted packet
1.554108 192.168.2.170
192.168.1.8
SSH
122
Client: Encrypted packet
1.55414 192.168.2.170
192.168.1.8
SSH
122
Client: Encrypted packet
1.554172 192.168.2.170
192.168.1.8
SSH
122
Client: Encrypted packet
1.554217 192.168.2.170
192.168.1.8
SSH
122
Client: Encrypted packet
1.554252 192.168.2.170
192.168.1.8
SSH
122
Client: Encrypted packet
1.554283 192.168.2.170
192.168.1.8
SSH
122
Client: Encrypted packet
1.5543
192.168.2.170
192.168.1.8
SSH
122
Client: Encrypted packet
1.554317 192.168.2.170
192.168.1.8
SSH
122
Client: Encrypted packet
1.554347 192.168.2.170
192.168.1.8
SSH
122
Client: Encrypted packet
41 (len=68) 42 (len=68) 43 (len=68) 44 (len=68) 45 (len=68) 46 (len=68) 47 (len=68) 48 (len=68) 49 (len=68) 50 (len=68) 51 (len=68) 52 (len=68) 53 (len=68) 54 (len=68) 55 (len=68) 56 (len=68) 57 (len=68) 58 (len=68) 59 (len=68) 60 (len=68) 61 (len=68) 62 (len=68) 63 (len=68) 64 (len=68) 65 (len=68) 66 (len=68) 67 (len=68) 68 (len=68) 69 (len=68) 70 (len=68) 71 (len=68) 72 (len=68) 73 (len=68)
1.554375 192.168.2.170
192.168.1.8
SSH
122
Client: Encrypted packet
1.554405 192.168.2.170
192.168.1.8
SSH
122
Client: Encrypted packet
1.554421 192.168.2.170
192.168.1.8
SSH
122
Client: Encrypted packet
1.554458 192.168.2.170
192.168.1.8
SSH
122
Client: Encrypted packet
1.554493 192.168.2.170
192.168.1.8
SSH
122
Client: Encrypted packet
1.554542 192.168.2.170
192.168.1.8
SSH
122
Client: Encrypted packet
1.554575 192.168.2.170
192.168.1.8
SSH
122
Client: Encrypted packet
1.554658 192.168.2.170
192.168.1.8
SSH
122
Client: Encrypted packet
1.554688 192.168.2.170
192.168.1.8
SSH
122
Client: Encrypted packet
1.554717 192.168.2.170
192.168.1.8
SSH
122
Client: Encrypted packet
1.55474 192.168.2.170
192.168.1.8
SSH
122
Client: Encrypted packet
1.55477 192.168.2.170
192.168.1.8
SSH
122
Client: Encrypted packet
1.554806 192.168.2.170
192.168.1.8
SSH
122
Client: Encrypted packet
1.554823 192.168.2.170
192.168.1.8
SSH
122
Client: Encrypted packet
1.554853 192.168.2.170
192.168.1.8
SSH
122
Client: Encrypted packet
1.554891 192.168.2.170
192.168.1.8
SSH
122
Client: Encrypted packet
1.554941 192.168.2.170
192.168.1.8
SSH
122
Client: Encrypted packet
1.554972 192.168.2.170
192.168.1.8
SSH
122
Client: Encrypted packet
1.554988 192.168.2.170
192.168.1.8
SSH
122
Client: Encrypted packet
1.555034 192.168.2.170
192.168.1.8
SSH
122
Client: Encrypted packet
1.555066 192.168.2.170
192.168.1.8
SSH
122
Client: Encrypted packet
1.555082 192.168.2.170
192.168.1.8
SSH
122
Client: Encrypted packet
1.555114 192.168.2.170
192.168.1.8
SSH
122
Client: Encrypted packet
1.555131 192.168.2.170
192.168.1.8
SSH
122
Client: Encrypted packet
1.55518 192.168.2.170
192.168.1.8
SSH
122
Client: Encrypted packet
1.5552
192.168.2.170
192.168.1.8
SSH
122
Client: Encrypted packet
1.555248 192.168.2.170
192.168.1.8
SSH
122
Client: Encrypted packet
1.555266 192.168.2.170
192.168.1.8
SSH
122
Client: Encrypted packet
1.555297 192.168.2.170
192.168.1.8
SSH
122
Client: Encrypted packet
1.555329 192.168.2.170
192.168.1.8
SSH
122
Client: Encrypted packet
1.555359 192.168.2.170
192.168.1.8
SSH
122
Client: Encrypted packet
1.555393 192.168.2.170
192.168.1.8
SSH
122
Client: Encrypted packet
1.555409 192.168.2.170
192.168.1.8
SSH
122
Client: Encrypted packet
74 (len=68) 75 (len=68) 76 (len=68) 77 (len=68) 78 (len=68) 79 (len=68) 80 (len=68) 81 (len=68) 82 (len=68) 83 (len=68) 84 (len=68) 85 (len=68) 86 (len=68) 87 (len=68) 88 (len=68) 89 (len=68) 90 (len=68) 91 (len=68) 92 (len=68) 93 (len=68) 94 (len=68) 95 (len=68) 96 (len=68) 97 (len=68) 98 (len=68) 99 (len=68) 100 (len=68) 101 (len=68) 102 (len=68) 103 (len=68) 104 (len=68) 105 (len=68) 106 (len=68)
1.555453 192.168.2.170
192.168.1.8
SSH
122
Client: Encrypted packet
1.555504 192.168.2.170
192.168.1.8
SSH
122
Client: Encrypted packet
1.555527 192.168.2.170
192.168.1.8
SSH
122
Client: Encrypted packet
1.55556 192.168.2.170
192.168.1.8
SSH
122
Client: Encrypted packet
1.555611 192.168.2.170
192.168.1.8
SSH
122
Client: Encrypted packet
1.555631 192.168.2.170
192.168.1.8
SSH
122
Client: Encrypted packet
1.55565 192.168.2.170
192.168.1.8
SSH
122
Client: Encrypted packet
1.555684 192.168.2.170
192.168.1.8
SSH
122
Client: Encrypted packet
1.555704 192.168.2.170
192.168.1.8
SSH
122
Client: Encrypted packet
1.555732 192.168.2.170
192.168.1.8
SSH
122
Client: Encrypted packet
1.555767 192.168.2.170
192.168.1.8
SSH
122
Client: Encrypted packet
1.555802 192.168.2.170
192.168.1.8
SSH
122
Client: Encrypted packet
1.555821 192.168.2.170
192.168.1.8
SSH
122
Client: Encrypted packet
1.55585 192.168.2.170
192.168.1.8
SSH
122
Client: Encrypted packet
1.555899 192.168.2.170
192.168.1.8
SSH
122
Client: Encrypted packet
1.555934 192.168.2.170
192.168.1.8
SSH
122
Client: Encrypted packet
1.555967 192.168.2.170
192.168.1.8
SSH
122
Client: Encrypted packet
1.556006 192.168.2.170
192.168.1.8
SSH
122
Client: Encrypted packet
1.556034 192.168.2.170
192.168.1.8
SSH
122
Client: Encrypted packet
1.556093 192.168.2.170
192.168.1.8
SSH
122
Client: Encrypted packet
1.556174 192.168.2.170
192.168.1.8
SSH
122
Client: Encrypted packet
1.556215 192.168.2.170
192.168.1.8
SSH
122
Client: Encrypted packet
1.55625 192.168.2.170
192.168.1.8
SSH
122
Client: Encrypted packet
1.556288 192.168.2.170
192.168.1.8
SSH
122
Client: Encrypted packet
1.55632 192.168.2.170
192.168.1.8
SSH
122
Client: Encrypted packet
1.556354 192.168.2.170
192.168.1.8
SSH
122
Client: Encrypted packet
1.556392 192.168.2.170
192.168.1.8
SSH
122
Client: Encrypted packet
1.556427 192.168.2.170
192.168.1.8
SSH
122
Client: Encrypted packet
1.556445 192.168.2.170
192.168.1.8
SSH
122
Client: Encrypted packet
1.556492 192.168.2.170
192.168.1.8
SSH
122
Client: Encrypted packet
1.556528 192.168.2.170
192.168.1.8
SSH
122
Client: Encrypted packet
1.556583 192.168.2.170
192.168.1.8
SSH
122
Client: Encrypted packet
1.556617 192.168.2.170
192.168.1.8
SSH
122
Client: Encrypted packet
107 1.556667 192.168.2.170 (len=68) 108 1.556717 192.168.2.170 (len=68) 109 1.556736 192.168.2.170 (len=68) 110 1.556768 192.168.2.170 (len=68) 111 1.556802 192.168.2.170 (len=68) 112 1.556839 192.168.2.170 (len=68) 113 1.556868 192.168.2.170 (len=68) 114 1.557068 192.168.2.170 (len=68) 115 1.557152 192.168.2.170 (len=68) 116 1.557208 192.168.2.170 (len=68) 117 1.557245 192.168.2.170 (len=68) 118 1.557285 192.168.2.170 (len=68) 119 1.557321 192.168.2.170 (len=68) 120 1.55737 192.168.2.170 (len=68) 121 1.557389 192.168.2.170 (len=68) 122 1.557423 192.168.2.170 (len=68) 123 1.55746 192.168.2.170 (len=68) 124 1.557493 192.168.2.170 (len=68) 125 1.557533 192.168.2.170 (len=68) 126 1.557585 192.168.2.170 (len=68) 127 1.557636 192.168.2.170 (len=68) 128 1.557659 192.168.2.170 (len=68) 129 1.557691 192.168.2.170 (len=68) 130 1.557723 192.168.2.170 (len=68) 131 1.557762 192.168.2.170 (len=68) 132 1.557812 192.168.2.170 (len=68) 133 1.557928 192.168.2.170 (len=68) 134 1.557959 192.168.2.170 (len=68) 135 1.557978 192.168.2.170 (len=68) 136 1.558034 192.168.2.170 (len=68) 137 1.559498 192.168.1.8 Ack=489 Win=64240 Len=0 138 1.561138 192.168.1.8 (len=660) 139 1.561138 192.168.1.8 Ack=897 Win=64240 Len=0
192.168.1.8
SSH
122
Client: Encrypted packet
192.168.1.8
SSH
122
Client: Encrypted packet
192.168.1.8
SSH
122
Client: Encrypted packet
192.168.1.8
SSH
122
Client: Encrypted packet
192.168.1.8
SSH
122
Client: Encrypted packet
192.168.1.8
SSH
122
Client: Encrypted packet
192.168.1.8
SSH
122
Client: Encrypted packet
192.168.1.8
SSH
122
Client: Encrypted packet
192.168.1.8
SSH
122
Client: Encrypted packet
192.168.1.8
SSH
122
Client: Encrypted packet
192.168.1.8
SSH
122
Client: Encrypted packet
192.168.1.8
SSH
122
Client: Encrypted packet
192.168.1.8
SSH
122
Client: Encrypted packet
192.168.1.8
SSH
122
Client: Encrypted packet
192.168.1.8
SSH
122
Client: Encrypted packet
192.168.1.8
SSH
122
Client: Encrypted packet
192.168.1.8
SSH
122
Client: Encrypted packet
192.168.1.8
SSH
122
Client: Encrypted packet
192.168.1.8
SSH
122
Client: Encrypted packet
192.168.1.8
SSH
122
Client: Encrypted packet
192.168.1.8
SSH
122
Client: Encrypted packet
192.168.1.8
SSH
122
Client: Encrypted packet
192.168.1.8
SSH
122
Client: Encrypted packet
192.168.1.8
SSH
122
Client: Encrypted packet
192.168.1.8
SSH
122
Client: Encrypted packet
192.168.1.8
SSH
122
Client: Encrypted packet
192.168.1.8
SSH
122
Client: Encrypted packet
192.168.1.8
SSH
122
Client: Encrypted packet
192.168.1.8
SSH
122
Client: Encrypted packet
192.168.1.8
SSH
122
Client: Encrypted packet
192.168.2.170
TCP
60
22 > 58997 [ACK] Seq=277
192.168.2.170
SSH
714
Server: Encrypted packet
192.168.2.170
TCP
60
22 > 58997 [ACK] Seq=937
140 1.56134 192.168.2.170 192.168.1.8 SSH 122 (len=68) 141 1.562953 192.168.1.8 192.168.2.170 TCP 60 Ack=1509 Win=64240 Len=0 142 1.567114 192.168.1.8 192.168.2.170 TCP 60 Ack=1985 Win=64240 Len=0 143 1.568135 192.168.1.8 192.168.2.170 SSH 282 (len=228) 144 1.568838 192.168.1.8 192.168.2.170 TCP 60 Ack=2597 Win=64240 Len=0 145 1.570157 192.168.1.8 192.168.2.170 SSH 378 (len=324) 146 1.570229 192.168.2.170 192.168.1.8 TCP 54 Ack=1489 Win=65535 Len=0 147 1.571778 192.168.1.8 192.168.2.170 SSH 314 (len=260) 148 1.57391 192.168.1.8 192.168.2.170 TCP 60 Ack=4229 Win=64240 Len=0 149 1.575721 192.168.1.8 192.168.2.170 TCP 60 Ack=5317 Win=64240 Len=0 150 1.577763 192.168.1.8 192.168.2.170 SSH 378 (len=324) 151 1.577764 192.168.1.8 192.168.2.170 TCP 60 Ack=6405 Win=64240 Len=0 152 1.577856 192.168.2.170 192.168.1.8 TCP 54 Ack=2073 Win=65535 Len=0 153 1.581373 192.168.1.8 192.168.2.170 TCP 60 Ack=7425 Win=64240 Len=0 154 1.581875 192.168.1.8 192.168.2.170 SSH 858 (len=804) 155 1.582176 192.168.1.8 192.168.2.170 SSH 602 (len=548) 156 1.582254 192.168.2.170 192.168.1.8 TCP 54 Ack=3425 Win=65535 Len=0 157 1.582739 192.168.1.8 192.168.2.170 SSH 602 (len=548) 158 1.583239 192.168.1.8 192.168.2.170 SSH 570 (len=516) 159 1.583316 192.168.2.170 192.168.1.8 TCP 54 Ack=4489 Win=65535 Len=0 160 1.583405 192.168.1.8 192.168.2.170 TCP 60 Ack=7901 Win=64240 Len=0 161 1.583713 192.168.1.8 192.168.2.170 TCP 60 Ack=8445 Win=64240 Len=0 162 1.584446 192.168.1.8 192.168.2.170 TCP 60 Ack=9057 Win=64240 Len=0 163 1.584807 192.168.1.8 192.168.2.170 SSH 314 (len=260) 164 1.585167 192.168.1.8 192.168.2.170 SSH 346 (len=292) 165 1.585247 192.168.2.170 192.168.1.8 TCP 54 Ack=5041 Win=65535 Len=0 166 1.585696 192.168.1.8 192.168.2.170 SSH 378 (len=324) 167 1.586862 192.168.2.170 192.168.1.8 SSH 106 (len=52) 168 1.588054 192.168.1.8 192.168.2.170 SSH 122 (len=68) 169 1.594377 192.168.2.170 192.168.1.8 TCP 54 Ack=5433 Win=65535 Len=0 170 2.996 AsustekC_e0:c4:08 Spanning-tree-(for-bridges)_00 = 32768/0/d0:17:c2:e0:c4:08 Cost = 0 Port = 0x8001
End of Document
Client: Encrypted packet 22 > 58997 [ACK] Seq=937 22 > 58997 [ACK] Seq=937 Server: Encrypted packet 22 > 58997 [ACK] Seq=1165 Server: Encrypted packet 58997 > 22 [ACK] Seq=9057 Server: Encrypted packet 22 > 58997 [ACK] Seq=1749 22 > 58997 [ACK] Seq=1749 Server: Encrypted packet 22 > 58997 [ACK] Seq=2073 58997 > 22 [ACK] Seq=9057 22 > 58997 [ACK] Seq=2073 Server: Encrypted packet Server: Encrypted packet 58997 > 22 [ACK] Seq=9057 Server: Encrypted packet Server: Encrypted packet 58997 > 22 [ACK] Seq=9057 22 > 58997 [ACK] Seq=4489 22 > 58997 [ACK] Seq=4489 22 > 58997 [ACK] Seq=4489 Server: Encrypted packet Server: Encrypted packet 58997 > 22 [ACK] Seq=9057 Server: Encrypted packet Client: Encrypted packet Server: Encrypted packet 58997 > 22 [ACK] Seq=9109 STP
60
Conf. Root