Proceedings – 23rd Annual Conference – IEEE/EMBS Oct.25-28, 2001, Istanbul, TURKEY
A Fuzzy Inference System for Detection of Obstructive Sleep Apnea Homer Nazeran1,2, Asher Almas2 , Khosrow Behbehani2 , John Burk3 , and Edgar Lucas3 1 School of Informatics and Engineering, Flinders University of South Australia 2 Biomedcial Engineering Program, University of Texas at Arlington and University of Texas Southwestern Medical Center at Dallas, Texas USA 3 Sleep Consultants Inc. Fort Worth, Texas USA. E-mail:
[email protected] Abstract: A fuzzy inference system (FIS) was developed to detect obstructive sleep apnea (OSA) by analyzing the respiratory airflow signal in adults. The parameters analyzed were the normalized area and the standard deviation of consecutive 3-second intervals of baseline adjusted and rectified airflow signal. Fuzzy logic was used to process these parameters to detect apnea and hypopnea when the output values were within a specified range extracted from OSA patient data. The FIS comprised of three major stages of computation: fuzzification, fuzzy rule evaluation and defuzzification. Seven males and two females with an average age of 48 years (range: 26 - 66 years), an average weight of 102 Kg (range: 63 159 Kg), an average height of 1.7 m (range: 1.5 - 1.8 m) and an average body mass index (BMI) of 33 Kg/m2 (range: 21 – 42 Kg/m2) participated in this study. Patients spent at least 8 hours in an accredited sleep laboratory. However, patient data was collected for only part of this time. The total amount of test time for all nine patients was 38.83 hours with an average of 4.31 hours/patient (range: 1.92 – 7.63 hours). The total number of apnea events occurring during this time was 808, and the number of hypopnea events was 694. The membership functions for the FIS were derived by analyzing apnea and hypopnea events in four patients. The data from all nine patients were used in algorithm performance evaluation. The apnea and hypopnea events were scored by a sleep specialist and were used to test the correct detection rate by the FIS. The results demonstrated that the FIS reached an overall correct detection rate of 83% across all patients. The false negative rate was 17% and the false positive rate was 12%. The correct detection rate varied from patient to patient and correct rates greater than 90% were achieved in three patients. This study suggests that fuzzy inference could provide an intelligent algorithm for control of a continuous positive airway pressure (CPAP) machine. It would detect apnea and hypopnea events and automatically adjust the pressure to eliminate them. The performance of the algorithm could be further optimized to give increased detection rates. This could be achieved by performing further studies on a larger OSA patient population and utilizing augmentative methods such as neural networks to better sense the fuzzy patterns in the OSA data. Keywords: Obstructive sleep apnea (OSA); Fuzzy inference
system (FIS); Automatic positive airway pressure (APAP) machines; Biomedical signal processing; Pattern recognition I. INTRODUCTION Sleep-disordered breathing (SDB) has been studied for more than two decades. Obstructive sleep apnea (OSA) 0-7803-7211-5/01$10.00©2001 IEEE
occurs when respiratory effort is present but the upper airway is occluded and air exchange is either completely or partially compromised due to pharyngeal wall collapse during sleep. It is generally believed that loss of upper airway muscle tone during sleep leads to pharyngeal wall vibration (loud snoring) and upper airway collapse. Repeated apneic events result in the development of a pathological condition called obstructive sleep apnea syndrome (OSAS). OSAS patients have, among other symptoms, excessive daytime sleepiness, systemic hypertension, and chronic fatigue. A recent survey in USA estimated that 15% of male and 5% of female adults of the general population may be suffering from OSAS [1]. The methods used to treat OSAS range from weight loss, surgical widening of the airway, mechanical devices for upper airway maintenance, electrical stimulation of the upper airway, pharmacological agents, and oxygen administration [2]. All of these methods seem to have some benefits. Presently, the most popular therapeutic method for treatment of OSA and hypopnea is the nasally applied continuous positive airway pressure (CPAP) method [3]. A CPAP machine applies a constant pressure, called the prescribed pressure, to the patient’s airway through a nasal mask while the patient sleeps. The level of applied pressure is determined in a sleep laboratory by manually titrating the applied pressure to eliminate all respiratory events (apnea, hypopnea and snoring) during sleep. Advantages of nasal CPAP are that it produces immediate relief, is noninvasive, and can be used while achieving weight loss or considering surgical treatment. An obvious limitation with some of the commercially available CPAP machines is that they continuously and uniformly apply the prescribed pressure throughout the night regardless of variations in the patient’s weight, alcohol consumption, nasal congestion and sleeping position that affect the level of pressure required to eliminate respiratory events. Patients often complain about increased expiratory effort or sensation of forced air through their nostrils, especially prior to sleep onset. Hence, when CPAP with a fixed pressure is used, the patient may be over- or under-treated. Obviously, frequent re-evaluation of the prescribed pressure through manual titration in a sleep laboratory is cost-prohibitive and impractical. Recently, it was shown [4] that treatment by CPAP can be improved by the use of a variable pressure that is automatically adjusted to prevent OSA. Therefore, automatic positive airway pressure (APAP) machines have
Report Documentation Page Report Date 25 Oct 2001
Report Type N/A
Title and Subtitle A Fuzzy Inference System for Detection of Obstructive Sleep Apnea
Dates Covered (from... to) Contract Number Grant Number Program Element Number
Author(s)
Project Number Task Number Work Unit Number
Performing Organization Name(s) and Address(es) School of Informatics and Engineering Flinders University of South Australia
Performing Organization Report Number
Sponsoring/Monitoring Agency Name(s) and Address(es) US Army Research, Development & Standardization Group (UK) PSC 802 Box 15 FPO AE 09499-1500
Sponsor/Monitor’s Acronym(s) Sponsor/Monitor’s Report Number(s)
Distribution/Availability Statement Approved for public release, distribution unlimited Supplementary Notes Papers from 23rd Annual International Conference of the IEEE Engineering in Medicine and Biology Society, Oct 25-28, 2001, held in Istanbul, Turkey. See also ADM001351 for entire conference on cd-rom, The original document contains color images. Abstract Subject Terms Report Classification unclassified
Classification of this page unclassified
Classification of Abstract unclassified
Limitation of Abstract UU
Number of Pages 4
Proceedings – 23rd Annual Conference – IEEE/EMBS Oct.25-28, 2001, Istanbul, TURKEY
been developed [5] to increase patient compliance and comfort and to enhance the therapeutic efficacy of CPAP therapy. The success of APAP “presupposes” accurate detection of apneic/hypopneic events. Although satisfactory performance of the APAP machine does not require perfect detection of all apneic/hypopneic events, an intelligent, robust and cost-effective algorithm is needed to further enhance the performance characteristics of APAP machines and maximize the therapeutic efficacy and comfort of OSA patients. Fuzzy logic was devised by Zadeh in 1965 [6] to increase machine intelligent quotient (MIQ) and mimic human thought and decision making processes in computing. This was an attempt to characterize classes of objects with unsharp boundaries in which membership is a matter of degree, rather than a certainty. Recently, fuzzy logic has found tremendous applications in industry. The use of fuzzy logic in medical research has now spread to a number of disciplines. Very recently, it has been also used in sleep apnea research [7]. Sleep apnea is a difficult condition to describe with deterministic mathematical methods, as there is a great degree of variability from person to person. Fuzzy logic is well suited to discern the vague or uncertain areas when certain parts of the defining quantities overlap or vary from person to person as a matter of degree. This paper presents a fuzzy inference system for detection of apnea events. It presents the design of the fuzzy detector and reports on its performance in detecting apneic events in nine OSA patients [8] . II. MATERIALS AND METHODS To design and evaluate the performance of the fuzzy OSA detector, airflow signals were collected from nine patients suffering from OSAS. In this group of patients there were 7 males and 2 females. Their ages ranged from 26 to 66 years (average: 48±15years); the average weight was 102±27 Kg (range: 63 to 159 Kg); an average height of 1.70±0.13 m (range: 1.49 to 1.83 m); and an average body mass index (BMI) of 33±6 Kg/m2 (range: 21 to 42). The data for this study was obtained during an initial portion of the patient’s visit to the sleep laboratory for diagnosis and treatment of OSA. The rest of the time was used for titration of patient airway pressure during the night. The total amount of time, for all nine patients, was 38.83 hours with an average of 4.31±1.78 hours (range: 1.92 to 7.63 hours). The number of apnea events that occurred during this test time was 808 with an average per patient of 90±109 (range: 9 to 291). The number of hypopnea events that occurred during the test time was 694 with an average per patient of 77±58 (range: 9 to 154). Apnea index, AI, (occurrence of apnea events per hour) ranged from 3 to 66 with a mean value of 19±21. A sleep specialist determined the apnea and hypopnea events during the test time. The hypopnea index, HI, was obtained in a similar manner to AI
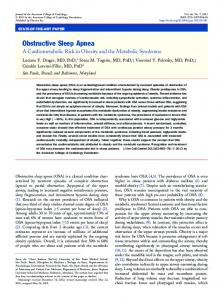
Lowpass Filter
Baseline Removal & Rectification
Area & STD Calculator
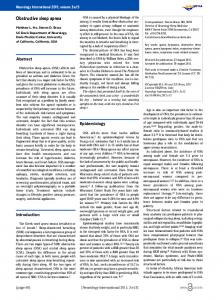
Fig. 1. Block diagram of the fuzzy inference system (FIS) for OSA detection. with an average of 21 ±19 ranging from 2 to 50. The average AHI was 39±29 (range: 9 to 106). In this study, only AI was used in the design of the FIS. Future studies will use AI, HI as well as AHI (apnea/hypopnea index, defined as the sum of apnea and hypopnea events per hour). The block diagram for the overall fuzzy OSA detector is shown in Fig. 1. The airflow signal was used as input to the fuzzy detector and the final output was provided by the fuzzy inference algorithm (FIA). The airflow signal was acquired from the patient by a data acquisition setup shown in Fig. 2. Full polysomnography data was also collected for independent scoring of the data by a certified sleep technician. The flow signal was then filtered through a digital low-pass filter. The baseline was removed and the signal was rectified. Area and standard deviation of consecutive 3-second intervals of the baseline-adjusted and rectified flow signal were calculated and used as inputs to the FIA. The details of each block are explained below. A. Instrumentation Fig. 2. shows the experimental setup to collect the airflow signal required for the design of the fuzzy OSA detector. The flow signal was measured by a Fleisch pneumotachometer that was placed in series with the air tube of patient’s breathing mask as shown in the figure. The airflow signal was passed through a first-order analog filter (band-limiter) with a cutoff frequency of 20 Hz. The filtered signal was then amplified and fed through an analog-to-digital-converter (ADC, DAS16, Metrobyte, USA) with a sampling rate of 1024 samples/s and stored in binary format (using a 486 Intel processor operating at 66 MHz). Fig. 3. shows an example of typical breathing patterns in an OSA patient. B. Processing of flow signal Low-pass filter
The stored flow data were read from the data file and fed through a single-pole digital low-pass filter. The analog prototype filter used was a single-pole filter with a cutoff frequency of 10 rad/s (1.6 Hz). This filtered some of the snoring noise that were present in the signal, as the focus of this study was on analyzing the lower frequency components of respiratory flow (e.g., 15 breaths per minutes or 0.25 Hz). Therefore, the transfer function H(s) for the prototype filter was: 1 H (s) = (1) 0.1s + 1
2
Proceedings – 23rd Annual Conference – IEEE/EMBS Oct.25-28, 2001, Istanbul, TURKEY Flow Transducer integration. The following equations were used to calculate A and σ values (n = total number of samples): CPAP
A=
n
∑ 0.5[ y (k − 1) + y ( k )]× [ t (k ) − t (k − 1)]
(4)
k =1
n
C O M P U T
Airflow signal
σ =
Normal
1
0 -0.5 -1 2
3
4
5
6
7
8
Hypopnea
0.5 0 -0.5 -1 0
1
2
3
4
5
6
7
8
9
0.2 0 Apnea
k =1
n ( n − 1)
(5)
Due to variations in area and standard deviations between patients, it was necessary to normalize these values. The normalization was achieved by taking the first 60 or 120 seconds of normal breathing signals from each patient to calculate A and σ. These values were used as the common denominator to normalize A and σ values, respectively, for that particular patient. For patients whose breathing data were used to develop the FIA, A and σ values for normal breathing were available so their average values were used in normalization.
0.5
1
k =1
B.3 Area and standard deviation normalization
Fig. 2. Experimental setup for acquisition of airflow data.
0
n
n ∑ y 2 (k ) − [ ∑ y ( k )]2
-0.2 -0.4 -0.6 0
1
2
3
4 Time(sec)
5
6
7
8
Fig. 3. Typical breathing patterns in an OSA patient. Top: respiratory flow in normal breathing. Middle: respiratory flow in hypopnea. Lower: Respiratory flow in apnea. All plots are in l/s. The prototype filter was then converted into the digital filter using the bilinear transformation. This was achieved by using the ‘c2d’ function in MATLAB. The resulting system function H(z) using a sampling period of T=0.001 (seconds) was:
Y(z) 0.0049z +0.0049 0.0049+0.0049z−1 = H(z) = = X(z) z −0.99 1−0.99z−1
(2)
From the system function, the following difference equation was derived for software implementation:
y(k ) = 0.99 y(k −1) + 0.0049x(k ) + 0.0049x(k −1)
(3)
The output y(k) represents the filtered airflow data and x(k) represents the raw airflow data. Each sample point in the airflow signal is represented by k (sample number) in discrete form. B.1 Baseline adjustment and rectification
From the filtered airflow signal, the baseline was determined by taking the arithmetic mean value,y, of the signal and subtracting it from each sample point to remove the baseline. The filtered baseline-adjusted flow signal, b(k), was rectified by taking the absolute value of each sample point to obtain r(k).
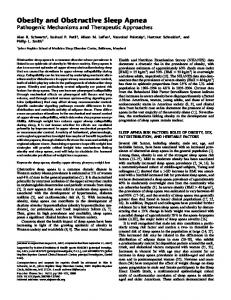
C. Fuzzy inference system (FIS) Many types of algorithms have been developed using fuzzy logic. The type used in this study was the min-max method. It was first developed in early 1970’s by E. Mamdani for a control application and is still in use today [9]. The FIA consisted of three major stages: (a) fuzzification, (b) rule evaluation, and (c) defuzzification. A graphical representation is given in Fig. 4. The inputs to the FIA were the normalized A and σ values as described before. The middle three blocks represent the actual FIA. The inputs were fuzzified to give fuzzy inputs by the input membership functions. The rule evaluation or fuzzy inferencing employed the min-max method to determine which rules and their degrees of membership should be evaluated in the defuzzification stage. The centroid method was utilized in the defuzzification stage to give the final crisp outputs. The membership functions for A and σ were derived from clipped apnea and hypopnea events from four patients. Approximately 12% of the apnea/hypopnea events were clipped and analyzed for computing the membership functions for the normalized A and σ parameters. The mean and two standard deviations on either side of the mean values were used to realize the relation between apnea, hypopnea and normal breathing membership functions. The fuzzy input and output membership functions and graphical mapping of some of the IF THEN rules are illustrated in Fig. 5. This figure shows the fuzzy input membership functions for normalized A and normalized σ, and fuzzy output membership functions for OSA, hypopnea and normal breathing.
B.2 Area and standard deviation calculation
From the resulting airflow signal, the area (A) and the standard deviation (σ), were calculated for consecutive 3second intervals. These values were used as input for the FIA. The area was derived from the trapezoidal rule for
Fuzzification (Input Membership Functions)
Rule Evaluation (Fuzzy Inferencing)
Defuzzification (Output Membership Functions)
Fig. 4. Block diagram of Fuzzy Inference Algorithm (FIA) 3
Proceedings – 23rd Annual Conference – IEEE/EMBS Oct.25-28, 2001, Istanbul, TURKEY
The total number of apnea events scored by the sleep specialist was 808. The number of events detected by the FIS was 668 yielding 83% correct detection rate. The false negative events (those not detected by the FIS but scored by the specialist) was 140 yielding a rate of 17%. The false positive events (those detected by the FIS but not scored by the specialist) excluding hypopnea events was 94, yielding a rate of 12%. IV. DISCUSSION
Figure 5: Illustration of fuzzfication of inputs (A and σ) as well as output membership functions. III. RESULTS Fig. 6 illustrates the steps involved in processing 1 minute of the airflow signal as a graphical example. The panels in Fig. 6 show the results obtained from processing the flow signal (from top to bottom): the low pass filtered flow signal, baseline removed flow signal, the rectified baseline removed signal, areas of consecutive 3-second intervals, standard deviations of consecutive 3-second intervals, and the output of the fuzzy inference system. The performance of the FIS was tested on all nine patients. All patients had been diagnosed previously with sleep apnea by a certified sleep specialist manually scoring the recordings from a nocturnal polysomnographic (NPSG) study. Blind to the objectives of this study, the specialist scored the data for apnea and hypopnea events along with the time of occurrence of these events. The specialist’s determination of sleep disordered breathing was used as a “gold standard”.
Fig. 6. Steps involved in processing 1 min of the airflow signal.
The results demonstrated that the FIS reached an overall correct detection rate of 83%. The correct detection rate varied from patient to patient but was greater than 90% for three patients. In one patient it was 59%. This suggests that the FIS should include other characteristics of the data such as airflow profile, snoring intensity and/or frequency, and other features. The performance of the fuzzy inference system could be fully optimized by performing further studies on a larger population of OSA patients and neural networks could be utilized to better sense the fuzzy patterns in the OSA data to provide better fuzzy rules to achieve higher correct apnea/hypopnea detection [10]. V. CONCLUSION This study suggests that a fuzzy inference system could provide an intelligent algorithm as an integral part of a controller for continuous positive airway pressure (CPAP) machines. Such a system would detect apnea and hypopnea events and automatically adjusts the air pressure on decreased depth of breathing. The FIS has the potential to make the realization of a robust, fast, and low-cost fuzzy controller for the APAP machines a feasible reality in the near future. REFERENCES [1] T Young et al., “Prevalence and correlates of sleep disordered breathing in the Wisconsin sleep and cohort study", New England J. Med., pp. 1230-1235, 1993 [2] M R Kryger, et al., Principles and Practices of Sleep Medicine: 2nd ed., Philadelphia: W.B Saunders Company, pp. 630-705, 1994 [3] F Perez-Guerra, “ The treatment of sleep apnea,” Texas Med., vol. 83, pp. 30-33, 1987 [4] J R Burk et al., “Auto-CPAP in treatment of sleep apnea: a new approach,” Sixth Annual Meeting, Sleep Ass. of Professional Sleep Societies, p61, 1992 [5] K Behbehani et al., “Automatic control of airway pressure for treatment of obstructive sleep apnea,” IEEE Trans. Biomed. Eng., 42, (10), pp. 1007-1016, 1995 [6] L A Zadeh, "Fuzzy Sets," Information and Control, vol. 8, pp. 338353, 1965. [7] J W Shin et al., "Fuzzy Assessment of Sleep-disordered Breathing During Continuous Positive Airway Pressure Therapy," Sleep, vol. 21, no. 8, 1998. [8] A Almas “ Computerized Detection of Sleep Apnea Using Fuzzy Logic”, MSc Thesis, Biomedical engineering, UTA, 2001 [9] E H Mamdani, "Application of fuzzy algorithms for control of simple dynamic plant," Proc. Inst. Elec. Eng., vol. 121, pp. 1585-1588, 1974. [10] Nazeran H and Behbehani K "Neural Networks in Processing and Analysis of Biomedical Signals" in "Nonlinear Biomedical Signal Processing" M Akay (Ed.), Vol. 1, pp 69-97, IEEE Press, Piscataway, USA, 2000
4