we propose a novel methodology in this paper that combines. RR-interval based features of the ECG signal based on the two approaches suggested by Chazal ...
Detection of Obstructive Sleep Apnea Through ECG Signal Features Laiali Almazaydeh, Khaled Elleithy, Miad Faezipour Department of Computer Science and Engineering University of Bridgeport Bridgeport, CT 06604, USA {lalmazay, elleithy, mfaezipo}@bridgeport.edu
Abstract—Obstructive sleep apnea (OSA) is a common disorder in which individuals stop breathing during their sleep. Most of sleep apnea cases are currently undiagnosed because of expenses and practicality limitations of overnight polysomnography (PSG) at sleep labs, where an expert human observer is needed to work over night. New techniques for sleep apnea classification are being developed by bioengineers for most comfortable and timely detection. In this paper, an automated classification algorithm is presented which processes short duration epochs of the electrocardiogram (ECG) data. The automated classification algorithm is based on support vector machines (SVM) and has been trained and tested on sleep apnea recordings from subjects with and without OSA. The results show that our automated classification system can recognize epochs of sleep disorders with a high degree of accuracy, approximately 96.5%. Moreover, the system we developed can be used as a basis for future development of a tool for OSA screening. Keywords: sleep apnea, PSG, ECG, RR interval, feature extraction, SVM.
I.
INTRODUCTION
A. Background Over the average lifespan, humans sleep for about 1/3 of their lives. Feeling terrible after a night without sleep is the body’s way of reminding us that sleeping is a necessity such as eating, drinking and breathing. As we sleep, our body repairs itself. This rejuvenation goes for hormones and muscles as well as neural responses, like memory. Without sleeping, we simply do not function as well as we can. A sleeping disorder is when one cannot sleep, causing the body to lose function. Just as the body’s benefits of rest can range from physical to emotional and psychological effects, lack of sleep can damage the body physically, emotionally and psychologically. Till date, 84 kinds of sleep disorders have been discovered, including the most common ones such as insomnia, sleep apnea, narcolepsy and restless leg syndrome [1]. Sleep apnea (SA) is the instance when one either has pauses of breathing in their sleep, or has very low breath while asleep. This pause in breathing is known as an apnea, and can range in
frequency and duration. The lack of breathing during sleep is known as a hypopnea [2]. Sleep apnea is classified into two different types. The first type is Obstructive Sleep Apnea (OSA), which is more common, occurring in 2% to 4% of middle-aged adults and 1% to 3% of preschool children [3], and is generally caused by a collapse of the upper respiratory airway. The second one is Central Sleep Apnea (CSA), which is caused by an absent or inhibited respiratory drive. Most cases of CSA are mixed, meaning that it is often along with OSA cases, and the CSA only cases appear exceedingly rarely [4]. Like all sleeping disorders, symptoms of sleep apnea do not occur just during the night. Daytime symptoms can range from excessive sleepiness, impaired concentration, depression, early morning headaches, memory loss and irritability [3]. During the night, symptoms can include nocturnal choking, heavy snoring, sweating, restless sleep, impotence, and witnessed apnea. While (OSA) is not a rare condition, it is most likely for its victims to be middle aged or elderly. Those affected by OSA also tend to be obese [3]. Despite how common it is, most cases go undiagnosed and can be attributed to 70 billion dollars loss, 11.1 billion in damages and 980 deaths each year [5]. Most cases go undiagnosed because of the inconvenience, expenses and unavailability of testing. Testing is inconvenient to the patient because it requires them to spend the night away from their bed causing discomfort. It is expensive because testing is done in the hospital, causing machines and various technicians and staff to work over night. Testing is also widely unavailable due to sleep centers operating at full capacity and those on the waiting list can be untreated for an additional 6 months. The traditional testing process includes a polysomnography (PSG), which is a standard procedure for all sleep disorder diagnosis. It records the breath airflow, respiratory movement, oxygen saturation, body position, electroencephalogram (EEG), electrooculogram (EOG), electromyogram (EMG), and electrocardiogram (ECG) [6]. To summarize, the mere dependency on PSG needs to be taken away from the laboratory for simpler detection and faster treatment. Instead, automated, at-home devices that patients can simply use while asleep seem to be very attractive and highly on-demand.
978-1-4673-0818-2/12/$31.00 ©2012 Crown
B. Contribution Though PSG has been widely used to detect sleep apnea, many other techniques that rely on one biometric (e.g. ECG) have been thoroughly investigated. To identify sleep apnea, we propose a novel methodology in this paper that combines RR-interval based features of the ECG signal based on the two approaches suggested by Chazal et al., and Yilmaz et al. Performance assessment of the combination of these two approaches is done by measuring the classification performance in determining the presence of apnea for different epoch lengths. C. Paper Organization The rest of this paper is organized as follows. In Section II, we glance at a variety of sleep apnea detection methods. Section III contains an overview of the system, including a description of the database of subjects, and details on the analysis methodology of the paper. We describe the steps to determine RR-interval and features extraction for different epoch lengths in the same Section. A detailed clarification on the SVM classifier used in our system is also provided. In Section IV, we detail the results of our system, and then we present a comparison with other SA detection works. Finally, Section V concludes this paper regarding the potential usefulness of our system, and highlights some directions for future research. II.
RELATED WORK
Several methods have been suggested for identification of sleep apnea over the past few years. Statistical features of different signals such as nasal air flow, the thorax and abdomen effort signals, acoustic speech signal, oxygen saturation, electrical activity of the brain (EEG), and electrical activity of the heart (ECG) are commonly used in the detection. Ng et al. [7] showed that thoracic and the abdominal signals were good parameters for the identification of the occurrence of sleep apnea. Using the mean of absolute amplitudes of the thoracic and the abdominal signals, they have achieved a good performance with a receiver operating characteristic value higher than 80%. Depending on the hypothesis that speech signal properties of OSA patients will be different than those not having OSA, Goldshtein et al. [8] developed a gaussian mixture model-based system to classify between the OSA and non-OSA groups. They achieved a specificity and sensitivity of 83% and 79% for the male OSA and 86% and 84% for the female OSA patients, respectively. Their technique relied on vocal tract length and linear prediction coefficients features. The study in [9] assessed analysis of a comprehensive feature set based on blood oxygen saturation (SaO2) from nocturnal oximetry in order to evaluate sleep quality. The three features of SaO2 signal which are delta index, central tendency measure and oxygen desaturation index are evaluated. Central tendency measure accuracy was higher than those provided by delta index and oxygen desaturation index. With central tendency measure the sensitivity was 90.1% and the specificity was 82.9%.
The relationship between periodic changes in the oxygen saturation (SaO2) profile and in the EEG pattern due to apnea events during the night was investigated in [10]. The spectral analysis of these two signals achieved 91% sensitivity, 83.3% specificity and 88.5% accuracy in OSA diagnosis. In [11], the authors analyze various feature sets and a combination of classifiers based on the arterial oxygen saturation signal measured by pulse oximetry (SpO2) and the ECG in order to evaluate sleep quality and detect apnea. With selected features of the SpO2 and ECG signals, the Bagging with REP Tree classifier achieved sensitivity of 79.75%, specificity of 85.89% and overall accuracy of 84.40%. Wavelet transforms and an artificial neural network (ANN) algorithm were applied to the EEG signal in [12] to find a solution to the problem of identifying sleep apnea (SA) episodes. The system's identification results achieved a sensitivity of approximately 69.64% and a specificity of approximately 44.44%. Many studies show that detection of obstructive sleep apnea can be performed through heart rate variability (HRV) and the ECG signal. Quiceno-Manrique et al. [13] proposed a simple diagnostic tool for OSA with a high accuracy (up to 92.67%) using timefrequency distributions and dynamic features in ECG signal. Moreover, based on spectral components of heart rate variability, frequency analysis was performed in [14] using Fourier and Wavelet Transformation with appropriate application of the Hilbert Transform, where the sensitivity was 90.8%. In addition, in [15] a bivariate autoregressive model was used to evaluate beat-by-beat power spectral density of HRV and R peak area, where the classification results showed accuracy higher than 85%. The technique in this work also relies on features of the ECG signal.
III.
METHODOLOGY
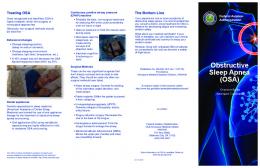
In this work, we focus on the ECG signal features to detect sleep apnea. The block diagram of the overall methodology used in this study is shown in Figure 1. A. Subjects The database of ECG signals used is available from the PhysioNet web site [16]. PhysioNet contains a growing collection of biomedical signals from healthy subjects and patients. The PhysioNet web site is a public service of the PhysioNet Resource funded by the National Institutes of Health's NIBIB and NIGMS. PhysioNet offers free access to Apnea-ECG Database, which we used to assess and validate our approach. The ApneaECG Database contains 70 recordings, containing a single ECG signal varying in length from slightly less than 7 hours to nearly 10 hours each. The sampling frequency used for ECG acquisition was 100 Hz, with 16-bit resolution, and one sample bit representing 5µV. The standard sleep laboratory ECG electrode positions were used (modified lead V2) [6].
ECG signal
Data Preparation
RR Interval Detection
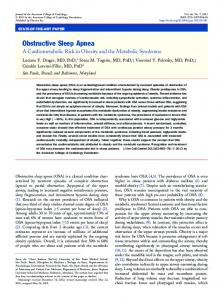
Features Extraction Figure 2. Schematic representation of normal ECG. Data Randomization
SVM
Performance Evaluation
Figure 1. Schematic diagram of the system.
The subjects of these recordings were men and women between 27 and 63 years of age (mean: 43.8±10.8 years) with weights between 53 and 135 kg (mean: 86.3±22.2 kg). The sleep recordings originated from 32 subjects (25 men, 7 female) those who were recruited for previous studies on healthy volunteers, and also patients with obstructive sleep apnea [6]. B. ECG The electrocardiogram is a representation of the electrical activity of the heart; each activity has a distinctive waveform. Normal ECG graph consists of the P wave, QRS complex and the T wave. A small U wave is normally visible in 50-75% in the ECG [17]. Figure 2 shows a schematic representation of normal ECG. ECG is considered as one of the most efficient features to detect sleep disorders. Cyclic variations in the duration of a heartbeat, also known as RR intervals (time interval from one R wave to next R wave) of ECG have been reported to be associated with sleep apnea episodes. This consists of bradycardia during apnea followed by tachycardia upon its cessation [6]. According to [17], RR interval time series is generated for each ECG beat, as follows:
rr ( i ) = r ( i + 1) − r (i ),
i = 1, 2 ,..., n − 1 . (1)
RR-interval is defined as the time interval between two consecutive R peaks.
Several researches have been conducted to recognize sleep apnea using the features derived from the RR interval such as median, mean, inter-quartile range (IQR), and the standard deviation of the change in RR intervals [6][17][18]. C. Data Preparation To select the data, we chose the ECG records which have continuous apnea data for a certain period of time, followed by a regular (normal) data representation for a period of time, or vice versa. The data preparation is used for training the SVM classifier (see subsection III.G). To give more clarification about data preparation in our work, an example is provided regarding the data selection. In data set1 of record a03, to get regular data, we chose the data from 2:27:00.000 to 2:57:00.000, and to get apnea data, we chose the data from 3:06:00.000 to 3:36:00.000. The reason of choosing those periods was because the data at those periods have clear apnea and regular data. In data set2 of record b02, to get apnea data, we chose apnea data from 1:17:00.000 to 1:37:00.000, and to get regular data, we chose regular data from 1:57:00.000 to 2:17:00.000. Similarly, the reason of choosing those periods was because the data at those periods had clear apnea and regular data, and they are within the same hour. MATLAB toolset was used in our experiments for signal processing. The data records were imported as MATLAB matrices (.mat) from the Physionet web site. The next step in our procedure after data selection is data partitioning. In our work, three cases of partitioning were analyzed, as follows: •
Case 1. The apnea and regular data are partitioned into 10 second pieces
•
Case 2. The apnea and regular data are partitioned into 15 second pieces
•
Case 3. The apnea and regular data are partitioned into epochs of 30 second pieces.
Since apnea is defined as a pause in breathing, and can last from a few seconds to minutes (almost >=10 sec); we investigate the three above cases to determine the best accuracy that can be achieved.
• •
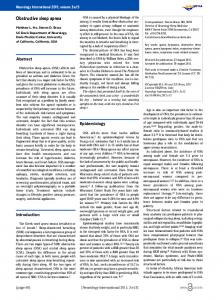
Figure 3. Detection of R- Peak.
D. RR Interval Detection We need to distinguish the R waves from the other waves of the ECG signal. Therefore, we developed the following two conditions, in which R-peak was detected. An R peak will be identified if both conditions 1 and 2 are satisfied: 1) It has to be a local maximum, which is detected by a local max function within a window of 150ms. 2) The local max peaks must be at least 2 standard deviation above the mean. Once the R-peak was determined, RR intervals were computed. The RR interval is the peak to peak time period from two continuous peak signals as shown in Equation 1. Figure 3 shows the detection of R-peaks. E. Features Extraction Our technique relies on an effective combination of ECG signal features which is a novel hybrid of features extracted from [6] and [19]. According to [17], the following ECG features which are most effective for apnea detection are calculated: • Mean epoch and recording RR-interval. • Standard deviation of the epoch and recording RRinterval. • The NN50 measure (variant 1), defined as the number of pairs of adjacent RR- intervals where the first RRinterval exceeds the second RR- interval by more than 50 ms. • The NN50 measure (variant 2), defined as the number of pairs of adjacent RR-intervals where the second RR-interval exceeds the first RR interval by more than 50 ms. • Two pNN50 measures, defined as each NN50 measure divided by the total number of RR-intervals. • The SDSD measures, defined as the standard deviation of the differences between adjacent RRintervals. • The RMSSD measures, defined as the square root of the mean of the sum of the squares of differences between adjacent RR- intervals. • Median of RR-intervals.
Inter-quartile range, defined as difference between th th 75 and 25 percentiles of the RR-interval value distribution. Mean absolute deviation values, defined as mean of absolute values obtained by the subtraction of the mean RR-interval values from all the RR-interval values in an epoch.
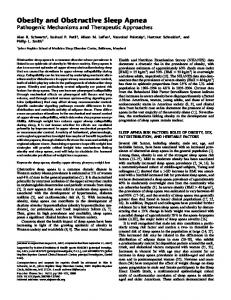
The first seven features are proposed by Chazal et al. [6], while the three latter features are proposed by Yilmaz et al. [19], who claimed that RR interval mean, standard deviation, and range are sensitive to outliers, and thus classification performance deteriorates when only these features are included. Our hybrid technique includes a combination of the most effective set of RR-interval based features of the ECG signal for classification. The classification results confirm the improved accuracy compared to the two above techniques. F. Data Randomization In this step, we separate the apnea and non apnea data. We then separate training data and testing data, with 80% for the training and 20% for the testing. We use a MATLAB built-in function (rand) to determine whether a feature set in 10s (or 15s or 30s) of data belongs to test group or rule creation group. If ‘rand’ is larger than 0.2, then the 10s data will belong to rule creation group, otherwise it will belong to testing group. After the signals are separated, we perform the training for SVM. G. Support Vector Machines We use Support Vector Machines (SVMs) as a classification (also known as supervised learning) method in order to investigate apneaic epoch detection. SVMs are learning methods, which aim to find the optimal separating plane that analyze data and recognize pattern used for regression analysis. In SVM, P data is classified to which class it belongs, by points with a (P − 1) dimensional hyperplane, which is called a linear classifier. The optimal hyperplane that separates the clusters of vectors is found by SVM modeling. The cases with one category of the target variable are on one side of the plane and cases with the other category are on the other side of the plane. Figure 4 illustrates the working principle of SVM. A good separation between the two possible classes is achieved by building a maximal margin hyperplane. The margin maximizes the distance between the classes and the nearest data point of each class. In general, the larger the margin is, the lower the generalization error of the classifier [17]. Figure 5 shows the trade off margin choice. In addition, SVMs handles the separation by a kernel function to map the data into a different space with a hyperplane. SVM gives the flexibility for the choice of the kernel, as shown in Figure 6. Linear, polynomial and radial can be taken as an example for a kernel function.
IV.
RESULTS
A. Performance Evaluation
Features Space
Solution Mapping Input Space
Input Space
Margin
Figure 4. The SVM algorithm.
Small Margin Large Margin
Small Margin
Support Vectors
We evaluated the effectiveness of our model on the ApneaECG database, using different records available in that database. The model was implemented using MATLAB toolset. To evaluate the performance of the classification system, two statistical indicators, Sensitivity (Se) and Specificity (Sp) in addition to the Accuracy (Acc) have been used. The sensitivity of a test is the percentage of patients in the OSA positive group correctly diagnosed, whereas the specificity is the percentage of subjects in the OSA negative group correctly classified by the test. Table I, II and III show the classification results for the three cases mentioned in the data partitioning step. Our model was based on a linear kernel SVM using various RR-interval features of the ECG signal. The three cases used here are: (i) 10 seconds data partitioning, (ii) 15 seconds, and (iii) 30 seconds. The accuracy of our approach is 86.1%, 96.5%, and 95%, respectively. From Table II, SVM with linear kernel using 15 second epochs shows the best classification accuracy with high successful rate of correct prediction.
Large Margin
TABLE I 10 sec. (Accuracy is 86.1%) Figure 5. Trade off margin choice.
Input\Output
Regular
Apnea
Regular
97.2%
2.78%
Apnea
25%
75%
TABLE II 15 sec. (Accuracy is 96.5%)
Figure 6. Kernal choice.
The choice of a kernel depends on the problem we are trying to model. Polynomial kernels are well suited for problems where all the training data is normalized, and it allows to model feature conjunctions up to the order of the polynomial. Radial basis functions allow picking out circles (or hyperplanes). In contrast, the linear kernel, allows only picking out lines (or hyperplanes) [20]. In our implementation, we use a linear kernel function to map the training data into kernel space. In the optimization process, we use a method called sequential minimal optimization to find the separating hyperplane.
Input\Output
Regular
Apnea
Regular
100%
0%
Apnea
7.1%
92.9%
TABLE III 30 sec. (Accuracy is 95%) Input\Output
Regular
Apnea
Regular
100%
0%
Apnea
10%
90%
B. Comparison with other techniques We performed a comparison with other SA detection works. Table IV represents comparative results. As can be seen, our system has achieved a comparable or better performance. This applies to the other works that rely on the ECG signal as well as other biometric signals.
[5]
TABLE IV Comparison of Sleep Apnea Detection Approaches Method
Ref.
Approach
Se
Performance [%] Sp Acc.
NA
NA
91
90.1
82.9
NA
Chazal et al.
[6]
Alvarez et al.
[9]
Measure of minutes of sleep disordered respiration SaO2
Alvarez et al.
[10]
SaO2 and EEG signal
91
83.3
88.5
Xie et al.
[11]
SpO2 and ECG
79.75
85.89
84.40
Lin et al.
[12]
EEG signal
69.64
44.44
NA
QuicenoManrique et al.
[13]
ECG signal
NA
NA
92.67
Schrader et al.
[14]
Fourier and Wavelet Transformation of HRV
90.8
NA
NA
Mendez et al.
[15]
Bivariate autoregressive model of HRV
NA
NA
85
Yilmaz et al.
[19]
RR-interval based classification
NA
NA
89
-
Features extraction of ECG signal
92.9
100
96.5
Proposed
V.
CONCLUSIONS AND FUTURE WORKS
In this work, we studied the possibility of the detection of sleep apnea or hypopnea events from the ECG signal variation patterns during sleep. We further developed a model using the ECG signal features and evaluated its effectiveness. Our model was based on a selective set of RR-interval-based features that were given to an SVM for classification. We evaluated our model on three different epoch lengths. From the experimental results, we conclude that SVM with linear kernel shows the best accuracy with 15 second epoch length. As a future work, we plan to do performance optimization for feature selection, and then incorporate this work into a realtime monitoring system that acquires and analyzes the ECG signal of subjects during sleep. REFERENCES [1] [2]
[3] [4]
Sleep Disorder Overview. www.neurologychannel.com. S. Isa, M. Fanany, W. Jatmiko and A. Arymurthy, “Sleep Apnea Detection from ECG Signal, Analysis on Optimal Features, Principal Components, and Nonlinearity,” in Proceedings of the 5th IEEE International Conference on Bioinformatics and Biomedical Engineering (iCBBE), pp. 1-4, May 2011. Sleep Apnea: What Is Sleep Apnea? www.nhlbi.nih.gov. Apnea guide. www.apneaguide.com.
Treating Sleep Apnea Could Cut Road Deaths. www.americanvoiceinstitute.org. [6] P. Chazal, T. Penzel and C. Heneghan,“Automated Detection of Obstructive Sleep Apnoeaa at Different Time Scales Using the Electrocardiogram,” Institute of Physics Publishing, vol. 25, no. 4, pp. 967-983, Aug. 2004. [7] A. Ng, J. Chung, M. Gohel, W. Yu, K. Fan and T. Wong, “Evaluation of the Performance of Using Mean Absolute Amplitude Analysis of Thoracic and Abdominal Signals for Immediate Indication of Sleep Apnoea Events,” Journal of Clinical Nursing, vol. 17, no. 17, pp. 23602366, Sep. 2008. [8] E. Goldshtein, A. Tarasiuk and Y. Zigel, “Automatic Detection of Obstructive Sleep Apnea Using Speech Signals,” in IEEE Transactions on Biomedical Engineering, vol. 58, no. 5, pp. 1373-1382, May. 2011. [9] D. Alvarez, R. Hornero, D. Abasolo, F. Campo and C. Zamarron, “Nonlinear Characteristics of Blood Oxygen Saturation from Nocturnal Oximetry for Obstructive Sleep Apnoea Detection,” Institute of Physics Publishing, vol. 27, no. 4, pp. 399-412, Apr. 2006. [10] D. Avarez, R. Hornero, J. Marcos, F. Campo and M. Lopez, “Spectral Analysis of Electroencephalogram and Oximetric Signals in Obstructive Sleep Apnea Diagnosis,” in Proceedings of the 31st IEEE International Conference on Engineering in Medicine and Biology Society (EMBS 2009), pp. 400-403, Sep. 2009. [11] B. Xie, H. Minn, “Real Time Sleep Apnea Detection by Classifier Combination,” in IEEE Transactions on Information Technology in Biomedicine (in Press), 2012. [12] R. Lin, R. Lee, C. Tseng, H. Zhou, C. Chao, J. Jiang,“A New Approach for Identifying Sleep Apnea Syndrome Using Wavelet Transform and Neural Networks,” Biomedical Engineering: Applications, Basis & Communications, vol. 18, no. 3, pp. 138-143, 2006. [13] Q. Manrique, A. Hernandez, T. Gonzalez, F. Pallester and C. Dominquez, “ Detection of Obstructive Sleep Apnea in ECG Recordings Using Time-Frequency Distributions and Dynamic Features,” in Proceedings of the IEEE International Conference on Engineering in Medicine and Biology Society( EMBS 2009), pp. 5559-5562, Sep. 2009. [14] M. Schrader, C. Zywietz, V. Einem, B. Widiger, G. Joseph, “Detection of Sleep Apnea in Single Channel ECGs from the PhysioNet Data Base,” Computers in Cardiology 2000, vol. 27, pp. 263-266, Sep. 2000. [15] M. Mendez, D. Ruini, O. Villantieri, M. Matteucci, T. Penzel and A. Bianchi, “Detection of Sleep Apnea from Surface ECG Based on Features Extracted by an Autoregressive Model, ” in Proceedings of the IEEE International Conference on Engineering in Medicine and Biology Society (EMBS 2007), pp. 6105-6108, Aug. 2007. [16] PhysioNet, www.physionet.org. [17] S. Isa, M. Fanany, W. Jatmiko and A. Murini, “Feature and Model Selection on Automatic Sleep Apnea Detection Using ECG,” in International Conference on ComputerScience and Information Systems, ICACSIS 2010, pp. 357-362, 2010. [18] P. Langley, E. Bowers and A. Murray, “Principal Component Analysis as Tool for Analyzing Beat-to-Beat Changes in ECG Features: Application To ECG-Derived Respiration,” in IEEE Transactions on Biomedical Engineering, vol. 57, no. 4, pp. 821-829, Apr. 2010. [19] B. Yilmaz, M. Asyali, E. Arikan, S. Yektin and F. Ozgen, “Sleep Stage and Obstructive Apneaic Epoch Classification Using Single-Lead ECG,” in Biomedical Engineering Online, vol. 9, 2010. [20] A. Jain, P. Flynn and A. Ross, “Handbook of Biometrics,” Springer, New York, 2008.