Süleyman Demirel University Süleyman Demirel Üniversitesi Ö. TürkşenEnstitüsü / A Fuzzy Modeling Descriptive Statistics andApplied Golden Ratio Journal of Natural and Sciences Fen Bilimleri Dergisi Approach for Replicated Response Measures Based on Fuzzification of Replications with Volume **, Issue *, **-**, 20** Cilt **, Sayı *, **-**, 20**
DOI: 10.19113/sdufbed.89217
A Fuzzy Modeling Approach for Replicated Response Measures Based on Fuzzification of Replications with Descriptive Statistics and Golden Ratio Özlem TÜRKŞEN*1 1Ankara
University, Faculty of Science, Department of Statistics, 06100, Ankara
(Alınış / Received: 16.10.2017, Kabul / Accepted: 09.02.2018, Online Yayınlanma / Published Online: 23.03.2018)
Keywords Replicated response measures, Fuzzy least squares, Triangular type-1 fuzzy numbers, Golden ratio
Abstract: Some of the experimental designs can be composed of replicated response measures in which the replications cannot be identified exactly and may have uncertainty different than randomness. Then, the classical regression analysis may not be proper to model the designed data because of the violation of probabilistic modeling assumptions. In this case, fuzzy regression analysis can be used as a modeling tool. In this study, the replicated response values are newly formed to fuzzy numbers by using descriptive statistics of replications and golden ratio. The main aim of the study is obtaining the most suitable fuzzy model for replicated response measures through fuzzification of the replicated values by taking into account the data structure of the replications in statistical framework. Here, the response and unknown model coefficients are considered as triangular type-1 fuzzy numbers (TT1FNs) whereas the inputs are crisp. Predicted fuzzy models are obtained according to the proposed fuzzification rules by using Fuzzy Least Squares (FLS) approach. The performances of the predicted fuzzy models are compared by using Root Mean Squared Error (RMSE) criteria. A data set from the literature, called wheel cover component data set, is used to illustrate the performance of the proposed approach and the obtained results are discussed. The calculation results show that the combined formulation of the descriptive statistics and the golden ratio is the most preferable fuzzification rule according to the wellknown decision making method, called TOPSIS, for the data set.
Tekrarlı Yanıt Ölçümleri İçin Tekrarların Betimsel İstatistikler ve Altın Oran ile Bulanıklaştırılmasına Dayalı Oluşturulan Bir Bulanık Modelleme Yaklaşımı Anahtar Kelimeler Tekrarlı yanıt ölçümleri, Bulanık en küçük kareler, Üçgensel tip-1 bulanık sayılar, Altın oran
Özet: Bazı deneysel tasarımlar tekrarlı yanıt ölçümlerini içerebilir. Bu tasarımlarda tekrarlar tam olarak belirlenemeyebilir ve rasgelelikten farklı olarak belirsizlikler içerebilir. Olasılıksal modelleme varsayımlarının sağlanamaması nedeniyle verilerin modellenmesi için klasik regresyon analizi uygun olmayabilir. Bu durumda, bulanık regresyon analizi bir modelleme aracı olarak kullanılabilir. Bu çalışmada, tekrarlı yanıt değerleri, tekrarlara ilişkin betimsel istatistiklerin ve altın oranın kullanılması ile yeni bir formda bulanık sayılara dönüştürülmüştür. Çalışmanın temel amacı, tekrarlı değerlerin bulanıklaştırılmasında tekrarların yapısını istatistiksel anlamda dikkate alarak, veri seti için en uygun bulanık modelin elde edilmesini sağlamaktır. Burada, yanıt ve bilinmeyen model katsayıları üçgensel tip-1 bulanık sayılar, girdi değişkenleri kesin değerler olarak ele alınmıştır. Tahmini bulanık modeller, önerilen bulanıklaştırma kurallarına göre bulanık en küçük kareler yaklaşımı kullanılarak elde edilmiştir. Tahmini bulanık modellerin performansları hata kareler ortalamasının karekökü (RMSE) kriteri kullanılarak karşılaştırılmıştır. Literatürde tanımlı bir veri seti üzerinde önerilen yaklaşım uygulanarak elde edilen sonuçlar değerlendirilmiştir. Elde edilen sonuçlar, betimsel istatistikler ve altın oran ile oluşturulan formülasyonun, oldukça iyi bilinen bir karar verme yöntemi olan TOPSIS’e göre, ilgilenilen veri seti için en çok tercih edilen bulanıklaştırma kuralı olduğunu gösterir.
* Corresponding author:
[email protected]
1
Ö. Türkşen / A Fuzzy Modeling Approach for Replicated Response Measures Based on Fuzzification of Replications with Descriptive Statistics and Golden Ratio
1. Introduction
Comparison of modeling approaches are evaluated by interval arithmetic metrics. In these papers, replicated response measures are transformed to a fuzzy number by using descriptive statistics for each observation unit. In fact, the replicated measures cannot be quantified exactly. Besides, replicated values are different from each other which cause uncertainty different than randomness. Therefore, the natural structure of replicated measures should be taken into account to represent the uncertainty of replicated values properly.
Statistical regression analysis is the most important tool used by researchers for modeling of the relationship among the response and input variables, and also important for making predictions with minimum error. However, in many real life problems, classical regression analysis cannot be used for model building phase properly due to violation of probabilistic modeling assumptions, which are necessary for statistical inference through ANOVA techniques, e.g. data set has small size, or the errors are not normally distributed, or the relationship between response and input variables has imprecision, or there is uncertainty about the variables different than randomness. There are some cases where the response values cannot be identified exactly. One of these cases is that the response may be composed of replicated measures where the qualification of the response has uncertainty. When there is uncertainty about a number it can be modeled as a fuzzy set in which case it is called a fuzzy number, firstly introduced by Zadeh [1].
In this study, data structure of the replicated response measures is taken into account for fuzzification of the replicated measures in order to apply fuzzy modeling from a new perspective. For this purpose, descriptive statistics of the replicated response values are used to form response as TT1FNs. Thus, the uncertainty of the replicated response measures is defined according to the character of the replications in statistical manner. Also, in the study, golden ratio, derived from Fibonacci series, is combined with descriptive statistics and it is used to transform replications to the TT1FNs. The main purpose of the study is demonstrating the importance of fuzzification of replicated measures for fuzzy modeling of the data set. It is possible to say that using descriptive statistics with golden ratio gives appropriate fuzzification approach for replicated measured data set according to the RMSE criteria. The paper is organized as follows: In Section 2, fuzzification of replicated measures is given in detail with a brief description about FLS regression. In Section 3, a real data set in the literature is used to illustrate the applicability of the proposed fuzzification approach with comparison results. Finally, discussion and conclusion are given in Section 4.
In the literature, the application of fuzzy approach in regression analysis is roughly divided into two categories: (i) Tanaka’s Linear Programming (LP) approach [2], and (ii) Diamond’s Fuzzy Least Squares (FLS) approach [3]. Later on, many studies have been done about fuzzy linear regression and its application. A detailed review on fuzzy regression can be found in [4]. In recent years, some studies have been carried out about modeling of replicated response measures in fuzzy framework. Bashiri and Hosseininezhad [5] is proposed a methodology for optimizing multi response surface in robust design by applying fuzzy set theory and replicated response measured data set is used to illustrate the proposed methodology. And also, Bashiri and Hosseininezhad [6] is developed an approach to multiple response optimization for responses without replicates and with some replicates based on fuzzy concept. Türkşen and Apaydın [7] proposed a modeling approach based on FLS method by using triangular type-1 fuzzy numbers (TT1FNs) for multi response experiments with replicated response measures. Türkşen and Güler [8] applied fuzzy logic based modeling approaches, e.g. FLS Regression, Switching Fuzzy CRegression (SFCR), and Takagi-Sugeno (TS) fuzzy model, on replicated response measured data set and calculated prediction performance of modeling approaches. It is seen that the SFCR gives the better prediction performance according to the root mean square error (RMSE) criteria. Türkşen and Kocadağlı [9] applied triangular type-2 fuzzy numbers for representation of replicated response measures as fuzzy numbers. And also, FLSR is used for estimating of fuzzy model coefficients. Türkşen [10] used Bayesian and fuzzy approaches to model the data sets with replicated response measures.
2. Material and Method 2.1. Design of replicated measures In modeling stage of an unknown response, the first basic step is data gathering and proper design of experimental data. Sometimes, the design of the data may be composed by using the replicated measures of the response as given in Table 1. Table 1. Experimental design for an experimental data set with replicated response measures Response
X1
1
x11
x12
…
x1p
y11
y12
…
y1r
2
x 21
x 22
…
x 2p
y21
y22
…
y2r
. . .
. . . xn1
. . . xn2
…
. . .
…
xnp
. . . yn1
. . . yn1
n
2
Input levels … X2 Xp
No
Y
… …
yn1
Ö. Türkşen / A Fuzzy Modeling Approach for Replicated Response Measures Based on Fuzzification of Replications with Descriptive Statistics and Golden Ratio
a1 , a2 , a3 , 0 a3 , a2 , a1 , 0
In Table 1, n denotes the number of experimental units and r is the number of replications for the response. It should be noted that each replication is measured for each setting of a group of p input variables. One of the main aim for the experimental data set, designed in Table 1, is modeling of the data set as a function of input variables and replicated response measures. In order to model the replicated data set properly, the uncertainty of the nature of the replicated response measures should be taken into account. For this purpose, in this study, TT1FNs are used to represent vagueness of the replicated response values.
A
2.3. Fuzzification measures
Y1 Y11 Y Y 2 21 Y . . . . . . Yn Yn1
A type-1 fuzzy set A is a set function on universe DA into [0,1], e.g. A : X [0,1] . The membership in which
0 A x 1 [11].
... Y1r ... Y2r . ... . . ... Ynr
l c u Y1 Y1 ,Y1 ,Y1 l c u Y2 Y2 ,Y2 ,Y2 . Y . . . . . Y l c u n Yn ,Yn ,Yn
When the uncertainty is modeled using a type-1 fuzzy set it is called a type-1 fuzzy number. Let A be a fuzzy set in R. A is called a type-1 fuzzy number if: (i) A is normal, (ii) A is convex, and (iii) A has a bounded support [11].
The MF formula for TT1FN is given below x a1 / a2 a1 , a1 x a2 A x a3 x / a3 a2 , a2 x a3 0 , x a3 or x a1
Y12 Y22 . . . Yn2
(2)
where n denotes the number of units and r denotes number of replications for each unit. The triangular fuzzy values of the each unit is given as
function (MF) of A is denoted A x and is called a
response
Let the matrix of observed replicated response measures be
One of the most useful representation of fuzziness is defining a membership function for the data set. The shape of membership function, e.g. triangular, trapezoidal, Gaussian, helps to classify the fuzzy numbers. In this study, TT1FNs are preferred to use due to easiness of mathematical calculations.
replicated
In order to apply fuzzy modeling approach to replicated data set, the replicated response measures should be represented as fuzzy numbers. For this purpose, in this study, replicated measures are transformed to the TT1FNs through the descriptive statistics and the golden ratio. The proposed fuzzification rules are given in detailed.
2.2. Triangular type-1 fuzzy numbers (TT1FNs) and some basic operators
type-1 MF, e.g. A x , A x : x X
of
.
(3)
Thus, the fuzzy responses Yi (Yi l ,Yic ,Yiu ) , i=1,2,…,n, are obtained by using different fuzzification rules for each unit as shown below:
(1)
Rule-1:
where the A can be denoted as A a1 , a2 , a3 . The
Yi l Yi . 2stddev Yij
basic arithmetic operators for TT1FNs are defined in many studies due to wide range of usage of TT1FNs. Here, some elementary operations are given basicly.
Yic Yi . , i = 1,2,…,n , j=1,2,…,r Yiu Yi . 2stddev Yij where Yi .
Let A a1 , a2 , a3 and B b1 , b2 , b3 be two TT1FNs.
r
Y
j 1 ij
r
Y and stddev(Y ) r
j 1
ij
ij
(4)
Yi .
r 1
2
.
It should be noted here that the Yi . , i = 1,2,…,n, is the mean of observed replicated response measures for each unit and 2 stddev is assumed as the spread for fuzzification of the replicated response measures to obtain an interval similar as a 95% confidence interval.
Addition: A B a1 b1 , a2 b2 , a3 b3 Subtraction: A B a1 b3 , a2 b2 , a3 b1 Multiplication: A B a1b1 , a2b2 , a3b3 Scalar Multiplication: Let be a scalar.
3
Ö. Türkşen / A Fuzzy Modeling Approach for Replicated Response Measures Based on Fuzzification of Replications with Descriptive Statistics and Golden Ratio
Rule-2:
2.4. Fuzzy least squares regression
Yi l Yi (1) Yi c Yi . , i = 1,2,…,n , j=1,2,…,r Yiu Yi ( r )
A general form of the fuzzy linear regression model, used in this study, can be given as
(5)
Y Xβ ε
where Yi(1) and Yi( r ) are the smallest and the largest
where the observed response values, model coefficients and errors are assumed as TT1FNs, denoted as Y Y1 Y2 ... Yn , β βl ,βc ,βu , and ε ε l , ε c , εu , respectively. Here, the inputs are
order statistics for each unit. Rule-3:
Yi l Yi(1)
Yic med Yij , i = 1,2,…,n , j=1,2,…,r
considered as crisp values. In order to estimate the unknown fuzzy model parameters, FLS method is used. The FLS aims to obtain fuzzy parameter estimates by minimizing the sum of the squared distance between observed and predicted fuzzy response values, formalized as
(6)
Yiu Yi( r )
in which med Yij represents the median of the replicated response measures for each unit.
ˆ min β min d 2 Y , Y β β
Rule-4:
Yi l Yi(1) Yic Yi(1) Ri , i = 1,2,…,n Yiu Yi( r )
(9)
(10)
where Yˆ represents predicted triangular fuzzy response values. In this case, vertex method, proposed by Diamond [3], can be used to calculate the distance between Y and Yˆ as following
(7)
where Ri is called as the range and is obtained by substracting the smallest observation from the largest observation for each unit, i.e. Ri Yi(r ) Yi(1) ,
1 ˆ d 2 Y , Y Y l Yˆ l 3
i = 1,2,…,n. Here, is the golden ratio and taken equal to 0.618. The golden ratio, also sometimes called golden section, golden mean, golden number, divine proportion, divine section, golden proportion, is the limit of consecutive Fibonacci numbers, detailed information can be seen in Dunlap [12], that is
It is clear that Equation (11) gives sum of squared errors. The root mean of sum of squared error terms, RMSE, is preferred to use as a criteria to evaluate the prediction performances of the fuzzy regression models whose response values are composed with the proposed five fuzzification rules of the replicated response measures.
Y 2
c
Yˆ c
Y 2
u
Yˆ u
(11) 2
3. Results
F 1 5 lim n1 1.618 , n F 2 n
In this section, a well-known data set, wheel cover component data set, is chosen from the literature. It is originally given in Harper et al. [13]. The purpose of the data set is to determine the effects of seven injection molding input variables (denoted as X1 , X2 ,..., X7 ) on the equality characteristics of the component which are considered as responses. These are measured by the total weight and the balance which are denoted as Y1 (in grams) and Y2 (in inch-ounces). Throughout the work, it is assumed that the responses are uncorrelated. The experiment was conducted in a 27-4 fractional factorial design with five replications in each unit. The two levels of each input variables X ij , i =
and
Fn 0.618 . n F n1
lim Rule-5:
Yi l Yi(1) Yic Yi(1) IQRi , i = 1,2,…,n Yiu Yi( r )
(8)
1,2,…,8, j=1,2,…,7 are coded as -1 and +1 [8]. The experimental data set is given in Table 2. The boxplots of the replicated response measures for each
in which IQRi is interquartile range of replicated response measures for each unit.
4
Ö. Türkşen / A Fuzzy Modeling Approach for Replicated Response Measures Based on Fuzzification of Replications with Descriptive Statistics and Golden Ratio
Table 2. The wheel cover component data set Input levels
Responses
No
X1
X2
X3
X4
X5
X6
X7
1 2 3 4 5 6 7 8
-1 -1 -1 -1 +1 +1 +1 +1
-1 -1 +1 +1 -1 -1 +1 +1
-1 -1 +1 +1 +1 +1 -1 -1
-1 +1 -1 +1 -1 +1 -1 +1
-1 +1 -1 +1 +1 -1 +1 -1
-1 +1 +1 -1 -1 +1 +1 -1
-1 +1 +1 -1 +1 -1 -1 +1
Rep. 1 711.9 725 711.6 733.7 725.4 728.1 726.6 714.3
Y1 Rep. 3 712.3 711.8 711.3 732 722.6 722.9 731.4 713.6
Rep. 2 713.4 720.1 711.7 724.1 721.6 721.1 731.4 714.4
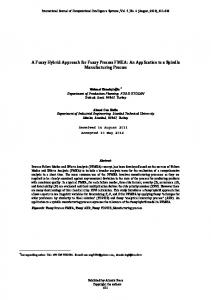
unit are given in Figure 1 and Figure 2 for the first and the second responses, repectively.
Rep. 4 712.4 723.9 712.1 732.7 723.1 723 729.6 716.3
Rep. 5 711.9 720.9 711.7 733.3 721.1 719.7 731.3 714.6
Rep. 1 0.59 0.70 0.56 1.5 1.25 1.17 1.52 0.57
Rep. 2 0.59 0.91 0.44 1.55 1.36 0.97 1.58 0.51
Y2 Rep. 3 0.47 1.13 0.46 1.38 1.51 0.98 1.61 0.44
Rep. 4 0.71 0.79 0.53 1.45 1.22 0.98 1.40 0.44
Rep. 5 0.63 0.78 0.46 1.45 1.25 0.73 1.57 0.56
and ˆ Y2 0.8475,1.0043,1.1013 0.02,0.1085,0.2338 X1 0.0313,0.0958,0.2225 X3 0.2112,0.3406,0.465 X5 0.28, 0.1545, 0.0262 X7
It is clear to say from Figures 1-2 that the replicated response measures are not symmetrically distributed. The replications have skewed distribution. Therefore, R, IQR and med values of replications will provide more information to construct triangular fuzzy response values. The data sets with the fuzzy response values, composed according to the five fuzzification rules, are given in Table 3. Predicted fuzzy model parameters are obtained by minimizing the objective function, given in Equation (10), according to the each fuzzification rule. The RMSE values are calculated for each predicted fuzzy responses, Yˆ 1 and Yˆ 2 , and presented in Table 3.
1.6
1.4
1.2
1
0.8
0.6
0.4 1
2
3
4
5
6
7
8
Figure 2. Box-plots of the replications of the second response for each unit
735
730
If someone wants to use the same fuzzification rule for both responses, a compromise fuzzification rule must be chosen among the proposed five rules. In this case, a multi criteria decision making (MCDM) approach should be applied to the RMSE values, given in Table 3. For this purpose, a MCDM approach, TOPSIS method, presented in [14], is preferred to use. Here, the fuzzification rules and responses are considered as alternatives and criteria, respectively. The working principle of the TOPSIS is that the chosen compromise solution among the alternative solutions should have the shortest distance from the positive ideal solution and the farthest distance from the negative ideal solution. By assuming that the both responses have equal importance, relative closeness vector of the fuzzification rules with respect to positive ideal solution is
725
720
715
1
2
3
4
5
6
7
8
Figure 1. Box-plots of the replications of the first response for each unit It can be easily seen from Table 3 that the smallest RMSE values of Yˆ 1 and Yˆ 2 are 13.9738 and 0.4177 which are related to Rule-5 and Rule-4, respectively. The common trait of the Rules 4-5 is that both rules are composed with variation of replicated response measures, e.g. R, IQR. The predicted fuzzy response models, which have the smallest RMSE values, are given below:
C C1 C2 C3 C4 C5 0 0.9979 0.9957 1 0.9931 .
It is clear from C i , i = 1, 2, …, n, values that the Rule4 is chosen as a compromise fuzzification rule. Thus, one can use fourth rule for transforming replicated response measures to triangular fuzzy responses for wheel cover component data set.
ˆ Y1 717.5125,721.0119,723.175 0.4,2.359,5.2625 X1 2.0375,0.6536,3.625 X 2 1.2375,1.607,4.425 X3 1.6375,1.5256,4.025 X 4 1.7125,4.8166,7.375 X5 6.1, 3.3174, 0.4375 X7
5
Ö. Türkşen / A Fuzzy Modeling Approach for Replicated Response Measures Based on Fuzzification of Replications with Descriptive Statistics and Golden Ratio
Table 3. Observed fuzzy response values composed according to fuzzification rules Observed fuzzy response values Fuzzification Rules
Rule-1
Rule-2
Rule-3
Rule-4
Rule-5
Ỹ1 711.152 709.9625 711.1073 723.163 719.4116 716.5951 725.8992 712.637 711.9 711.8 711.3 724.1 721.1 719.7 726.6 713.6 711.9 711.8 711.3 724.1 721.1 719.7 726.6 713.6 711.9 711.8 711.3 724.1 721.1 719.7 726.6 713.6 711.9 711.8 711.3 724.1 721.1 719.7 726.6 713.6
712.38 720.34 711.68 731.16 722.76 722.96 730.06 714.64 712.38 720.34 711.68 731.16 722.76 722.96 730.06 714.64 712.3 720.9 711.7 732.7 722.6 722.9 731.3 714.4 712.827 719.9576 711.7944 730.0328 723.7574 724.8912 729.5664 715.2686 712.3635 715.6007 711.4699 726.1857 722.4596 721.8785 728.1759 714.1562
RMSE
ˆ Y1
Ỹ2 713.608 730.7175 712.2527 739.157 726.1084 729.3249 734.2208 716.643 713.4 725 712.1 733.7 725.4 728.1 731.4 716.3 713.4 725 712.1 733.7 725.4 728.1 731.4 716.3 713.4 725 712.1 733.7 725.4 728.1 731.4 716.3 713.4 725 712.1 733.7 725.4 728.1 731.4 716.3
0.4246 0.5269 0.3861 1.339 1.0783 0.6534 1.3707 0.3786 0.47 0.7 0.44 1.38 1.22 0.73 1.4 0.44 0.47 0.7 0.44 1.38 1.22 0.73 1.4 0.44 0.47 0.7 0.44 1.38 1.22 0.73 1.4 0.44 0.47 0.7 0.44 1.38 1.22 0.73 1.4 0.44
4. Discussion and Conclusion
0.598 0.862 0.49 1.466 1.318 0.966 1.536 0.504 0.598 0.862 0.49 1.466 1.318 0.966 1.536 0.504 0.59 0.79 0.46 1.45 1.25 0.98 1.57 0.51 0.6183 0.9657 0.5142 1.4851 1.3992 1.0019 1.5298 0.5203 0.5256 0.8267 0.491 1.4294 1.3158 0.8026 1.4603 0.5157
0.7714 1.1971 0.5939 1.593 1.5577 1.2786 1.7013 0.6294 0.71 1.13 0.56 1.55 1.51 1.17 1.61 0.57 0.71 1.13 0.56 1.55 1.51 1.17 1.61 0.57 0.71 1.13 0.56 1.55 1.51 1.17 1.61 0.57 0.71 1.13 0.56 1.55 1.51 1.17 1.61 0.57
ˆ Y2
22.2414
0.6506
13.9762
0.4182
13.9774
0.4187
13.9766
0.4177
13.9738
0.4193
fuzzified by using fuzzification rules. Calculation results show that the compromise fuzzification rule, decided through the TOPSIS method, is obtained by combining descriptive statistics and golden ratio for the wheel cover component data set.
In this study, fuzzy regression analysis based on FLS approach, is used for modeling of the replicated response measured data set. In order to apply fuzzy modeling, replicated response measures are transformed to TT1FNs by using newly proposed fuzzification rules, based on descriptive statistics and golden ratio. In the present study, the uncertainty of the replicated response measures is handled in fuzzy framework by taking into account to the data structure of replications via statistical data mining. Proposed rules for fuzzification of replicated response measures and fuzzy modeling approach are demonstrated on a real experimental data set which is defined in the literature. The RMSE values of predicted fuzzy responses are calculated for prediction performances of the predicted fuzzy models in which the observed responses are
References [1] Zadeh, L.A. 1965. Fuzzy sets. Information Control, 338-353. [2] Tanaka, H., Uejima, S., Asai, K. 1982. Linear Regression Analysis With Fuzzy Model. IEEE Transactions On Systems, Man, And Cybernetics, 12(6), 903-907. [3] Diamond, P. 1988. Fuzzy least squares. Information Sciences, 46, 141-157.
6
Ö. Türkşen / A Fuzzy Modeling Approach for Replicated Response Measures Based on Fuzzification of Replications with Descriptive Statistics and Golden Ratio
[4] Ubale, A.B., Sananse, S. L. 2015. Fuzzy Regression Model and Its Application: A Review. International Journal of Innovative Research in Science, Engineering and Technology, 4(11), 10853-10860.
Using Type-2 Fuzzy Numbers. The 4th International Fuzzy Systems Symposium Proceedings Book, 5-6 November 2015, 464468.
[5] Bashiri, M., Hosseininezhad, S.J. 2009. A Fuzzy Programming for Optimizing Multi Response Surface in Robust Designs. Journal of Uncertain Systems, 3(3), 163-173.
[10] Türkşen, Ö. 2016. Analysis of Response Surface Model Parameters with Bayesian Approach and Fuzzy Approach. International Journal of Uncertainty, Fuzziness and Knowledge-Based Systems, 24(1), 109−122.
[6] Bashiri, M., Hosseininezhad, S.J. 2012. Fuzzy Development of Multiple Response Optimization. Group Decision and Negotiation, 21(3), 417-438.
[11] Mendel, J.M. 2017. Type-1 Fuzzy Sets and Fuzzy Logic. Uncertain Rule-Based Fuzzy Systems, Springer International Publishing AG, 25-99.
[7] Türkşen, Ö., Apaydın, A. 2014. A Modeling Approach Based on Fuzzy Least Squares Method for Multi-Response Experiments with Replicated Measures. Chaos, Complexity and Leadership 2012 Springer Proceedings in Complexity, Springer Netherlands, 153-158.
[12] Dunlap, R.A. 1997. The Golden Ratio and Fibonacci Numbers. World Scientific Publishing, London. 157s. [13] Harper, D., Kosbe, M., Peyton, L. 1987. Optimization of Ford Taurus Wheel Cover Balance. Fifth Symposium on Taguchi Methods, 527-539.
[8] Türkşen, Ö., Güler, N. 2015. Comparison of fuzzy logic based models for the multiresponse surface problems with replicated response measures. Applied Soft Computing, 37, 887-896.
[14] Chen, S.J., Hwang, C.L. 1992. Fuzzy Multiple
Attribute Decision Making: Methods and Applications. Springer-Verlag, Berlin, 536s.
[9] Türkşen, Ö., Kocadağlı, O. 2015. Fuzzy Modeling for Replicated Response Measures by
7