A Gas Sensor System Coupled to an Artificial Neural Network Capable of Self-Calibration against Ambient Humidity and Temperature Fluctuations Mohammadreza Hajmirzaheydarali*, Ali Hooshiar Zare** *Electronic Materials Laboratory, Electronic Engineering Department, K. N. Toosi University of Technology, Tehran, Iran,
[email protected] ** Electronic Materials Laboratory, Electronic Engineering Department, K. N. Toosi University of Technology, Tehran, Iran,
[email protected]
Abstract: The responses of chemoresistive gas sensors suffer from the fluctuations in the background atmospheric conditions. An appropriate countermeasure is required to identify and compensate these drift-like terms introduced in the responses. Here, chemoresistive gas sensor is considered as a non-linear system. This system is characterized and verified by too many experiments. Relative humidity and temperature of the surrounding atmosphere along with the concentration of target gas are considered as inputs of the system while the resistance of the sensor is the output. A MISO model is considered to simulate the behavior of gas sensor. Resistance of the sensor along with the relative humidity and temperature are the inputs of the model. Target gas concentration is the single output of the model. A large database was created out of the experimental results, i.e. the inputs and outputs of the system in different conditions. The model was simulated by the utilization of an appropriate artificial neural network. The sensor and complimentary software created by artificial neural network could exactly predict the gas concentration in presents of drifting parameters like ambient humidity and temperature.
Keywords: Drift-like terms, chemoresistive gas sensors, calibration, relative humidity, artificial neural network. 1. Introduction Chemoresistive gas sensors and electronic noses are widely used for monitoring the quality of the surrounding atmosphere in industrial or domestic environments [1-3]. The main element in the structure of an electronic nose is an array of different gas sensors, the combined responses of which serve as a fingerprint to identify certain chemicals in a gas mixture [4]. The sensors used are usually of chemoresistive type [5,6] different in structural parameters such as the pallet thickness [7], filtered with different membranes [8] or operated at different temperatures [9,10]. Various pattern recognition algorithms have been utilized for the identification of an unknown target gas by comparing its response pattern with the previously recorded responses [11]. A successful chemical identification would depend on the quality of the sensor array, the generality of the training database and the efficiency of the pattern recognition algorithms utilized. Fluctuations in the background atmospheric conditions can impose substantial errors in the
measurements and, hence, in the results of the subsequent mathematical analysis [12,13]. It has been shown that the responses of chemoresistive gas sensors, for instance, is affected by not only the nature and concentration of the target gas, but is simultaneously affected by the temperature and humidity changes in the surrounding atmosphere. Moreover, the traces of the interfering gases even at low levels can affect the sensors baseline and, hence, nonlinearly modify the acquired responses. These drift-like [14] effects, categorized as measurement errors, cause multidimensional shifts in the recorded response patterns and can hinder the intended gas classification process in the feature space [9,15]. In practice, such pattern aberrations can increase the misclassification probability of a response pattern recorded for an unknown gas by blurring the between-class decision boundaries. Different approaches have been adopted to deal with the measurement errors encountered with sensor responses described above [16,17]. The soft methods employed for the elimination of the above described errors consider the ambient temperature and the ambient humidity as the additional inputs to the sensory system. Different modeling techniques are, then, used to model the system based on the input-output relationships recorded in training experiments. The model is then utilized for the elimination of the drift components from the recorded responses [18]. Here, we are reporting the design and fabrication of a controlled atmosphere chamber which could be utilized for the acquisition of the response data of a gas sensor to different target gases at various predetermined environmental conditions. The results were piled up for the formation of a training database, which was then utilized for compensation of the responses of the sensor for the ambient condition fluctuations.
2.
Experimental
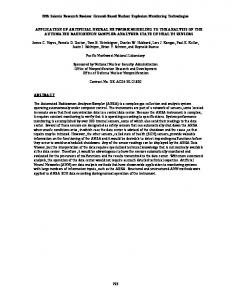
The schematic diagram of the measurement system is presented in Fig.1. It consists of a cylindrical controlled atmosphere chamber equipped with a humidity sensor, a temperature indicator and a general chemoresistive gas sensor. The sensors are connected to a computer via an interface circuit. The heating elements and the purging system, can affect the chamber temperature and humidity. Temperature control is achieved by a PID power control unit connected to the heating elements and to the temperature sensor. The relative humidity in the chamber air is controlled by a flow of controlled mixture of dry and humid air. The system can provide predetermined alcohol vapor concentrations in air at known temperature, in the range of 0-60oC, and relative humidity levels, in the range of 2-95%, within the volume of the chamber. Two small fans mildly circulated the chamber air for homogenization.It took ~20 min for the chamber to acquire a stable atmosphere with constant humidity and temperature. The three parameters were constantly monitored during the measurements.
steady-state resistances at the presence of various combinations of the methanol contamination, chamber humidity and temperature. The sensor used in experiments and modeling is tin oxide gas sensor made by FIS, Japan [19]. Methanol vapor at concentrations ranging from 50 to 2000 ppm was introduced to the chamber as the target gas. Sensor responses to the methanol contaminated atmosphere at different combinations of ambient humidity and temperature were investigated. The results are summarized in fig.3a and b for 28 oC and 43 oC, respectively. Each diagram is related to different methanol concentrations and demonstrates Rgvariations with relative humidity at the stated temperature. The databank was completed with sensor responses at the presence of six different methanol concentrations, each measured at five different ambient temperatures ranging from 23 oC to 43 oC. In all cases the relative humidity varied continuously in the span of 5% to 85%.
A predetermined amount of analytical grade methanol was injected into the chamber after stabilization of the humidity level and temperature in the chamber. Another 15 min was allowed for homogenization of methanol contaminant in the chamber's atmosphere. The steady-state responses of the under test gas were recorded after digitization. The corresponding chamber humidity and temperature were directly read and continuously recorded from the respective standard sensors. The overall accuracy in the measurement of the chamber’s relative humidity and temperature were +/- 3% and +/- 0.5oC, respectively. After the completion of each test, the chamber was purged with the flow of dry air for 20 min. The block diagram of the measurement system is presented in Fig.2. The results of the experiments were piled up to form a databank containing the gas sensor’s
Temp. Sens.
Humid. Sens.
Gas Sens.
A/D Microcontroller
Purging Dry air Gas injection Gas molecules
Water Molecules
Ultrasonic Humidifier
Control Circuit
Power Supply For All Blocks RS232 Interface
PC
Prog. Circuit
Fig.2: A block diagram describing the steps of the measurement process.
Sensors' stand
Heating elements
Gas Cham.
Gas chamber
Fig.1: The schematic diagram of the measurement system utilized.
3.
Modeling
The input-output relationship of a chemoresistive gas sensor is described through the power law [20, 21]:
A more general model is obtained by including the effects of the additional inputs in the formation of the model structure. Assuming the actual target gas concentration as a function of the sensor resistance, ambient humidity and ambient temperature, we’ll have: 𝐶 = 𝑓 𝑅, 𝐻, 𝑇
2
There is no explicit mathematical formulation for f yet, but a data-based representation is possible through universal approximators such as artificial neural networks [22,23]. Following a series of numerical evaluations and based on the pruning method, a three layer feedforward neural network of {3 2 1} structure was proved to be a good candidate for representing the unknown function f. The transfer function of all 6 neurons was selected to be logarithmic sigmoid defined as: 𝑦 = 1/(1 + exp(−x))
(3)
Rg (k )
In which R is the sensor resistance and C is the concentration of the target gas; s, m, and r are thecalibration parameters. This simple heuristic model can be tuned based on some experimental data; the reverse model then can be utilized to estimate the gas concentration corresponding to the measured value of the sensor resistance. While this single input single output model has performed well in formulating the sensor behavior at well-controlled constant laboratory conditions, its quantitative predictions based on themeasurements carried out in the practical conditions can be trusted only if the other influencing inputs remained unchanged since the last calibration. Atmospheric conditions including the ambient humidity (H) and temperature (T) or traces of undesired interfering gases can remarkably affect the sensing mechanism of the chemoresistive gas sensor [17].The variation of these atmospheric parameters invalidates the one-to-one relationship between R and C. Fig.3 illustrates how the environmental parameters can change the sensor resistance. At any fixed concentration of the target gas, the sensor resistance decreases by increasing the ambient humidity and temperature. Hence, as depicted in Fig.4, there will be a span of sensor resistance values related to any concentration of the target gas. The calibrated model, showed by solid curve in Fig.4, is a good transfer function at normal atmospheric conditions. However, the ambient humidity and temperature variations cause driftlike terms that alter the sensor resistance substantially beyond the expected values and result in high estimation errors.
4
500ppm
250ppm 1000ppm 1500ppm 2000ppm
2
1
a)
0.8 0
20 40 60 Relative Humidity (%)
4
80
100ppm 250ppm
3
500ppm 1000ppm 1500ppm
Rg (k )
(1)
100ppm
3
2000ppm
2
1
b)
0.65 0
20 40 60 Relative Humidity (%)
80
Fig.3: Variations of the sensor resistance with the relative humidity at the presence of the stated methanol contamination o levels in air at (a) 23 and (b) 33 C.
7 6 5 Rg(k)
𝑅 = 𝑠𝐶 𝑚 + 𝑟
5
4 3 2 1 0 0
500 1000 1500 2000 Methanol Concentration (ppm)
Fig.4: The best fit of the power function to the experimental data. Vertical bars represent the span of variations caused by the drift-like terms.
Where x is the input to the neuron and y is the output. Two third of the experimental data were randomly selected as the training dataset. The LevenbergMarquardt algorithm was repeatedly performed on the training dataset to decrease the output error to the lowest possible level. The remaining one third of the data, set aside as the test dataset, were used to evaluate the performance of the trained neural network.
Comparison of concentration values predicted by neural network and experimental results showed that this simulative engine have a good performance in estimating the concentration of a target gas in different ambient conditions. For the online performing of the above described drift compensation process, a smart sensor module was designed based on the above reported results. The block of the designed sensory system is demonstrated in Fig.6. The responses of the three sensors, i.e. temperature, humidity and gas sensors are fed into the neural network software implemented on a suitable microcontroller after signal manipulation and conversion to digital signals. The neural network program, then, predicts the compensated gasconcentration based on the previous training. The obtained target gas concentration value, after linearization, is re-converted to analog voltage directly related to the actual contamination level. The whole system acts as a smart gas sensor module that is insensitive to the variation of the environmental parameters.
Fig.5: Comparison of the real (experimentally measured)target gas concentrationswith those predicted by the trained artificial neural network.
Gas Sensor R
Humid. Sensor H
Temp. Sensor T
Signal Conditioning
Analog to Digital
ANN on DSP
Digital to Analog C Fig.6: The block diagram of the smart gas sensor module.
4.Conclusion The effect of ambient humidity and temperature fluctuations on the steady state responses of a chemoresistive gas sensor was studied. The results of the experiments carried out by the developed atmosphere controlled chamber revealed the dependency of the sensor output on the environmental parameters. A set of experiments were conducted at the presence of predetermined methanol concentration levels, the results of which indicated substantial deviations in the sensor response due to the instabilities in the parameters of the background atmosphere. It was shown that a static SISO model can not appropriately describe the input-output relationship of a chemoresistive gas sensor. This inputoutput relationship was formed by several experiments which resulted in comprehensive database of different ambient conditions along with the sensor response. This database was utilized for the training of an artificial neural network which could relate the combined readouts from a humidity sensor, a gas sensor and a thermometer to the actual target gas concentration. A comparison of the network-predicted target gas concentrations with the actual concentration levels showed that the trained neural network can considerably compensates the effects of the ambient humidity and temperature variations in the steady-state responses of the gas sensor. The results facilitated the design and development of a smart gas sensor module for the online compensation of the drift-like terms. Beside the resistance of gas sensor that is proportional to the concentration of the target gas, the module records background atmospheric conditions through the incorporated humidity and temperature sensors. The three inputs are fed into the neural network that is implemented on a microcontroller. The output of the module is a linear voltage that is only dependent on the concentration of the target gas. References [1]. D. D. Leec and D. S. Lee, “Environmental gas sensors”, IEEE Sensors Journal, vol. 1, pp. 214-224, Oct. 2001. [2]. S. Capone, A. Forleo, L. Francioso, R. Rella, P. Siciliano, J. Spadavecchia, D. S. Presicce and A. M. Taurino, “Solid state gas sensors state of the art and future activities”, Journal of Optoelectronics and Advanced Materials, vol. 5, pp. 1335-1348, 2003. [3]. F. Hossein-Babaei and M. Orvatinia, “Gas diagnosis based on selective diffusion retardation in an air filled capillary”, Sensors and Actuators B, vol. 96, pp. 298-303, 2003. [4]. H. T. Nagle, S. S. Schiffman and R. Gutierrez-Osuna, “The how and why of electronic noses”, IEEE Spectrum, vol. 35, pp. 22-21, 1998. [5]. F. Hossein-Babaei and F. Taghibakhsh, “Electrophoretically deposited zinc oxide thick film gas sensor”, IEEE Electronics Letters, vol. 36, pp.1815-1816, 2000. [6]. N. Yamazoe, G. Sakai and K. Shimanoe, “Oxide semiconductor gas sensors”, Catalysis Surveys from Asia, vol. 7, pp. 63-75, 2003. [7]. F. Hossein-Babaei and M. Orvatinia, “Analysis of thickness dependence of the sensitivity in thin film resistive gas sensors”, Sensors and Actuators B, vol. 89, pp. 256-261, 2003.
[8]. F. Hossein-Babaei and M. Orvatinia, “Transient regime of gas diffusion-physisorption through a microporous barrier”, IEEE Sensors Journal, vol. 5, pp. 1004-1010, 2005. [9]. F. Hossein-Babaei and S. M. Hosseini-Golgoo, “Analyzing the response of a thermally modulated gas sensor using a linear system identification technique for gas diagnosis”, IEEE Sensors Journal, vol. 8, pp. 1837-1847, 2008. [10]. F. Hossein-Babaei and S. M. Hosseini-Golgoo, Amir Amini “Extracting discriminative information from the Padé-Ztransformed responses of a temperature-modulated chemoresistive sensor for gas recognition”, Sensors and Actuators B, vol. 142, pp. 641-648, 2009. [11]. R. Gutierrez-Osuna, “Pattern analysis for machine olfaction A review”, IEEE Sensors Journal, vol. 2, pp. 189-202, 2002. [12]. H. Meixner and U. Lampe, “Metal oxide sensors”. Sensors and Actuators B, vol. 33, pp. 198-202, 1996. [13]. G. Martinelli and M. C. Carotta, “Thick-film gas sensors”. Sensors and Actuators B, vol. 23, pp. 157-161, 1995. [14]. A. Hierlemann and R. Gutierrez-Osuna, “Higher-order chemical sensing”. Chemical Reviews, vol. 108, pp. 563-613, 2008. [15]. M. Holmberg and T. Artursson, “Drift compensation standards and calibration methods”. Handbook of machine olfaction, Edited by T. C. Pearce, S. S. Schiffmann, H. T. Nagle & J. W. Gardner, 2003, pp. 325-346.
[16]. S. Holmin, C. Krantz-Rulcker, I. Lundstriom and F. Winquist, “Drift correction of electronic tongue responses”, Measurement Science and Technology, vol. 12, pp. 1348-1354, 2001. [17]. T. Artursson, T. Eklov, I. Lundstrom, P. Martensson, M. Sjostrom and M. Holmberg, “Drift correction for gas sensors using multivariate methods”, Journal of Chemometrics, vol. 14, pp. 711723, 2000. [18]. S. Hirobayashi, H. Kimura and T. Oyabu, “Dynamic model to estimate the dependence of gas sensor characteristics on temperature and humidity in environment”, Sensors and Actuators B, vol. 60, pp. 78-82, 1999. [19]. FIS Inc. Japan, http://www.fisinc.co.jp [20]. N. Yamazoe and K. Shimanoe, “Theory of power laws for semiconductor gas sensors”, Sensors and Actuators B, vol. 128, pp. 566-573, 2008. [21]. S. W. Lee, P. P. Tsai and H. Chen, “Comparison study of SnO2 thin and thick film gas sensors”, Sensors and Actuators B, vol. 79, pp. 163-170, 2001. [22]. S. Chen, S. A. Billings and P. M. Grant, “Non-linear system identification using neural networks”, International Journal of control, vol. 51, pp. 1191-1214, 1990. [23]. M. O. Efe and O. Kaynak, “A comparative study of neural network structures in identification of nonlinear systems”, Mechatronics, vol. 9, pp. 287-300, 1999.