2011 11th IEEE International Conference on Data Mining
A Generalized Fast Subset Sums Framework for Bayesian Event Detection Kan Shao Machine Learning Department Carnegie Mellon University
[email protected]
Yandong Liu Language Technologies Institute Carnegie Mellon University
[email protected]
ratio statistic, and testing for statistical significance. While Kulldorff’s original approach [4] searched over circular clusters for a single data stream, recent extensions of spatial scan can detect irregularly shaped clusters ([10], [3]) and integrate information from multiple streams [5]. Neill and Cooper [8] proposed the Multivariate Bayesian Scan Statistic (MBSS), and demonstrated several advantages of the Bayesian approach over frequentist spatial scan methods: MBSS is computationally efficient, can accurately differentiate between multiple event types, and its results (the posterior probability distribution of each event type) can be easily visualized and used for decision-making. However, MBSS is limited by computational considerations which only allow circular spatial regions to be searched. The recently proposed Fast Subset Sums (FSS) method [7] is an extension of MBSS which introduces a hierarchical prior distribution over regions, assigning non-zero prior probability to each of the 2𝑁 subsets of locations. FSS can compute the total posterior probability of an event and its spatial distribution by efficiently computing the sum of the exponentially many region posterior probabilities, thus enabling detection of irregularly-shaped clusters. Here we propose a Generalized Fast Subset Sums (GFSS) framework which improves the timeliness and accuracy of event detection, especially for irregularly shaped clusters. A new parameter 𝑝, representing the sparsity of the affected region, is introduced into the framework. This parameter can be viewed as the expected proportion of locations affected in the local neighborhood consisting of a center location and its nearest neighbors. Two specific values of 𝑝, 𝑝 = 1 and 𝑝 = 0.5, reduce to the previously proposed MBSS and FSS methods respectively, but detection performance can often be improved by considering a range of possible 𝑝 values from 0 to 1. We show that the distribution of the 𝑝 parameter can be accurately learned from labeled training data, and that the resulting learned distribution can be incorporated into the GFSS detection framework, resulting in substantially improved detection power and spatial accuracy.
Abstract—We present Generalized Fast Subset Sums (GFSS), a new Bayesian framework for scalable and accurate detection of irregularly shaped spatial clusters using multiple data streams. GFSS extends the previously proposed Multivariate Bayesian Scan Statistic (MBSS) and Fast Subset Sums (FSS) approaches for detection of emerging events. The detection power of MBSS is primarily limited by computational considerations, which limit it to searching over circular spatial regions. GFSS enables more accurate and timely detection by defining a hierarchical prior over all subsets of the 𝑁 locations, first selecting a local neighborhood consisting of a center location and its neighbors, and introducing a sparsity parameter 𝑝 to describe how likely each location in the neighborhood is to be affected. This approach allows us to consider all possible subsets of locations (including irregularlyshaped regions) but also puts higher weight on more compact regions. We demonstrate that MBSS and FSS are both special cases of this general framework (assuming 𝑝 = 1 and 𝑝 = 0.5 respectively), but substantially higher detection power can be achieved by choosing an appropriate value of 𝑝. Thus we show that the distribution of the sparsity parameter 𝑝 can be accurately learned from a small number of labeled events. Our evaluation results (on synthetic disease outbreaks injected into real-world hospital data) show that the GFSS method with learned sparsity parameter has higher detection power and spatial accuracy than MBSS and FSS, particularly when the affected region is irregular or elongated. We also show that the learned models can be used for event characterization, accurately distinguishing between two otherwise identical event types based on the sparsity of the affected spatial region. Keywords-event detection; biosurveillance; scan statistics
I. I NTRODUCTION Event detection from multiple data streams is a ubiquitous problem with applications to public health (early detection of disease outbreaks), law enforcement (detecting emerging hot-spots of crime), and many other domains. In the event detection problem, we are given multivariate spatial time series data monitored at a set of spatial locations, with the essential goals of a) timely detection of emerging events (while maintaining a low false positive rate), b) correctly pinpointing the affected spatial areas, and c) accurately characterizing the event (e.g. distinguishing between multiple event types). Many previous event detection methods have been proposed based on the spatial scan statistic [4]: these methods search over a large number of spatial regions, identifying potential clusters which maximize a likelihood 1550-4786/11 $26.00 © 2011 IEEE DOI 10.1109/ICDM.2011.11
Daniel B. Neill H.J. Heinz III College Carnegie Mellon University
[email protected]
A. Multivariate Bayesian Scan Statistics The MBSS methodology aims at detecting emerging events (such as disease outbreaks), identifying the type of event and pinpointing the affected locations. MBSS 617
compares a set of alternative hypotheses 𝐻1 (𝑆, 𝐸) with the null hypothesis 𝐻0 , where each hypothesis 𝐻1 (𝑆, 𝐸) represents the occurrence of some event type 𝐸 in some subset of locations 𝑆, and the null hypothesis 𝐻0 assumes that no events have occurred. These hypotheses are mutually exclusive. Therefore, according to Bayes’ Theorem, the posterior probability of each hypothesis can be expressed as: Pr(𝐻1 (𝑆, 𝐸) ∣ 𝐷) =
Pr(𝐷 ∣ 𝐻1 (𝑆, 𝐸)) Pr(𝐻1 (𝑆, 𝐸)) Pr(𝐷)
𝑃 𝑟(𝐻0 ∣ 𝐷) =
Pr(𝐷 ∣ 𝐻0 ) Pr(𝐻0 ) Pr(𝐷)
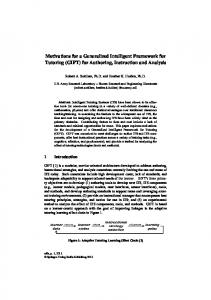
Figure 1. The structure of the Multivariate Bayesian Scan Statistic framework, from Neill and Cooper [8]. GFSS replaces the edge from 𝐸 to 𝑆 with the structure shown in Figure 2.
In this expression, 𝐷 is the observed dataset, and its total probability Pr(𝐷) is equal to Pr(𝐷 ∣ 𝐻0 ) Pr(𝐻0 ) + ∑ 𝑆,𝐸 Pr(𝐷 ∣ 𝐻1 (𝑆, 𝐸)) Pr(𝐻1 (𝑆, 𝐸)). MBSS assumes that the prior Pr(𝐻1 (𝑆, 𝐸)) is uniformly distributed over all event types and all possible circular spatial regions 𝑆. Only circular regions are considered because this simplification reduces the computation time from exponential to quadratic in 𝑁 ; however, this assumption reduces the power of MBSS to detect non-circular clusters, especially if the affected region is highly elongated or irregular. The dataset 𝐷 in the MBSS framework consists of multiple data streams 𝐷𝑚 , for 𝑚 = 1 . . . 𝑀 , and each stream contains spatial time series data collected from a set of locations 𝑠𝑖 , for 𝑖 = 1 . . . 𝑁 . For each location 𝑠𝑖 and data stream 𝐷𝑚 , we have a time series of observed counts 𝑐𝑡𝑖,𝑚 and the corresponding expected counts (or baselines) 𝑏𝑡𝑖,𝑚 , where the baselines are estimated from time series analysis of the historical data for the given location and data stream. The subscript 𝑡 = 0 represents the current time step, and 𝑡 = 1 . . . 𝑇 represent from 1 to 𝑇 time steps ago respectively. For instance, a given count 𝑐𝑡𝑖,𝑚 may represent the total number of Emergency Department visits for fever symptoms for a given zip code on a given day, and the corresponding baseline 𝑏𝑡𝑖,𝑚 would represent the expected number of fever cases for that zip code on that day ([8], [7]). Besides the prior Pr(𝐻1 (𝑆, 𝐸)), another important quantity to consider is the likelihood function Pr(𝐷 ∣ 𝐻1 (𝑆, 𝐸)), as shown in Figure 1. MBSS assumes that the observed count 𝑐𝑡𝑖,𝑚 is modeled using the Poisson distribution: 𝑐𝑡𝑖,𝑚 ∼ 𝑡 𝑡 𝑏𝑡𝑖,𝑚 ), where 𝑞𝑖,𝑚 is the relative risk, or exPoisson(𝑞𝑖,𝑚 pected ratio of count to baseline. Further, the relative risk 𝑡 ∼ Gamma(𝛼𝑚 , 𝛽𝑚 ) under the null is modeled as 𝑞𝑖,𝑚 𝑡 ∼ Gamma(𝑥𝑡𝑖,𝑚 𝛼𝑚 , 𝛽𝑚 ) under the hypothesis, and as 𝑞𝑖,𝑚 alternative hypothesis, where 𝛼𝑚 and 𝛽𝑚 are parameter priors calculated from historical data, and 𝑥𝑡𝑖,𝑚 is the impact of the event for the given data stream 𝐷𝑚 , location 𝑠𝑖 , and time step 𝑡. The distribution of 𝑥𝑡𝑖,𝑚 is conditioned on the affected region 𝑆, the event type 𝐸, the temporal window 𝑊 , and the severity parameter 𝜃, which is assumed to be drawn from a discrete uniform distribution Θ. The temporal
window 𝑊 is drawn uniformly at random between 1 and 𝑊𝑚𝑎𝑥 , the maximum temporal window size. The total likelihood of the data given the alternative hypothesis 𝐻 ∑1 (𝑆, 𝐸) ∑ can be expressed as: Pr(𝐷 ∣𝐻1 (𝑆, 𝐸)) = 1 𝜃∈Θ 𝑊 ∈1...𝑊𝑚𝑎𝑥 Pr(𝐷 ∣ 𝐻1 (𝑆, 𝐸), 𝜃, 𝑊 ). The 𝑊𝑚𝑎𝑥 ∣Θ∣ event type 𝐸 and event severity 𝜃 define the effect 𝑥𝑚 on each data stream 𝐷𝑚 . Conditioned on 𝑊 , 𝜃, and 𝐸, the likelihood ratio for each location 𝑠𝑖 can be computed ∏ ∏ Pr(𝑐𝑡𝑖,𝑚 ∣ 𝑏𝑡𝑖,𝑚 ,𝑥𝑚 𝛼𝑚 ,𝛽𝑚 ) as 𝐿𝑅𝑖 = 𝑚=1...𝑀 𝑡=0...𝑊 −1 Pr(𝑐𝑡𝑖,𝑚 ∣ 𝑏𝑡𝑖,𝑚 ,𝛼𝑚 ,𝛽𝑚 ) , as described in [8]. The likelihood ratio for each spatial region 𝑆, again conditioned on 𝑊 , 𝜃, and 𝐸, is obtained by multiplying the likelihood ratios of all locations 𝑠𝑖 ∈ 𝑆. We then marginalize over these parameters to obtain the total likelihood of region 𝑆, and combine the prior with the likelihood using Bayes’ Theorem to obtain the posterior probability of each event type 𝐸 in each region 𝑆. II. G ENERALIZED FAST S UBSET S UMS As discussed in the previous section, the MBSS method is primarily restricted by its exhaustive computation over spatial regions 𝑆, which limits the search space to a small fraction of the 2𝑁 possible subsets of locations. More precisely, all non-circular regions are assumed to have zero prior probability, thus reducing the method’s computation time but also its detection power for irregular clusters. However, two important insights allow us to circumvent this limitation: first, the total posterior probability of an event type 𝐸 is the sum of the region probabilities Pr(𝐻1 (𝑆, 𝐸) ∣ 𝐷) over all spatial regions 𝑆, and second, the posterior probability that each spatial location 𝑠𝑖 has been affected by event type 𝐸 is the sum of the probabilities Pr(𝐻1 (𝑆, 𝐸)∣𝐷) over all spatial regions 𝑆 which contain 𝑠𝑖 . Thus we can efficiently search over all subsets 𝑆, including irregularly shaped regions, by defining a prior distribution Pr(𝐻1 (𝑆, 𝐸)) which allows these sums to be efficiently computed without computing each of the individual region probabilities. For each event type 𝐸, we define a non-uniform, hierar-
618
Figure 2.
to independently including each location with probability 0.5, and hence FSS is also a special case of GFSS with 𝑝 = 0.5. We demonstrate below that the additional flexibility provided by including the sparsity parameter in our GFSS framework can substantially improve the timeliness and accuracy of event detection: higher values of 𝑝 result in improved detection of compact clusters, while lower values of 𝑝 enhance detection of elongated or irregular clusters. This hierarchical prior, and particularly the assumption that each location is drawn independently given the neighborhood, enables us to calculate the posterior probabilities much more efficiently. For a given center location 𝑠𝑐 and neighborhood size 𝑘, and conditioning on the event type 𝐸, event severity 𝜃, and temporal window 𝑊 , we can compute the total posterior probability of the 2𝑘 spatial regions 𝑆 ⊆ 𝑆𝑐𝑘 in 𝑂(𝑘) time. Since we consider 𝑂(𝑁 ) center locations and 𝑂(𝐾) neighborhood sizes, this enables us to compute the total posterior probability in time 𝑂(𝑁 𝐾 2 ). To do so, we first compute the average likeliof 𝑆𝑐𝑘 . ∏We know hood ∑ratio over all 2𝑘 subsets ∑ Pr(𝑆 ∣ 𝐷) ∝ that 𝑆⊆𝑆𝑐𝑘 𝑆⊆𝑆𝑐𝑘 Pr(𝑆) 𝑠𝑖 ∈𝑆 𝐿𝑅𝑖 , where Pr(𝑆) = 𝑝∣𝑆∣ (1 − 𝑝)(𝑘−∣𝑆∣) is the prior probability of region 𝑆 ∑ and 𝐿𝑅𝑖 is the ∏ likelihood ratio Pr(𝑆) of location 𝑠𝑖 . Then 𝑠𝑖 ∈𝑆 𝐿𝑅𝑖 = (1 − ( )𝑆⊆𝑆𝑐𝑘 ∑ ∏ 𝑝 𝑘 𝑝) 𝑆⊆𝑆𝑐𝑘 𝑠𝑖 ∈𝑆 1−𝑝 𝐿𝑅𝑖 . Since we are summing 𝑘 𝑘 over all 2 subsets of 𝑆𝑐𝑘 , we can write the sum ( of )2 prod∑ ∏ 𝑝 ucts as a product of 𝑘 sums: 𝑆⊆𝑆𝑐𝑘 𝑠𝑖 ∈𝑆 1−𝑝 𝐿𝑅𝑖 = ( ( ) ) ∏ 𝑝 𝑘 𝑠𝑖 ∈𝑆𝑐𝑘 1 + 1−𝑝 𝐿𝑅𝑖 . Multiplying by (1 − 𝑝) , we obtain the expression for the average likelihood ratio, ∏ 𝑠𝑖 ∈𝑆𝑐𝑘 ((1 − 𝑝) + 𝑝 × 𝐿𝑅𝑖 ). Thus the posterior probability of event 𝐸, conditioned on the temporal window 𝑊 , event severity 𝜃, center location 𝑠𝑐 , and neighborhood size 𝑘, is proportional to the product of the smoothed likelihood ratios 𝐿𝑅𝑖′ = (1 − 𝑝) + 𝑝 × 𝐿𝑅𝑖 for all locations 𝑠𝑖 ∈ 𝑆𝑐𝑘 . We can then compute the total posterior probability of event 𝐸 by marginalizing over all 𝑊 , 𝜃, 𝑠𝑐 , and 𝑘. The posterior probability that event 𝐸 affects each location 𝑠𝑗 can be computed using a procedure very similar to the above, but in this case we only consider the neighborhoods 𝑆𝑐𝑘 that contain 𝑠𝑗 , and sum over the 2𝑘−1 subsets 𝑆 ⊆ 𝑆𝑐𝑘 with 𝑠𝑗 ∈ 𝑆. Conditioning on the temporal window 𝑊 , event severity 𝜃, center location 𝑠𝑐 , and neighborhood size 𝑘, we write the sum of 2𝑘−1 products as the product of 𝑘 − ∏ 1 sums, obtaining an average likelihood ratio of (𝑝𝐿𝑅𝑗 ) 𝑠𝑖 ∈𝑆𝑐𝑘 −{𝑠𝑗 } ((1 − 𝑝) + 𝑝 × 𝐿𝑅𝑖 ). Again, we can compute the total posterior probability of event 𝐸 in spatial regions containing 𝑠𝑗 by marginalizing over all 𝑊 , 𝜃, 𝑠𝑐 , and 𝑘 such that 𝑠𝑗 is contained in 𝑆𝑐𝑘 .
The structure of the Generalized Fast Subset Sums framework.
chical prior distribution over regions Pr(𝐻1 (𝑆, 𝐸) ∣ 𝐸) such that all 2𝑁 subsets have non-zero prior probability, but more compact regions have a larger prior. Our hierarchical prior consists of four steps: 1) Choose the center location 𝑠𝑐 from {𝑠1 . . . 𝑠𝑁 }, given a multinomial distribution Pr(𝑠𝑐 ∣ 𝐸). 2) Choose the neighborhood size 𝑘 from {1 . . . 𝐾}, given a multinomial distribution Pr(𝑘 ∣ 𝐸). 3) Define the local neighborhood 𝑆𝑐𝑘 to consist of 𝑠𝑐 and its 𝑘 − 1 nearest neighbors, based on the Euclidean distance between the zip code centroids. 4) For each spatial location 𝑠𝑖 ∈ 𝑆𝑐𝑘 , include 𝑠𝑖 in 𝑆 with probability 𝑝, for a fixed constant 0 < 𝑝 ≤ 1. The additional structure of GFSS is shown in Figure 2, replacing the direct edge between the event type 𝐸 and affected region 𝑆 in Figure 1. Here we assume uniform distributions over the center 𝑠𝑐 and neighborhood size 𝑘, but future work will learn these distributions from data. For a given local neighborhood 𝑆𝑐𝑘 , we independently choose whether to include or exclude each location 𝑠𝑖 ∈ 𝑆𝑐𝑘 in the affected region 𝑆. Each location is included with probability 𝑝 or excluded with probability 1 − 𝑝, where 𝑝 is a constant (0 < 𝑝 ≤ 1) which we term the sparsity parameter. We note that the assumption of conditional independence of locations, given the neighborhood 𝑆𝑐𝑘 , is necessary for efficient computation, as discussed below. Dependence between nearby locations is introduced by the neighborhood structure, since locations which are closer together are more frequently either both included or both excluded in a given local neighborhood. The sparsity parameter 𝑝 can also be viewed as the expected proportion of locations affected within a given (circular) local neighborhood. Hence, the previously proposed MBSS method (searching over circular regions) corresponds to the special case of 𝑝 = 1. Additionally, the previously proposed FSS method assumes a similar hierarchical prior but without including the sparsity parameter 𝑝. Instead, FSS assumes that the affected subset of locations 𝑆 is drawn uniformly at random from the neighborhood 𝑆𝑐𝑘 , i.e. all 2𝑘 subsets of 𝑆𝑐𝑘 are equally likely. This is equivalent
A. Learning the Sparsity Parameter Our detection results, shown below, demonstrate that optimizing the sparsity parameter 𝑝 can substantially improve detection power. However, since the value of 𝑝 must be
619
supplied as a parameter to the GFSS detection framework, we must consider how an appropriate value can be chosen. Here we propose to learn the distribution of the sparsity parameter from labeled data to improve the timeliness and accuracy of event detection. The assumption of labeled data means that we are given the affected subset of locations 𝑆 for each training example; however, we are not given the values of the three latent variables (center location 𝑠𝑐 , neighborhood size 𝑘, and sparsity 𝑝). Let 𝑆1 . . . 𝑆𝐽 represent a set of 𝐽 labeled training examples. For each training example 𝑆𝑗 , we can calculate the likelihood of the affected region given the sparsity parameter 𝑝 by marginalizing over the center 𝑠𝑐 and neighborhood size ∑ ∑ location 𝑘: Pr(𝑆𝑗 ∣ 𝑝) = 𝑠𝑐 𝑘 Pr(𝑆𝑗 ∣ 𝑝, 𝑠𝑐 , 𝑘) Pr(𝑠𝑐 ) Pr(𝑘). Then the conditional likelihood Pr(𝑆𝑗 ∣ 𝑝, 𝑠𝑐 , 𝑘) can be further expressed as 𝑝∣𝑆𝑗 ∣ (1 − 𝑝)𝑘−∣𝑆𝑗 ∣ if all of the locations in 𝑆𝑗 are contained in the local neighborhood 𝑆𝑐𝑘 , and Pr(𝑆𝑗 ∣ 𝑝, 𝑠𝑐 , 𝑘) = 0 otherwise. Hence we can write ( )∣𝑆𝑗 ∣ ∑ ∑ 𝑝 Pr(𝑆𝑗 ∣ 𝑝) = 1−𝑝 𝑠𝑐 Pr(𝑠𝑐 ) 𝑘=𝑘𝑐 ...𝐾 Pr(𝑘)(1 − 𝑘 𝑝) , where 𝑘𝑐 is the smallest neighborhood size such that 𝑆𝑐𝑘 contains all locations in 𝑆𝑗 . For simplicity, we assume a discrete distribution for 𝑝, where each training example 𝑆𝑗 has sparsity parameter 𝑝𝑗 ∈ 𝑃 . In our experiments, we use ten components: 𝑃 = {0.1, 0.2, . . . , 1.0}. Assuming that each value 𝑝𝑗 is drawn independently from a discrete distribution 𝜃, we compute the posterior distribution of 𝜃 given 𝑆1 . . . 𝑆𝑗 , representing the probability that 𝑝 will take on each value in 𝑃 . Additionally, we assume a Dirichlet prior on 𝜃. Let 𝑥𝑘 denote the 𝑘th component of 𝑃 , and 𝜃𝑘 denote the posterior probability that 𝑝 will take on value 𝑥𝑘 . If the value of 𝑝𝑗 for each training example 𝑆𝑗 was observed, we could easily obtain the resulting posterior distribution of 𝜃, by computing ∑ 1 + 1{𝑝𝑗 =𝑥𝑘 } ∣𝑃 ∣ 𝑗=1...𝐽 for each 𝑥𝑘 ∈ 𝑃 . However, 𝜃𝑘 = 1+𝐽 since the value of 𝑝𝑗 for each training example 𝑆𝑗 is not observed, we must first compute the posterior probabilities Pr(𝑆𝑗 ∣ 𝑝=𝑥𝑘 ) for each value Pr(𝑝𝑗 = 𝑥𝑘 ∣ 𝑆𝑗 ) = ∑ Pr(𝑆 ∣ 𝑝=𝑥 ) 𝑥𝑘 ∈𝑃
𝑗
differentiate between multiple event types. The recently proposed “linear-time subset scanning” approach enables an efficient search over the 2𝑁 subsets of locations while only evaluating 𝑂(𝑁 ) subsets. However, the LTSS method simply finds the most anomalous (highest scoring) subset, and cannot be used to compute the total posterior probability of an event or its posterior distribution in space and time, which require summing over all subsets of locations. Previously, learning approaches to improve detection power by using non-uniform priors on each search region were explored in ([8], [6]). However, these methods are still constrained by the computational limitations inherent in the MBSS framework, preventing them from being used to learn priors over all subsets of the data rather than just circular regions. Finally, several other Bayesian event detection methods have been proposed, such as WSARE [11] and PANDA ([1], [2]). Unlike the present work, these purely temporal event detection methods do not take spatial information into account. III. E VALUATION In this section, we evaluate the learning performance, as well as compare the detection power and spatial accuracy of the GFSS method with the MBSS and FSS approaches. Our experiments focus on detection of simulated disease outbreaks injected into real-world hospital Emergency Department (ED) data. The original dataset contains de-identified ED visit records collected from ten hospitals in Allegheny County, Pennsylvania, from January 1, 2004 to December 31, 2005. The records have been classified into various data streams according to the patient’s chief complaint: for this study we focused on two data streams, patients with cough symptoms and nausea symptoms respectively. For each data stream, we have the count of ED visits of that type on each day for each of the 97 Allegheny County zip codes. For each of the experiments described below, simulated outbreaks were generated by first choosing a set of affected zip codes, then injecting a number of simulated disease cases that grows linearly over the duration of the outbreak. Each outbreak was assumed to be 10 days in duration. For each affected zip code 𝑠𝑖 and data stream 𝐷𝑚 , and for each day 𝑡 ∼ Poisson(𝑡 × 𝑤𝑖,𝑚 ) of the outbreak 𝑡 = 1 . . . 10, 𝛿𝑖,𝑚 additional cases are injected, incrementing the value of 𝑐𝑡𝑖,𝑚 . Here we assume that each zip code’s weight is proportional ∑ 𝑡 𝑐 𝑡 𝑖,𝑚 . to its total count for the entire dataset: 𝑤𝑖,𝑚 = ∑ ∑ 𝑐𝑡
𝑘
𝑥𝑘 ∈ 𝑃 and ∑ each training example 𝑆𝑗 . We then compute 1 + Pr(𝑝𝑗 =𝑥𝑘 ∣ 𝑆𝑗 ) ∣𝑃 ∣ 𝑗=1...𝐽 𝜃𝑘 = for each 𝑥𝑘 ∈ 𝑃 . 1+𝐽 B. Related Work The present study proposes the Generalized Fast Subset Sums (GFSS) framework, which generalizes the previously proposed Multivariate Bayesian Scan Statistic [8] and Fast Subset Sums [7] methods for multivariate Bayesian event detection. The Bayesian spatial scan framework is a variant of the traditional frequentist, hypothesis test-based spatial scan methods [4]. Two recently proposed frequentist spatial scan methods, Kulldorff’s multivariate scan [5] and the nonparametric scan statistic [9], also allow integration of multiple data streams for detection. However, unlike the Bayesian spatial scan approaches, these methods cannot
𝑖
𝑡
𝑖,𝑚
To evaluate detection power, we measured average time to detection at a fixed false positive rate of 1/month. To do so, for a given method and a given set of simulated outbreaks, we first compute∑ the total posterior probability of an outbreak, Pr(𝐻1 ∣𝐷) = 𝑆,𝐸 Pr(𝐻1 (𝑆, 𝐸)∣𝐷), for each day of the original dataset with no outbreaks injected. Then for each simulated outbreak, we compute Pr(𝐻1 ∣𝐷) for each outbreak day. For a given false positive rate 𝑟, the detection time 𝑑 for a given outbreak is computed as the first outbreak
620
more elongated clusters. For compact clusters, GFSS with 𝑝 = 0.5 achieved the most timely detection, while 𝑝 = 0.7 had slightly higher spatial accuracy. For elongated clusters, however, GFSS with 𝑝 = 0.2 improved the timeliness of detection by nearly one day, and had a 10% higher overlap coefficient, than 𝑝 = 0.5. These preliminary results demonstrate the importance of choosing an appropriate value for 𝑝; the experiments below demonstrate that the distribution of 𝑝 can be learned accurately from labeled training data. B. Outbreak Simulations for Learning Results We now evaluate the detection performance of the learned GFSS model, as compared to the previously proposed MBSS and FSS methods, and also as compared to the GFSS approach assuming a uniform prior distribution of 𝑝. For these experiments, simulated outbreaks were generated using the same hierarchical generative model as assumed in the GFSS framework: given a value of the sparsity parameter 𝑝, the set of zip codes was selected by first choosing the center location and neighborhood size uniformly at random, and then independently choosing whether to include (with probability 𝑝) or exclude (with probability 1 − 𝑝) each location in that local neighborhood. We considered six different outbreak types: outbreaks generated using five different values of the sparsity parameter 𝑝 (𝑝 = 0.2, 0.4, . . . , 1.0), and a sixth outbreak type which consisted of an equal mixture of 𝑝 = 0.2 and 𝑝 = 0.8. For each combination of the value of sparsity parameter 𝑝 and data stream, 100 outbreaks were injected to form a set of training data and another 100 outbreaks for forming the testing data. For each of the two data streams, this gives us a total of six datasets for training and another six corresponding datasets for testing, with each pair of datasets assuming a different value or mixture of the sparsity parameter 𝑝.
Figure 3. The average time to detection at 1 false positive/month for GFSS variants with different values of the sparsity parameter 𝑝, for compact and elongated outbreak regions.
Figure 4. The average spatial accuracy (overlap coefficient) for GFSS variants with different values of the sparsity parameter 𝑝, for compact and elongated outbreak regions.
day (𝑡 = 1 . . . 10) with posterior outbreak probability higher than the 100(1 − 𝑟) percentile of the posterior probabilities for the original dataset. For a fixed false positive rate of 1/month, this corresponds to the 96.7th percentile. If no day of the outbreak has probability higher than this threshold, the method has failed to detect that outbreak, and we set 𝑑 = 10. To evaluate spatial accuracy, we computed the average overlap coefficient between the true and detected clusters at day 7 of the outbreak. Given the set of locations 𝑆 ∗ identified by the detection method (all 𝑠𝑖 with posterior probabilities greater than half the total posterior probability of an outbreak) and the true set of affected locations 𝑆𝑡𝑟𝑢𝑒 , ∗ ∩𝑆𝑡𝑟𝑢𝑒 ∣ the overlap coefficient is defined as ∣𝑆 ∗ ∣𝑆 ∪𝑆𝑡𝑟𝑢𝑒 ∣ .
C. Learning Performance In the present study, we assume that the value of 𝑝 is drawn from a discrete distribution with ten components from 0.1 to 1.0, and thus we wish to learn the probability of each of the ten possible values of 𝑝 from the training data (100 simulated injects for a given outbreak type). For each of the 12 training datasets (six for each data stream), the posterior distribution of the sparsity parameter 𝑝 was learned and shown in Figures 5 and 6. For each of the first five experiments (𝑝 = 0.2, 0.4, . . . , 1.0), we observe that the learned distribution of 𝑝 correctly peaks at the true value of 𝑝 for that set of simulated injects, for both cough and nausea cases. For the last two experiments, with half of the training examples assuming 𝑝 = 0.2 and half assuming 𝑝 = 0.8, we observe that the learned distribution is again able to recover the true bimodal distribution of 𝑝.
A. Preliminary Results We first performed a simple evaluation of ten variants of the GFSS method with fixed values of the sparsity parameter 𝑝 = 0.1, 0.2, . . . , 1.0. As noted above, 𝑝 = 0.5 and 𝑝 = 1.0 correspond to the previously proposed FSS and MBSS methods respectively. We compared the detection power and spatial accuracy of these ten methods for two different outbreak types, one affecting a compact spatial region and one affecting an elongated region. As can be seen from Figures 3 and 4, substantial differences in the timeliness and accuracy of detection were observed with varying 𝑝: in particular, higher values of 𝑝 tended to result in improved detection performance for more compact clusters, and lower values of 𝑝 enhanced detection performance for
D. Detection Power and Spatial Accuracy Results In this section, we compare the detection power and spatial accuracy of four different methods: (1) the previ-
621
Figure 7. The detection time of four competing methods, for five different simulated outbreak types injected into cough and nausea data from Allegheny County, PA. Figure 5. True value and learned distribution of sparsity parameter p, for six different simulated outbreak types injected into cough data from Allegheny County, PA.
Figure 8. The spatial accuracy (overlap coefficient) of four competing methods, for five different simulated outbreak types injected into cough and nausea data from Allegheny County, PA.
true and detected clusters at day 7 of the outbreak. The comparison of overlap coefficients for each of the two data streams, for simulated injects with 𝑝 = 0.2, 0.4, . . . , 1.0, is shown in Figure 8. From these results, it can be observed that the learned GFSS method achieves similar spatial accuracy to the best of the other three methods for each value of 𝑝, and achieves significantly higher spatial accuracy when the outbreak region is elongated or irregular (i.e. for low values of the sparsity parameter 𝑝).
Figure 6. True value and learned distribution of sparsity parameter p, for six different simulated outbreak types injected into nausea data from Allegheny County, PA.
ously proposed MBSS method (special case of GFSS with 𝑝 = 1.0), (2) the previously proposed FSS method (special case of GFSS with 𝑝 = 0.5), (3) GFSS assuming a uniform distribution of sparsity parameter 𝑝 (each value of 𝑝 from 𝑝 = 0.1 to 𝑝 = 1.0 has an equal probability of 0.1), and (4) GFSS with a distribution of 𝑝 learned from 100 labeled training examples. The comparison of detection times for each of the two data streams, for simulated injects with 𝑝 = 0.2, 0.4, . . . , 1.0, is shown in Figure 7. The average detection time of each method, assuming a fixed false positive rate of 1 fp/month, is displayed on the graphs. When the value of 𝑝 is small, corresponding to an elongated or irregular outbreak region, GFSS with learned 𝑝 is able to detect the outbreaks substantially earlier than the other methods. The FSS method (equivalent to putting of all of the probability mass at 𝑝 = 0.5) performs well for values of 𝑝 near 0.5, and the MBSS method (equivalent to putting all of the probability mass at 𝑝 = 1.0) performs well for values of 𝑝 near 1.0, as expected, but both methods lose detection power when the assumed value of 𝑝 is incorrect. Next we evaluated the spatial accuracy of each method by computing the average overlap coefficient between the
E. Detection Ability for Mixture Outbreak Type In this section, we examine the detection time and spatial accuracy of these different methods for the mixed outbreak type (half of outbreaks generated with 𝑝 = 0.2 and half of outbreaks generated with 𝑝 = 0.8). We first consider a single distribution of 𝑝 learned from the mixed outbreak type, as compared to MBSS, FSS, and GFSS with a uniform distribution of 𝑝. The last graphs of Figures 5 and 6 demonstrate that the single model can accurately capture the bimodal distribution of 𝑝. The results of detection time and spatial accuracy for the mixed outbreaks by using four different methods are listed in Table 1. The best results and those not significantly different from the best results are shown in bold. The GFSS with learned 𝑝 slightly outperforms FSS and GFSS with uniform 𝑝 for detecting mixture outbreaks, with all three methods outperforming MBSS by a large margin. Next we assumed that the two values of 𝑝 in the mixed outbreak type corresponded to two different outbreaks, and
622
Table I C OMPARISON OF DETECTION TIME AND SPATIAL ACCURACY FOR THE MIXED OUTBREAK TYPE
Data
Evaluation
MBSS
FSS
Cough
Days to detect (1 fp/month) Spatial overlap coefficient Days to detect (1 fp/month) Spatial overlap coefficient
6.16
Cough Nausea Nausea
5.36
GFSSuniform p 5.51
GFSSlearned p 5.51
0.478
0.586
0.641
0.641
4.00
3.67
3.59
3.61
0.517
0.623
0.688
0.694
Figure 10. Posterior probability of the correct outbreak type as a function of day of outbreak, for cough and nausea data.
Figure 9. True value and learned distribution of the sparsity parameter 𝑝 for the mixed outbreak type (equal mixture of 𝑝 = 0.2 and 𝑝 = 0.8) assuming two different outbreak models
Figure 11. Posterior probability of the correct outbreak type as a function of day of outbreak, assuming two outbreak models and monitoring two data streams.
data streams enabled accurate differentiation of the two outbreak types, with average posterior conditional probability of the correct outbreak type increasing to approximately 85% over the course of the outbreak. However, simultaneously learning both the sparsity and the effects enabled even higher accuracy, with average posterior probability of the correct outbreak type increasing to approximately 95%.
evaluated the ability of the GFSS framework to distinguish between these two outbreak types. Figure 9 is the result of learning the mixed type of outbreaks by using two GFSS models. We note that each model can capture each outbreak type quite well for both data streams. Additionally, using two models to learn the mixed outbreak type can also help us improve the ability to discriminate between the two different outbreak types. Figure 10 shows the average posterior conditional probability of the correct outbreak type, Pr(𝑐𝑜𝑟𝑟𝑒𝑐𝑡 𝑡𝑦𝑝𝑒 ∣ 𝐷𝑎𝑡𝑎)/(Pr(𝑐𝑜𝑟𝑟𝑒𝑐𝑡 𝑡𝑦𝑝𝑒 ∣ 𝐷𝑎𝑡𝑎) + Pr(𝑖𝑛𝑐𝑜𝑟𝑟𝑒𝑐𝑡 𝑡𝑦𝑝𝑒 ∣ 𝐷𝑎𝑡𝑎)), as a function of the outbreak day. As we can see, near the start of the outbreak, the posterior probability of an outbreak is divided nearly 50/50 between the correct and incorrect outbreak type, but by the end of the outbreak, posterior conditional probability of the correct outbreak type has risen to 76% for a cough outbreak or 79% for a nausea outbreak. Finally, we note that, in addition to learning the distribution of the sparsity parameter, we can also learn the distribution of each outbreak type’s relative effects on the two data streams from the same labeled training data, as in [8]. We considered two outbreak types which had both different values of 𝑝 for the injected outbreaks (𝑝 = 0.2 and 𝑝 = 0.8, as above) and also different relative effects on the two data streams: one outbreak type affected the cough stream twice as much as the nausea stream, and one type affected nausea twice as much as cough. As can be seen from Figure 11, either learning the sparsity parameter 𝑝 or learning the relative effects of the outbreak on the two labeled
F. Robustness of the Learned GFSS Model We performed three sets of follow-up experiments to evaluate the robustness of the learned Generalized Fast Subset Sums model to variation in a) the number of training examples, b) the number of discrete components used to learn the distribution of the sparsity parameter 𝑝, and c) the method used to generate simulated disease outbreaks. First, while the experiments above assumed 100 training examples, we also evaluated the effects of using a smaller or larger training dataset, re-running the experiments using 25, 50, and 200 outbreaks as training data. The learned distribution of the sparsity parameter 𝑝 in each case was very similar, and there were no significant differences in detection performance. Hence we conclude that the distribution of 𝑝 can be learned accurately, and used to enhance the timeliness and accuracy of event detection, even when learning from only 25 labeled training examples. Second, while the experiments above assumed that the sparsity parameter 𝑝 for each training example was drawn from a discrete distribution 𝑃 = {0.1, 0.2, . . . , 1.0} with ten components, we also evaluated the effects of using a
623
of experiments are shown in Figures 12 and 13 respectively. We observe that performance of the GFSS method with learned distribution of 𝑝 is not significantly different from the best performing method in terms of detection time or spatial accuracy, suggesting that a useful distribution for 𝑝 can still be learned even when the model is misspecified. IV. C ONCLUSIONS AND F UTURE W ORK The Generalized Fast Subset Sums (GFSS) framework is an generalization of the previously proposed Multivariate Bayesian Scan Statistic (MBSS) and Fast Subset Sums (FSS) methods, and includes both MBSS and FSS as special cases. A novel hierarchical prior over the 2𝑁 subsets of the data is proposed, parameterized by the center location 𝑠𝑐 , neighborhood size 𝑘, and sparsity 𝑝. The new sparsity parameter 𝑝 in the GFSS framework describes the expected proportion of locations affected within a given circular neighborhood, and thus can be varied to emphasize detection of more compact or more dispersed clusters. We demonstrate that the posterior distribution of the sparsity parameter can be learned accurately based on labeled training data, even when the size of the training sample is small. With the learned sparsity parameter, the GFSS method has higher detection power and higher spatial accuracy than the previously proposed FSS and MBSS methods, especially for elongated or irregular outbreaks. Additionally, learning two different models for outbreak types which have different sparsities (but are otherwise identical) allows us to precisely distinguish between the two outbreak types. Finally, we demonstrate that the GFSS method with learned distribution of 𝑝 also performs very well even for outbreaks which are not generated using the GFSS framework. In future work, we will extend the GFSS framework by also learning the distributions of the center location 𝑠𝑐 and the neighborhood size 𝑘 from labeled training data. We will also consider the case of partially labeled data, when only a subset of the affected locations is identified. Finally, we will examine the effects of allowing the probability that a location is affected given the neighborhood to vary spatially rather than assuming that 𝑝 is constant. For example, each location 𝑠𝑖 could be affected with a probability 𝑝𝑖 that decreases with its distance from the center location 𝑠𝑐 . If the value of 𝑝𝑖 is only dependent on the location 𝑠𝑖 and local neighborhood 𝑆𝑐𝑘 under consideration, then efficient computation of posterior probabilities is still possible in this more general setting.
Figure 12. The average time to detection at 1 false positive/month, with 95% confidence intervals, of four competing methods, for simulated disease outbreaks generated based on spatial spread.
Figure 13. The average spatial accuracy (overlap coefficient), with 95% confidence intervals, of four competing methods, for simulated disease outbreaks generated based on spatial spread.
larger number of components, using the 100-component distribution 𝑃 = {0.01, 0.02, . . . , 1.0}. The learned distribution again converged around the true value of 𝑝 for each experiment. However, there were no significant differences in detection power or spatial accuracy, and computation time for the 100-component distribution was approximately ten times as long as the 10-component distribution. These results suggest that our original choice of ten components was sufficient for learning the sparsity parameter 𝑝. Third, while the experiments above assumed a correctly specified generative model for the simulated injects (i.e. each inject was generated using the hierarchical prior distribution assumed by the GFSS model), we also tested the robustness of GFSS to model misspecification, by evaluating the performance of the learned GFSS model (as compared to the uniform GFSS model, MBSS, and FSS) on a separate set of 100 training and 100 test outbreaks which were not generated using the GFSS model. Instead, these injects assume a spatial model of disease spread: the outbreak starts at a randomly selected zip code, and on each outbreak day it affects that zip code and its 𝑘 − 1 nearest neighbors, based on Euclidean distance between the affected zip codes. The number of zip codes affected, and the expected number of injected cases, both grow linearly over the course of the outbreak, with zip codes near the center of the outbreak receiving a proportionately greater number of cases. The detection time and spatial accuracy results for this set
ACKNOWLEDGMENT This work was partially supported by the National Science Foundation under grants IIS-0916345, IIS-0911032, and IIS0953330.
624
R EFERENCES
Workshop on Machine Learning for Health Care Applications, 2008.
[1] G. F. Cooper, D. H. Dash, J. D. Levander, W.-K. Wong, W. R. Hogan, and M. M. Wagner. Bayesian biosurveillance of disease outbreaks. In Proc. Conference on Uncertainty in Artificial Intelligence, 2004.
[7] D. B. Neill. Fast Bayesian scan statistics for multivariate event detection and visualization. Statistics in Medicine, 30(5):455– 469, 2011.
[2] G. F. Cooper, J. N. Dowling, J. D. Levander, and P. Sutovsky. A Bayesian algorithm for detecting CDC Category A outbreak diseases from emergency department chief complaints. Advances in Disease Surveillance, 2:45, 2007.
[8] D. B. Neill and G. F. Cooper. A multivariate Bayesian scan statistic for early event detection and characterization. Machine Learning, 79(3):261–282, 2010. [9] D. B. Neill and J. Lingwall. A nonparametric scan statistic for multivariate disease surveillance. Advances in Disease Surveillance, 4:106, 2007.
[3] L. Duczmal and R. Assuncao. A simulated annealing strategy for the detection of arbitrary shaped spatial clusters. Comp. Stat. and Data Analysis, 45:269–286, 2004.
[10] G. P. Patil and C. Taillie. Upper level set scan statistic for detecting arbitrarily shaped hotspots. Envir. Ecol. Stat., 11:183–197, 2004.
[4] M. Kulldorff. A spatial scan statistic. Communications in Statistics: Theory and Methods, 26(6):1481–1496, 1997. [5] M. Kulldorff, F. Mostashari, L. Duczmal, W. K. Yih, K. Kleinman, and R. Platt. Multivariate scan statistics for disease surveillance. Statistics in Medicine, 26:1824–1833, 2007.
[11] W.-K. Wong, A. W. Moore, G. F. Cooper, and M. M. Wagner. Bayesian network anomaly pattern detection for disease outbreaks. In Proc. 20th International Conference on Machine Learning, 2003.
[6] M. Makatchev and D. B. Neill. Learning outbreak regions in Bayesian spatial scan statistics. In Proc. ICML/UAI/COLT
625