Southern Company Services, Inc., Birmingham, Alabama, USA. Abstract â This paper develops a risk-based integrated index that reflects power system ...
A Generalized Power System Reliability and Security Index Y.V. Makarov, Senior Member, IEEE
N.S. Moharari, Member, IEEE
Southern Company Services, Inc., Birmingham, Alabama, USA Abstract – This paper develops a risk-based integrated index that reflects power system reliability and security both directly and indirectly. Direct characteristics may express the risk to not fully supply load at various load levels and contingencies. Indirect characteristics address such undesirable conditions as circuit overloads, voltage problems, low stability margins, area interchange violations, insufficient generation reserves, unfeasible power flows, etc. Although indirect characteristics do not necessarily cause load losses, they nevertheless signal about a weakened performance of the system (reduced “security/reliability margin”). This reduced margin may lead to sometimes hardly predictable and quantifiable load losses (via remedial actions, islanding, and instability), unforeseen events (cascading outages), severe system failures (voltage collapse), etc. The new index gives a more comprehensive answer regarding the general degree of both reliability and security in the system by combining diverse contributing factors using a fuzzy logic like approach. It is designed to flexibly accommodate various priorities and admittance of power utilities regarding particular characteristics integrated in the index. The index is conveniently scaled: it expresses reliability as a per cent value, so that 100% corresponds to a “fully reliable system”, and 0% to a “completely unreliable system”. It allows comparing power systems of different size. The index is applicable in both deterministic and probabilistic approaches, for the past and planned time periods. The existing reliability indices such as expected unserved energy, system minutes of interruption, and others can be linked to and derived from the general index. The index has been developed in Southern Company, one of the largest power utilities in America. Although this index can be used with any reliability analysis software, this particular implementation is oriented to the reliability assessment program TRELSS (Transmission Reliability Evaluation of Large-Scale Systems) distributed by Electric Power Research Institute (EPRI). Numerical examples are provided for a large multi-area power system model derived from but not identical to the real Southern System. It contains more than 4400 busses and 6400 branches.
Keywords: Power system reliability, security, probabilistic methods, TRELSS. I. INTRODUCTION
Reliability of a power system is a measure of its ability to supply electric energy to all points of consumption under acceptable standard quality and in the amount required [1,2]. Two sorts of unreliability events are defined by the Task Force on Measuring Bulk System Reliability [3]: manual actions to reduce load (interruptible load cut, system-wide voltage reduction, public appeal to reduce Paper BPT99-332-13 accepted for presentation at the IEEE Power Tech ’99 Conference, Budapest, Hungary, Aug 29 – Sept 2, 1999
demand, and rotational load shedding) and automatic operations (load curtailment by devices preventing system failures, interruption of supply due to equipment outages, instability, etc.) Although the system conditions leading to load cuts are usually known, it is often difficult to predict the exact amount of load shedding in real systems. Therefore, there is a need to account for these system conditions as they contribute to security and reliability assessment. The North American Electric Reliability Council has introduced concepts of adequacy and security. Adequacy is a measure of the ability to meet the aggregate power and energy requirements. It reflects the existence of sufficient generation, transmission and distribution facilities to satisfy the customer demand [4,5]. Security reflects the ability to withstand disturbances [4]. Whereas reliability deals with the situations where the power system is not able to perform its primary functions, security accounts for the margin that separates the analyzed operating conditions from unreliability events. Security addresses various limits applied voltage magnitudes, power flows, transfer capability, inter-area exchange, generation reserves, stability measures, etc. and the available margins with respect to these limits. Reliability analyses involve evaluating various system contingencies at different load levels; analyzing their consequences to consumers, generation utilities, and transmission system; decision-making whether the reliability should be enhanced; revealing the most influential factors and system components effecting reliability; and finding the most efficient ways to enhance reliability by better power system design, maintenance, planning and operational procedures [6-8]. In security and reliability studies, both the deterministic and probabilistic assessments are employed. Deterministic methods refers to the traditional planning approach in which a selected usually limited group of contingencies is examined to account for system problems such as branch overloads, voltage problems, etc. In this method, all the contingencies are implicitly given a uniform probability of occurring. Probabilistic methods usually encompass a larger set of contingencies, e.g., the ones with all combinations of one or two components taken out. These contingencies have different probability of occurring depending on the types of components taken out, line length, type of generating unit, voltage level, etc. Reliability is evaluated by stressing the system in many different ways and weighting the consequences of any particular situation by the probability of its occurrence. The probability of contingencies and load levels where the unreliability events occur play a key role in probabilistic methods along with the
number and degree of violations, and the results of remedial actions used to eliminate system problems. The deterministic and probabilistic approaches compliment each other in the transmission planning routines. Recent applications of the fuzzy logic technique demonstrate that fuzzy decision-making procedures allow to more adequately, adaptively, and effectively solve many problems. For the reliability and security applications, this approach provides maybe less “accurate” but more practical, robust and convenient algorithms and leaves a place for involvement of expert knowledge and experience of the practicing engineers. In fact, some utility analysts are not completely satisfied with the formal purely mathematical approaches where the complexity and mathematical correctness are in a sharp contrast with the accuracy and availability of the power system data and the assumptions that have to be made to apply these methods. The analysts are looking for practical reliability criteria more adequate to their needs. There is also a growing understanding that the soft risk-based reliability criteria should substitute for the crisp deterministic ones because deterministic indices give low or no risk but lead to high cost decisions in power system planning and control [1]. One of the most advanced reliability analysis programs is the Transmission Reliability Evaluation of Large-Scale Systems (TRELSS) software developed for Electric Power Research Institute by Southern Company. Both deterministic and probabilistic studies can be conducted using this tool. It computes the following reliability indices [8]: failure by contingency with frequency and duration; load curtailment by contingency with frequency and duration; system failure by type with frequency and duration; load curtailment by bus with frequency and duration; system indices (probability of loss of load, frequency, duration, expected unserved energy EUE, expected unserved demand EUD); customer indices (outages, duration, service availability); and normalized indices (energy curtailment, power interruption). TRELSS is widely used in the Southern Company transmission planning, and it has been selected as the core software for implementing of the new index suggested in this paper. This paper explores a new risk-based integrated power system performance index that reflects reliability and security both directly and indirectly in a general fuzzy logic like assessment. Direct characteristics express the risk of load cuts at various load levels and contingencies. Indirect characteristics address such undesirable conditions as circuit overloads, voltage problems, low stability margins, area interchange violations, insufficient generation reserves, unfeasible power flows, etc. II. DEVELOPMENT OF THE INDEX
This Section elaborates a risk-based index that combines both direct and indirect reliability/security indicators. A. Reference Points, Approximation, and Scaling Power system characteristics can be analyzed by comparing them against some preset thresholds that separate fully acceptable, intermediate, and completely unacceptable values. These thresholds have often more or less ap-
proximate nature, and they are set using numerical or physical experiments, statistical analysis, risk assessment, observations, past experience, expert estimates, etc. For example, it may be specified that 0.95 p.u. is the point that separates fully acceptable voltages from the low voltage range where the system can survive but is not allowed to operate continuously, and 0.85 p.u. can be taken as a byconvention threshold for completely unacceptable voltages. The maximum acceptable number of overloaded branches in contingencies with a single element outage may be set, for instance, as 1; if it exceeds this threshold, this situation may be judged as unacceptable, etc. Regardless of the visible degree of uncertainty and discretional choice in definition of these thresholds, their selection is nevertheless a necessary step to decide whether any analyzed parameter π has an acceptable value or not. To concurrently operate with such diverse characteristics as EUE, branch overloads, voltage deviations, number of affected lines or buses, etc., we need to normalize and scale each of these participating parameters. This allows us to get rid of their physical dimension and to map them into the same range of variation. In order to do so, the following scaling can be applied to all parameters π : 1, if π i ≤ π min i π max i − π i (1) , if π min i < π < π max i πi = π max i − π min i 0, if π i ≥ π max i or 0, if π i ≤ π min i π −π min i i (2) πi = , if π min i < π < π max i π π − min i max i 1, if π i ≥ π max i Expressions (1) and (2) reflect two kinds of scaling applied to parameters with different acceptable ranges. Some parameters are normally greater than some specified minimum threshold, for example, the minimum voltage at a bus (1). Other parameters must not exceed a given maximum threshold, for instance, the EUE or branch overload (2). The thresholds π i min and π i max in (1) and (2) are set according to the following scheme: • If π ≥ π i max in (1) or π ≤ π i min in (2) ⇒ normalized parameter is "absolutely” reliable and secure, π i = 0 ; • If π ≤ π i min in (1) or π ≥ π i max in (2) ⇒ normalized parameter is "absolutely” unreliable or insecure, π i = 1 ; • If π i min < π < π i max ⇒ parameter i is of a certain degree of unreliability, that is 0 < π i < 1 . The actual ranges of parameters π i as well as their physical dimensions may be different, for example, kV and MWh/yr. Transformations (1-2) map all diverse characteristics in the range [0,1], p.u. This makes the parameters comparable e.g. a normalized voltage π 1 can be compared to a circuit overload π 2 to determine which violation is
more severe. If π i is “reliable” or “unreliable”, its normalized values π i are 0 and 1 respectively. B. Risk-Based Reliability Index For any parameter π ij observed in contingency j with probability p j , the risk of unreliability/insecurity is: rij = p j π ij
(3)
ability. Without η, because of the low probabilities of contingencies p j , index (7) would be normally very close to 100%. This may create inconveniences for its practical use. By taking η > 1 , the effect of unreliability on R can be made much more detectable. Per cent of reliability is the generalized reliability and security index that is in focus of this paper. We also introduce a closely related index, per cent of unreliability, U = 100% − R (9)
The risk rij is zero if either p j or π ij is zero, and it
C. Handling overwhelmingly important parameters
equals to one if p j = 1 and π ij = 1 . For a set of analyzed
Some of the parameters π may have overwhelming weights with respect to the others. For instance, insufficient stability margins and power flow divergence may indicate a major system failure with a significant loss of load. Weights for these problems are much higher than the weights for circuit overloads or low voltage problems. These dominant parameters can oust the other less important parameters. For example, if a power flow does not exist in contingency j, that is π ij = 1 , i = ’lf divergence’,
contingencies J, the risk of the ith violation is as follows: (4) ri = ∑ p j π ij j∈J
Due to normalization, the individual risks (4) can be summed up for all diverse parameters I to get the overall risk factor ϕ : ϕ = ∑ ϕ i = ∑ wi ri = ∑ p j ∑ wiπ ij (5) i∈ I
i∈ I
j∈ J
i∈ I
In (5), weights wi prioritize contributions of different parameters having an expert evaluation of their relative importance. In (5), factor ϕ is not properly scaled because it depends on the number of analyzed parameters and their weights. To put ϕ in the same framework as any individual parameter π, normalization (1) is applied one more time:
ϕ max = ϕ π
ij =1, ∀i , j
= η −1 ∑ wi "unreliability threshold" i∈I
ϕ min = 0 0, ϕ = 1 − η ∑ p j Π j j∈J 1, where Πj
"reliability threshold"
(6)
if ϕ ≥ ϕ max if ϕ min < ϕ < ϕ max if ϕ = ϕ min = ∑ wi π ij ∑ wi i∈I
i∈I
(7)
is the severity index in jth contingency (contingency rank). Contingency ranks play an important role in understanding the suggested reliability/security index. The ranks account for all violations of monitored parameters. If in contingency j all the parameters violate their unreliability thresholds, then Π j = 1 . If all parameters are admissible then Π j = 0 . If just some of the parameters violate unreliability
thresholds, and/or the degree of violation is less than threshold, then 0 < Π j < 1 depending on the number and severity of violations. The normalized overall risk factor ϕ also varies in the range [0,1]. It is more convenient to express it in per cent: (8) R = 100% ⋅ ϕ = 100% ⋅ 1 − η ∑ p j Π j j∈J We refer to R as a per cent of reliability/security hereafter. If R = 100% , the system is absolutely reliable and secure which means that all parameters π have reliable/secure values in all analyzed contingencies. For example, this can be observed if there are no load cuts, voltage problems, or circuit overloads in all analyzed cases. An additional coefficient η ≥ 1 is introduced to magnify the effect of unreli-
the other parameters can’t be determined at all because most likely we have a system black out where parameters such as overloads have no sense. Also, the ordinary parameters can be sometimes qualified as dominant ones if they hit some thresholds [ π i ≤ π MIN i > π max i for (2)]. These thresholds reflect a dialectic step in qualitative assessment of system reliability or security when the quantitative changes of ordinary system parameters go beyond certain limits. For instance, the number of overloads can be classified as a dominant factor if it exceeds 10. For dominant parameters k ∈ I k , we have
wk >> wl , k ∈ I k , l ∉ I k (10) Ordinary parameters have comparable weights. Dominant parameters π k are treated differently than π l . For one dominant parameter π k > 0 , from (7) and (10), Π j → π kj
(11)
Expression (11) means that if any dominant parameter π kj is greater than 0 in contingency j, then rank (7) is solely determined by this parameter. III. RELATIONSHIP WITH THE OTHER TECHNIQUES
The per cent of reliability index has many meaningful connections to the other indices and techniques. A. Expected Unserved Energy The expected unserved energy, EUE, is a widely used reliability index that is expressed as follows: EUE = 8760∑ p j ∆L j [MWh/yr] (12) where ∆L j is the load loss in contingency j. Similarly to (1), EUE integrates the probability of event p j and its consequences (load loss ∆L j ). The probability p j is understood hereafter as the probability of contingency times the probability of being at certain load level. This similarity makes EUE naturally compatible with the new index.
The load loss can be treated as one of the parameters π i and the corresponding term in (8) will be clearly related to π i = ∆L j ; π min i = 0 ; EUE. Really, if in (2)
π max i = ∆Lmax , where ∆Lmax is the upper unreliability threshold for the load loss, then for the corresponding term in (5) we have: p j ∆L j w ⋅ EUE ϕ i = EUE = ∑ wi p j π ij = ∑ wi (13) = i ∆L max 8760∆Lmax j∈J j∈J Expression (13) means that the term ϕ i= EUE is proportional to EUE. It also demonstrates that the new index can be reduced to EUE by an adequate choice of wi . But note that unlike EUE, the new index can also account for indirect reliability/security characteristics and divergent cases. B. System Minutes of Interruption The SMI index can be represented as follows: SMI = 60 ⋅ EUE βL p = 60 ⋅ 8760 ⋅ EUE E [min]
(14)
0 < β ≤ 1 is a load factor that scales the peak load; E is the consumed energy, [MWh/yr]. It shows a hypothetical fraction of time when all system load would be left without supply with the unserved energy equal to EUE. Expression (14) has an approximate nature because the ratio EUE/E varies along with the load levels in contingencies. If in (2) we take π i = ∆L j ; π min i = 0 ; π max i = L j ,
and, in (5), wi*= SMI , j = 60 ⋅ 8760 ⋅ 8760 ⋅ wi d −j 1 , where wi is the weight of SMI among the other parameters π i≠ SMI , and d j is mean duration of contingency j, [hrs/yr], we get
ϕ i = SMI = ∑ wij* p j π ij = wi ∑ 60 ⋅ 8760 j∈J
= wi ∑ 60 ⋅ 8760 j∈J
j∈J
EUE j Ej
8760 p j ∆L j d jLj
(15)
= wi ∑ SMI j = wi SMI Σ j∈J
Expression (15) demonstrates that the SMI index can be naturally incorporated in the proposed integrated measure, and that with certain assumptions this new measure can be reduced to SMI. Note that the index SMI Σ in (15) is more accurate than SMI given in (14) because it is determined individually for each specific EUE/E ratio. C. Expected Stability Margins In [9,10], new probabilistic concepts of expected voltage and transient angle stability margin, EVSM and EASM were given. These indices reflect an average level of stability margin over the set of possible contingencies, load levels, power transfer requests, etc. They aim to evaluate the overall stability impact of parametric trends (such as load growth), power transfers (such as wheeling requests), and decision-making in power system transmission planning and operations. The EVSM and EASM indices have the following general mathematical expression [9,10]: ESM = ∑ ∑ p j pφ SM jφ (16) j∈J φ∈Φ
of jth contingency; pφ is the probability of φth fault location, fault type, impact or disturbance; J is a set of contingencies and normal operating conditions (base cases); Φ is a set of faults, impacts or disturbances, and SM jφ is either voltage or angle stability margin determined in contingency j at fault/disturbance φ. Values of SM jφ are supposed to be scaled in the same way as parameter π i in (1) or (2) so that SM
jφ
= 1 corresponds to a sufficient stability margin,
and SM jφ = 0 to instability. In this formulation, the ESMs can be easily accounted for in the new index. In order to do this, we can use (5) as follows: (17) ϕ SM = ∑ p j ∑ wφ pφ (1 − SM jφ ) φ ∈Φ 123 14243 j∈J w*φ
where L p is the peak load in the system, [MW];
the following SMI related term in (5):
where ESM is either EVSM or EASM; p j is the probability
π jφ
Expression (17) combines reliability and stability in one general probabilistic criterion. This is a possible way to include stability as a contributing factor to reliability. D. Contingency Ranking Parameters r j = p j Π j determined by (7) and used in (6) can be applied for contingency ranking. If the list of controlled parameters I monitored at the contingency screening stage includes various system problems and violations such as branch overloads, voltage problems, load flow divergence, and system separation, then the low ranks r j help to identify contingencies that can be eliminated from further consideration. These low rank contingencies include the ones without system problems, with minor system problems, and low probability. E. Contribution of different factors to reliability/security Expression (5) can be rewritten as follows: ϕ = ∑ ϕ i = ∑ wi ρ i = ∑ ∑ wi p j π ij (18) i∈I
i∈I
i∈I j∈J
Parameters ρ i is determined for all contingencies and base cases, so that ∑∀j p j = 1 , and that π ij = 0 for j ∉ J . Then
ρ i = ∑ j∈J p j π ij is the mean violation of the ith parameter determined as an expected value. These are probabilistic analogs for such deterministic characteristics as the average degrees of the number of overloads, voltage problems, etc., per contingency. Parameters ρ i can be also computed for only these contingencies where parameter π ij is violated, i.e. ρˆ i = ∑ j∈J p j π ij ∑π ij >0 p j . This is a conditional value showing the average degree of violation if it occurs. Normally, ρˆ i >> ρ i . Parameters ρ i and ρˆ i can be used by themselves to evaluate different reliability/security factors as random variables. Parameters ϕ i in (18) are calculated as weighted mathematical expectations of analyzed security and reliability parameters. By considering them separately, the in-depth reasons of unreliability can be revealed – see an example in Section IV.
F. Fuzzy Logic An clear analogy between the scaling functions used in (1), (2) and (6) and membership functions used in fuzzy logic methods is seen. More complicated shapes of these functions as well as more advanced sets of rules for their processing may be applied. For instance, voltage magnitudes can be scaled with the help of a trapezoidal mapping with unreliability ranges set for both high and low voltages. One may argue that the proposed index is too subjective because it involves too many thresholds, scaling functions, and rules determined by the system operator. In our view this flexibility is rather an advantage because power utilities may be willing to work out their individual sets of monitored parameters, limits, membership functions, priorities, and rules of processing to get integral reliability assessments reflecting their needs. IV. NUMERICAL TESTS
Numerical studies have been conducted for a real largescale multi-area power system derived from (but not identical to) the real Southern System located in several Southeastern States. Southern Company is one of the largest power utilities in the USA. The Company and its divisions dominate the top places in the 1998 TQS Research US national benchmark survey of the 70 largest energy utilities in the USA, scoring high in customer loyalty, overall satisfaction and value. Savannah Electric is rated No. 1 in reliability, followed by Georgia Power and Alabama Power. Savannah Electric and Georgia Power score at the top of the list on restoring power in a timely manner and in overall electric reliability. Georgia Power is also recognized as the first in finding ways to solve problems. The Southern Company reliability assessment technology is designed to cope with such emerging industry issues as oversized electrical network, multitude of possible contingencies, multi-area structure, substantial annual load growth and extreme weather-related loading conditions, unpredictable power transfers and wheeling, diverse system expansion and reinforcement projects, etc. The technology allows adequately evaluating power system reliability, making forecasts for the future trends, identifying weak elements causing unreliability, assessing the impact of system reinforcements, etc. A core part of this technology is the reliability assessment tool TRELSS owned by EPRI and supported by Southern Company Services, Inc. In this study, a new Version 5B7 of TRELSS has been used. Besides many new advanced features, this version produces some additional reports that allow computing the new index. The system model contains more than 4400 busses and 6400 lines and transformers. The voltage levels are 500, 230, and 115 kV. Some small fractions of the 46 kV network are presented as well. The scheme consists of 5 power companies (Alabama, Georgia, Gulf, Mississippi, and Savannah Power Companies), and 24 divisions. Reliability assessments have been conducted for one of the Southern Company Divisions located in Alabama. The summer peak conditions were analyzed for six subsequent
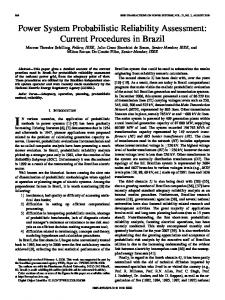
years to check the annual trend, to reveal the main contributing factors to unreliability, and to analyze the effect of planned system reinforcement projects. Simulations were conducted at 40, 50, 60, 70, 80, 90, and 100% of the summer peak load. All contingencies including single circuit outages, single generation unit outages, and one circuit plus one generation unit outages are considered. Contingencies have been screened to eliminate cases without system problems from any further reliability studies. Table 1 summarizes the set of monitored parameters I as well as their weights and threshold values. The magnifying coefficient η was set to 10. The annual change of the per cent of unreliability index U is shown in Fig. 1. Many important and practically sound observations can be derived using Fig. 1. The shape of the resulting percent of unreliability/insecurity curve is rather similar to the shape of the normalized EUE curve. The reason is that the EUE weight is specified to be 2.5 times higher then the weights of the other non-dominating parameters. The sharp decreases of unreliability are observed in the years 2000 and 2004. They are explained by anticipated load decrease at several busses within the study area in 2000, and by introducing a new 115 kV line that creates an alternative supply corridor, relieves overloads, and eliminates load loss in the most influential 115 kV subsystem. These two factors keep the per cent of unreliability index below 0.1 %. Nevertheless the parameters with lower weights (numbers of overloads and voltage problems) also contribute to the resulting unreliability/insecurity curve. First, due to contributions of the indirect parameters, the resulting curve goes well above the normalized EUE curve. Second, despite the similarity with the EUE curve, the indirect parameters modify the inclination of the resulting curve. TABLE 1. WEIGHTS & THRESHOLDS OF PARAMETERS Parameters
π min i π max i
Type of π MIN i Scaling
Number of overloads No. of voltage problems Load flow divergence
no
yes
none
Load loss, MW
0
10
(2)
π MAXi
wi
0
3
(2)
_
6
2
0
3
(2)
_
10
2
yes
dominant
30
5
_
Per Cent of Unreliability
0.1 0.09 0.08
Contibution of Overloads
0.07 0.06 0.05 0.04
Contribution of Low Voltage Problems
0.03 0.02 0.01 0 1999
2000
2001
2002 Year
2003
2004
Contibution of Unserved Enegy
Fig. 1. Per cent of unreliability and its contributing factors
At any point, the percent of unreliability is equal to the sum of normalized contributions of all monitored parameters. For example, in the year 2002, the per cent of unreliability can be presented as follows: U = U EUE + U Voltage Problems + U Overloads = 0.068% = 0.038% + 0.019%
+ 0.011%
This property allows evaluating the degree of their contribution and displays the in-depth reasons of unreliability. Really, the sharp improvement of unreliability in the year 2000 is explained by a steep decrease of voltage problems caused by the load decrease in the area and leading to a decrease of EUE. In fact, due to amount of low voltage problems, their normalized indirect contribution to 1999 unreliability is more significant than the contribution of EUE! Both voltage problems and overloads cause the 2001 deterioration of reliability and security. In the next year, the increasing number of voltage problems is mainly responsible for the increase of unreliability. For the next year increase, overloads contribute more than low voltage problems. The radical improvement of reliability in 2004 can be explained by a very efficient system reinforcement project. V. CONCLUSIONS
This paper develops a new reliability and security index that reflects both direct and indirect characteristics. Direct characteristics deal with the risk to not fully supply load in various contingencies. Indirect characteristics address such undesirable conditions as circuit overloads, voltage problems, low stability margins, area interchange violations, insufficient generation reserves, unfeasible power flows, etc. Although indirect characteristics do not necessarily cause load losses, they nevertheless signal about a reduced security/reliability margin. This reduced margin may lead to sometimes hardly predictable and quantifiable load losses (via remedial actions, islanding, and instability), unforeseen events (cascading outages), severe system failures (voltage collapse), etc. The new index gives a more comprehensive answer regarding the general degree of both reliability and security in the system by combining diverse contributing factors using a fuzzy logic like approach. It is designed to flexibly accommodate various priorities and admittance of power utilities regarding particular characteristics integrated in the index. The existing indices such as expected unserved energy, system minutes, stability margins, and others can be linked to or derived from the general index. The index meets the need in a practical, flexible, and effective security and reliability index. VI. BIBLIOGRAPHY [1] R. J. Ringlee, P. Albrecht, R. N. Allan, M. P. Bhavaraju, R. Billinton, R. Ludorf, B. K. LeReverend, E. Neudorf, M.G. Lauby, P. R. S. Kuruganty, M. F. McCoy, T. C. Mielnik, N. S. Rau, B. Silverstein, C. Singh and J. A. Stratton, “Bulk Power System Reliability Criteria and Indices Trends and Future Needs”, IEEE Trans. on Power Systems, Vol. 9, No. 1, February 1994.
[2] J. A. Momoh, Y. V. Makarov and W. Mittelstadt, “A Framework of Voltage Stability Assessment in Power System Reliability Analysis”, IEEE Trans. on Power Systems, Vol. 14, No. 2, 1999, pp. 484-491. [3] IEEE Working Group on Measurement Indices, C.C. Fong, Chairman, “Measuring Bulk System Reliability - Measurements and Indices”, IEEE T-PWRS, Vol. 4, No. 3, August 1989, pp. 829-835. [4] M.P. Bhavaraju et al, “Requirements for Composite System Reliability Evaluation Models”, IEEE Transactions on Power Systems, Vol. 3, No. 1, February 1988, pp. 149-157. [5] O. Bertoldi, R.N. Allan, G.J. Anders, R. Butler, E.N. Dialynas, G. Douard, E. Landeck, L. Salvaderi, and M.T. Schilling, “Methods and Techniques for Reliability Assessment of Interconnected Systems”, CIGRE Task Force 38.03.11, O. Bertoldi (Governer), 1998. [6] R. Billinton and R. N. Allan, Reliability Evaluation of Engineering Systems: Concepts and Techniques, Plenum, New York, 1983. [7] R. Billinton and R. N. Allan, Reliability Evaluation of Power Systems, Plenum, New York, 1984. [8] M. Kumbale, T. Rusodimos, F. Xia, and R. Adapa, TRELSS: A Computer Program for Transmission Reliability Evaluation of Large-Scale Systems, EPRI TR-100566, Research Project 3833-1, Vol. 2: User’s Reference Manual, April 1997. [9] J. A. Momoh, Y.V. Makarov, M. Elfayoumy, and W. Mittelstadt, “Expected Voltage Stability Margin”, Proc. Large Engineering Systems Conference on Power Engineering, Halifax, Canada, June 7-9, 1998. [10] J. A. Momoh, Y. V. Makarov, and M. Elfayoumy, “Expected Angle Stability Margin”, Proc. 1998 IEEE Intl Conference on Systems, Man and Cybernetics, La Jolla, California, October 12-15, 1998. Yuri V. Makarov (M’97, SM’99) received his M.Sc. degree in Computers and Ph.D. in Electrical Engineering from the Leningrad Polytechnic Institute (now St. Petersburg State Technical University), Russia, in 1979 and 1984 respectively. From 1990 to 1997 he had been an Associate Professor at the Department of Electrical Power Systems and Networks in the same University. From 1993 to 1998 he had conducted his research at the University of Newcastle, University of Sydney, Australia, and Howard University, USA. Now he is with the Transmission Planning Department, Southern Company Services, Inc., Birmingham, Alabama. His current activities are around various theoretical and applied aspects of power system analysis, planning and control. Nader S. Moharari (M’86) received his B.S. degree in Electrical Engineering from Tehran Polytechnic in 1983. He received his M.S. degree in Electrical Engineering from University of Tennessee at Chattanooga in 1989. N. S. Moharari received his Ph.D. in Electrical Engineering from Georgia Institute of Technology in 1993. He joined Southern Company Services, Inc. in 1993. He has been involved in different research and planning activities in the areas of energy conversion, power system dynamic security assessment, artificial neural networks, electric load forecasting, generation planning, transmission planning and demand side management. He is currently the project manager of Reliability & Risk Analysis group of Transmission Planning. Dr. Moharari is a member of IEEE and the Power Engineering Society (PES). He is also an individual member of CIGRE.