KEYWORDS â operations, security, deterministic, probabilistic, risk, reliability criteria, decision-making. .... violations of reliability criteria in terms of expected overloads ... typically involving large numbers of computer simulations, are defined by ...
PROBABILISTIC SECURITY ASSESSMENT FOR POWER SYSTEM OPERATIONS Prepared by the Task Force on Probabilistic Aspects of Reliability Criteria of the IEEE PES Reliability, Risk, and Probability Applications Subcommittee Task Force Contributing Members: J. McCalley (chair), S. Asgarpoor, L. Bertling, R. Billinton, H. Chao, J. Chen, J. Endrenyi, R. Fletcher, A. Ford, C. Grigg, G. Hamoud, D. Logan, A.P. Meliopoulos, M. Ni, N. Rau, L. Salvaderi, M. Schilling, Y. Schlumberger, A. Schneider, C. Singh.
ABSTRACT – Control room operators are faced with frequent security-economy decision-making situations necessitated by stressed system operating conditions, and there is increased need for securityeconomy decision-support tools. Although probabilistic methods are promising in this regard, they have been mainly used in planning environments. This task force paper explores their use for operational decision-making, comparing them to the more traditional deterministic approach. Two examples are used to facilitate this comparison via overload and low voltage security assessment to identify secure regions of operation for a small 5-bus system and for the IEEE Reliability Test System. The results of this comparison show that the probabilistic approach offers several inherent advantages. KEYWORDS – operations, security, deterministic, probabilistic, risk, reliability criteria, decision-making.
I. INTRODUCTION In many countries today, the introduction of competitive supply and corresponding organizational separation of supply, transmission, and system operation has resulted in more highly stressed operating conditions and more vulnerable networks. As a consequence, the need is increased to identify the operational security level of a transmission system. Here, we regard security as the ability of the system to withstand the effects of contingencies in terms of branch loads, bus voltages, and dynamic response. The determination of security levels, for given operating conditions, traditionally has been done using deterministic criteria. Under deterministic criteria, an operating condition is identified as secure if it can withstand the effects of each and every contingency in a pre-specified contingency set. “Withstanding the effects” means that the given contingencies will not violate loading or voltage criteria or make the system unstable. If one or more contingencies are in violation, the operating state is often called an alert state. In such a case actions are taken to move the system into the secure region. If no disturbances are in violation, then no action is necessary, but actions can be taken to enhance the economic efficiency of the energy delivered to the end-users. It is easy to recognize a decision-making problem in the above process; the decision is whether to take actions and if so, what kind and how much. The deterministic method provides a simple rule for use in making this decision: optimize economy within hard constraints of the secure operational region. It is this simplicity that has made the deterministic method so attractive, and so useful, in the past. Today, however, with the industry’s emphasis on economic competition, and with the associated increased network vulnerability, there is a growing recognition that this simplicity also carries with it significant subjectivity,
and this can result in constraints that are not uniform with respect to the security level. This suggests that the ultimate decisions that are made may not be the best ones. It is known that probabilistic methods constitute powerful tools for use in many kinds of decision-making problems. It was recognized several years ago that these methods could be used to enhance security-economy control room decision-making [1], and there is great interest in doing so today. For example, the US Western Systems Coordinating Council (WSCC) has had interest in developing probability-based reliability criteria [2]. A CIGRE report [3] recommended further study of probabilistic security assessment methods, and a later CIGRE task force, 38.02.21, was tasked with implementing this recommendation. There was a panel session dedicated to this subject at the 1999 PES Summer Meeting [4 - 7]. Another panel session at this same meeting focused on risk-based dynamic security assessment [8-11]. The Electric Power Research Institute (EPRI) was also involved in efforts to develop probabilistic risk assessment tools for security assessment, and an early work on this was [12]. The theme of most of this work is that security level can be quantitatively assessed using one or more probabilistic metrics. Although the industry has not reached a conclusion regarding which probabilistic metrics are best, there is consensus that using them has potential to improve analysis and decision-making. Despite the perceived drawbacks of deterministic methods and promise of probabilistic methods, it is prudent to proceed carefully in embracing probabilistic security assessment for operations. The objective of this paper is to compare probabilistic security assessment with deterministic security assessment within an operational context. The comparison is based on assessment results of each method. Some approaches for determining appropriate risk levels are discussed, but we make no recommendation regarding selection of a particular risk level, believing this is best done by an individual operating company in conformance to its reliability criteria. Section II reviews the bulk transmission reliability criteria used by the North American electric power industry, and Section III highlights important differences between planning and operations for probability-based reliability assessment and comments on the terminology used. Section IV summarizes the steps taken in the deterministic and probabilistic approaches to security assessment. Section V describes the probabilistic index used in this study. Study results for a 5-bus system and for a constrained interconnection in the IEEE Reliability Test System (RTS) are given in Sections VI and VII, respectively. Section VIII provides interpretation and explanation of the differences in the results. Section IX identifies different decision-making strategies, and Section X concludes.
II. RELIABILITY CRITERIA Reliability criteria are rules by which the performance of an electric power system in reacting to component failures can be judged acceptable or unacceptable. As discussed later, these criteria are very different in deterministic and probabilistic studies. Deterministic criteria are usually expressed in terms of “tests” where the system is required to withstand a predetermined set of disturbances. Probabilistic criteria are based on cut-off points of reliability indices [3, 13]. A recently developed approach using “system well-being” concepts [8, 14] allows the determination of the probability that deterministic criteria are satisfied. Review of the existing NERC reliability criteria [15] together with reliability criteria used by individual North American reliability councils [16-24] reveals a dominating philosophy that has been used for many years both in planning and in operations. This philosophy is articulated in [16] as “a higher level of performance is required for disturbances generally having a higher frequency of occurrence,” and it is often embedded in the so-called disturbance-performance criteria, which specify different classes of allowable performance for different classes of disturbances. It is easy to recognize two key attributes within this philosophy: the probability (or frequency) and severity (or performance) of disturbances. These two attributes comprise the elements of a probabilistic expected value, the expectation, of the severity. This expectation is often called “risk.” Risk has been used for many years, at least qualitatively, in establishing the philosophy by which the industry has judged reliability levels; quantitative use of risk in operational decision-making can therefore be viewed as a change in method, but not in principle. The difficulty with deterministic criteria is that, in terms of risk, the criteria may result in inconsistent decision-making. Low-risk cases may be included in studies and high-risk cases omitted from studies, and these dangers may remain hidden because deterministic studies do not quantify risk. The difficulty with probabilistic criteria is in defining them to the satisfaction of planners and operators. Hence, very few such criteria exist. This paper discusses this problem, and in particular, Section IX addresses the creation of criteria equivalent to existing ones. III. OPERATIONS vs. PLANNING Probability-based reliability assessment approaches for generation and transmission has been well developed for use in planning-related decision-making [25]. Yet, the standard approaches on which most commercial grade programs are based may need further refinement for use in operational decision-making. One reason for this is that the nature of the decision is quite different. Long-term planners identify the facilities necessary to satisfy reliability criteria for the range of expected operating conditions. The decision is then whether or not to reinforce the facilities. In contrast, operational planners
identify the operating limits within which reliability criteria are satisfied. The decision is whether or not to take action to modify the operating conditions. This fundamental difference has two important implications, one on the loading conditions to study and another on the type of indices to calculate. First, in regards to loading conditions, the planning-based assessment approach emphasizes heavy loading conditions in the time frame of interest (e.g., the next 5 years) since facility designs satisfying them are generally able to satisfy other less loaded conditions. In contrast, the operations-based assessment approach emphasizes the expected loading conditions in the time frame of interest (e.g., the next hour or the next three hours) since the operator always wants to know whether the upcoming conditions will be safe. Second, in regards to probabilistic indices, the planningbased assessment approach results in the well-known and useful indices such as loss-of-load probability and expected unserved energy. These indices require an assumption on the conditions under which an operator decides to manually interrupt load. Yet, because assessment indices for operational purposes are used to aid the operator’s decision-making, these indices should be independent of any assumption on that decision-making. Rather, in operations, manual load interruption should be treated as one alternative among several, and the assessment index can be used to evaluate each alternative independently. This approach reflects the recognition that assessment and decision are two separate steps within decision-making problems. One index that is appropriate in this sense, described in Section V, reflects violations of reliability criteria in terms of expected overloads and undervoltages. Another reason why planning-based reliability assessment approaches may need further refinement for use in operational decision-making is that the two decision problems address different time frames and consequently may require different treatments of certain types of uncertainty. For example, variability in short-term load forecasts, which constitutes a key uncertainty for operational assessment, is typically small enough so that it may be handled using fast, linearized techniques [10, 26]. In addition, operational decision-making must accommodate time-dependent failure rates since factors such as weather cause significant hourly variation in these rates. A final comment in this section concerns the terminology adequacy and security. In much of the literature e.g., [3, 13, 15, 25, 27-29], reliability criteria in terms of violations of static failure conditions are called adequacy criteria, and criteria based on dynamic factors are called security criteria. In practice, however, operators tend to use the term security to cover both aspects of reliability. This is because their central concern is to identify the limits of acceptable operating conditions, and they need an umbrella word to capture the failure conditions that motivate the necessity for the limits. These include both static and dynamic failure conditions: overload, undervoltage, voltage instability, transient (early swing) instability, transient voltage dip, and oscillatory (damping) instability. In order to retain simplicity, this paper focuses only on operating limits imposed by overload and low voltage
violations. By the above definitions, these are clearly “adequacy” issues. While in deference to the operators’ point of view and terminology, this paper is deemed to be on “security” assessment, in the language of much of the power system reliability literature it would be considered a paper on adequacy. On the other hand, although voltage and transient instability are not addressed, the conclusions are applicable to the operating limits imposed by them as well. IV. DETERMINISTIC and PROBABILISTIC PROCEDURES Security assessment in operations is performed in two stages. Operational planning engineers study expected future conditions off-line to identify operating rules. Operators then utilize these rules together with EMS security assessment software to assess system security levels and make decisions regarding preventive and corrective actions. A common way of illustrating the rules is to form a security boundary that separates acceptable and unacceptable regions of operation. The security boundary is developed via repeated contingency simulations to identify operating conditions that just meet the post-contingency performance evaluation criteria. These boundaries can be visualized using security boundary diagrams, often referred to as nomograms in the industry, that use coordinate axes to represent precontingency values of the operational parameters such as flows, generation levels, or load levels. Nomograms not only indicate whether operating conditions are secure; in addition, they provide a way to gauge the system security level based on operating point proximity to the security boundary. Although security assessment may be done without actually forming a security boundary diagram, this device serves to illustrate well the attributes of deterministic assessment. We describe deterministic assessment in these terms in Section IV.1. This provides the basis of comparison for the probabilistic procedure, which is described in Section IV.2. IV.1 Deterministic Assessment In deterministic security assessment, the decision is founded on the requirement that each outage event in the contingency set results in system performance that satisfies the chosen performance evaluation criteria. These assessments, typically involving large numbers of computer simulations, are defined by selecting a set of network configurations (i.e., network topology and unit commitment), a range of system operating conditions, a list of outage events, and the performance evaluation criteria. Study definition requires careful thought and insight because the number of possible network configurations, the range of operating conditions, and the number of conceivable outage events are each very large, and exhaustive study of all combinations of them is generally not reasonable. Consequently, the deterministic approach has evolved within the electric power industry to minimize study effort yet provide useful results. This approach depends on the application of two criteria during study development:
Credibility: The network configuration, outage event, and operating conditions are reasonably likely to occur. Severity: The extent to which failure criteria are violated. Obviously, states with line overloads of 104% and 110% are different in severity. The outage event, network configuration and operating condition on which a decision is based must be the most severe system performance, i.e., there should be no other credible combination of outage event, network configuration, and operating condition which results in more severe system performance. In this paper, we are explicitly interested in studies conducted for the purpose of identifying operational limits for use by the operator. In this case, the study focuses on a limited number of operating parameters such as flows on major transfer paths, generation levels, or load levels for a specific season. We call these the study parameters. Application of the deterministic approach consists of the following basic steps: 1. Develop power flow base cases corresponding to the time period (year, season) and loading conditions (peak, partial peak, off peak) necessary for the study. In each base case, the unit commitment and network topology are selected based on the expected conditions for the chosen time period. The topologies selected are normally all circuits in service; here, credibility is emphasized over severity. Sometimes sensitivity studies are also performed if weakened topologies are anticipated. 2. Select the contingency set. Normally this set consists of credible events for which post-contingency performance could be significantly affected by the study parameters. In deterministic studies, the “N-1” rule, where events are limited to only those involving loss of one component, is often used to identify what is credible. 3. Select the study parameters and identify their ranges of operating conditions expected during the time period of interest. We refer to this as the study range. 4. Identify the event or events that “first” violate the performance evaluation criteria as operational stress is increased within the study range. We refer to these events as the limiting contingencies. If there are no such violations within the study range, the region is not securityconstrained, and the study is complete. 5. Identify the set of operating conditions within the study range where a limiting contingency “first” violates the performance evaluation criteria. This set of operating conditions defines a line (for two study parameters), a surface (for three) or a hyper-surface (for more than three) that partitions the study range. This line, surface, or hypersurface is the security boundary. 6. Condense the security boundary into a set of plots or tables that are easily understood and used by the operator. IV.2 Probabilistic Assessment In the probabilistic analysis performed in this work, we utilize an index that reflects the composite security level associated with the values of the chosen study parameters. There are a number of different indices that could be chosen. We have
selected one that is reasonable, and it is described in Section V. We think it unlikely that use of alternative probabilistic indices in our study would significantly influence the conclusions. The probabilistic study procedure retains the 6 basic steps described in the preceding section. However, steps 2, 4, and 5 are different. They are modified to read: 2. Select the contingency set. This set is usually created by state enumeration rather than by preselecting a limited number of component outage states. The enumeration process must be terminated by some rule, e.g., a predetermined minimum contingency probability level. This and other rules are discussed in [30-31]. 4. Evaluate the probabilistic index throughout the study range. Decide on a particular threshold level beyond which operation is deemed unacceptable. 5. Identify the set of operating conditions within the study range that have an index evaluation equal to the threshold level. This set of operating conditions constitutes the line (for two study parameters), a surface (for three) or a hypersurface (for more than three) that partitions the study range. This line, surface, or hypersurface represents the security boundary; it delineates between acceptable and unacceptable regions of operation. Remark 1: There are a number of methods by which one can make the decision associated with step 4. We address this issue in Section IX. Remark 2: In the next section, we propose using the product of probability and severity, or risk, as the probabilistic index. In this case, step 5 results in a contour or surface of constant risk. Remark 3: In step 6, the deterministic security boundary is replaced by an iso-risk boundary. The fact that step 6 is essentially the same means that operators need not see any difference in how the two approaches are presented. V DESCRIPTION OF PROBABILISTIC INDEX Our choice of a probabilistic index is shaped by the recognition that an important objective of security assessment is to assess the future. This objective is sometimes unrecognized because traditional on-line analysis makes use of the most recent state estimation whose results are descriptive of past operating conditions. Yet, these results can be used to extend the assessment into the future so that decisions can be made on expected future conditions. However, such an extension requires not only a forecast of future operating conditions but also appropriate models of forecast uncertainty. We wish to assess the security level of a power system for the purpose of making a decision that will be effective for some future time period. For purposes of illustration, assume that there is only one failure condition (line overload or low bus voltage) of interest to the study. This failure condition is characterized by a post-contingency performance measure X such as a post-contingency line flow or bus voltage. This performance measure depends on the contingency condition and loading condition. The loading condition is predicated on the
last state estimation results and a forecast of the loading condition at the future time period. The performance measure associated with the forecast loading condition and the ith possible contingency is denoted as X(f,i). Although it is a function of the forecast time, we do not include the time dependency here in order to retain notational simplicity. Since the forecast is uncertain, the actual loading condition may differ from the forecasted loading condition. Therefore, the performance measure associated with the jth possible loading condition and ith possible contingency is denoted by X(j,i). Denoting the ith contingency as Ei, a risk index, given the forecasted conditions, is computed by summing over all possible outcomes the product of the outcome probability and severity: (1) Risk = Pr( E i ) Pr( X (j, i) | X (f, i) )Sev ( X (j, i) )
∑∑ i
j
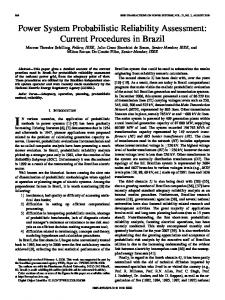
Pr(X(j,i) | X(f,i)) provides the probability of X(j,i) and thus represents the load forecast uncertainty; it is obtained from a probability distribution of the loading conditions. Assuming we can forecast the loading conditions at each bus with high accuracy, it is appropriate to model the uncertainty in each bus load forecast with a normal distribution having a mean equal to the forecasted values and a small variance. Under this condition, it is possible to show that X(j,i) also follows a normal distribution [10, 26]. Equation 1 must be calculated for each different postcontingency performance measure of interest to the study, and total risk is the sum of each of these calculations. The events Ei, which represent one occurrence (the next occurrence) of contingency i, are assumed to be Poisson distributed so that their probabilities may be computed based on the associated failure rates. Other distributions may be used if appropriate. A severity function Sev(X) is introduced which quantifies the severity of the network condition in terms of performance indicators; they may be, for this paper, either circuit flow or bus voltage. One might think of characterizing the severity with cost, but this introduces another level of significant uncertainty beyond that reflected by performance measures (e.g., what is the cost of an overload at 104% of rating?) that is difficult to model accurately. In addition, operators, when making security-related decisions, are generally most comfortable with indices that have intuitive and physical significance. One simple approach is to assign 1 as the severity if the performance measures violate their ratings, and 0 otherwise. The disadvantage of this approach is that it does not measure the extent of the violation. For example, it would not capture the difference between a 101% loading and a 110% loading, although clearly the latter is more severe. Continuous severity functions provide for measure of violation extent. These severity functions, for overload and low-voltage, are illustrated in Figure 1. For each circuit and bus, they increase linearly from 0 at a performance level just within the ratings (reflecting the operational perspective that performance “close” to the rating is also risky), and they evaluate to 1.0 at the deterministic limits, increasing linearly as conditions exceed these limits. Other severity functions are clearly possible, and it is not advocated that the ones chosen here are best. Rather, it is recognized that they are simple and well serve to illustrate the
basic features of probabilistic assessment. This is satisfactory to compare probabilistic assessment to deterministic assessment.
Fig. 1: Overload and low-voltage severity functions VI
CASE STUDY 5-BUS TEST SYSTEM
Comparison for a 5-bus test system is described in this section. Data for the system are listed in Tables 1 and 2. The ratings given in Table 2 are emergency overload ratings. Figure 2 shows a system one-line diagram. There are 5 buses and 8 branches in this system. The study parameters in this case are real power load of Bus 3 (P3) and real power load of Bus 4 (P4). Bus 1 2 3 4 5
Table 1: Bus Parameters for 5-bus test system kV Rating Load (MVA) Generation (MVA) 230 0 --230 0 0 115 180+100j 0 115 50+30j 0 115 0 40+30j
Type Swing PQ PQ PQ PV
Table 2: Branch Data for 5-bus test system (impedances on 100 MVA base) Branch
Type
Tap
1 2 3 4 5 6 7 8
line line xfmr xfmr line line line xfmr
--0.9545 0.9545 ---1. 05
1
1
p-Bus No. 1 1 2 2 3 4 4 1
q-Bus No. 2 2 3 3 4 5 5 5
Z (pu) 0.0244+j0.1302 0.0244+j0.1302 0.0033 + j0.0950 0.0033 + j0.0950 0.5372+j0. 8264 1.0744+j1.6529 1.0744+j1.6529 0. 0062+j0. 0207
Rating (MVA) 200 200 220 220 284 44 44 60
3
2
3
4
2
8
5 6
7
5
4
Fig. 2: 5-bus test system Steps 1, 2, 3 for Deterministic and Probabilistic Studies In step 1, the analyst constructs the base case according to the expected system conditions. Bus 1 is the swing bus (V=1.1) and Bus 5 is a PV bus (V=1.0). There are generators connected
to Bus 1 and 5. We assume that possible security violations exist only for low voltage problems at buses 2, 3, 4 and overload problems on lines 1, 2, 5, 6, 7. In this study we assume that step 2 results is the same contingency set for the deterministic and probabilistic evaluations. In both, we select the contingency set as those N-1 contingencies that might cause violations in the identified components: • Lines 1 and 2 outages with yearly outage rate of 0.2; • Line 5 outage with yearly outage rate of 0.1; • Line 6 and 7 outages with yearly outage rate of 0.7. Step 3 requires identification of the study parameters and their ranges; they are: • Real power load of Bus 3; change from 5 to 280 MW • Real power load of Bus 4; change from 1 to 120 MW A dispatch policy is assumed where generation at buses 1 and 5 compensate for 85% and 15%, respectively, of load variation. Steps 4, 5 for Deterministic Method The task of step 4 is to identify limiting contingencies. The performance evaluation criteria is: • Post-contingency bus voltages should be at least 0.95 pu. • Pre-contingency circuit flow should not exceed the circuit’s continuous rating. • Post-contingency circuit flow should not exceed the circuit’s emergency rating. Power flow analysis indicates that there are, within the study range, three violations of the criteria. They are: 1. Post-contingency overload of line 2 for outage of line 1. 2. Post-contingency under-voltage of bus 4 for outage of line 5. 3. Post-contingency overload of line 7 for outage of line 6. In step 5, we identify the security boundary in the space of the study parameters. Figure 3 illustrates the deterministic security boundary (bold lines). Steps 4, 5 for Probabilistic Method In step 4, we evaluate the probabilistic index, risk within the study region. Use of the continuous severity functions results in continuous variation in risk throughout the operating region. This provides that contours of constant risk, iso-risk curves, may be identified as in Figure 4, from which we make the following observations: 1. The deterministic boundary reflects significant risk variation. This is illustrated in Figure 4b, which shows the risk level for points A – E along the deterministic boundary. The risk of points B and D are larger than that of C because points B and D are located at the intersection of two different deterministic constraints and therefore incur risk from both of them, whereas point C, like points A and E, incurs risk from only one deterministic constraint. From Figures 4a and 4b, we conclude risk along the deterministic boundary varies significantly. 2. Although small, risk is non-zero inside the deterministic boundary. This is caused by effect of uncertainty in operating conditions, which causes the risk of any operating point to be influenced by system performance of operating points near to it. 3. The risk increases continuously as the operating conditions
become more stressed. This is caused by the fact that the severity functions are continuously increasing with stress.
total north-to south flow and the bus 23 generation. These parameters are varied according to:
Fig. 4b: Risk for points A–E along deterministic boundary Fig. 3: Deterministic security boundary
∆P23 = −∆P13
∆ Parea3 = − ∆ Parea1
Fig. 4a Risk contour VII CASE STUDY IEEE Reliability Test System In this section, we use a modified version of the IEEE Reliability Test System (RTS) [32] for the comparison. Figure 5 shows the system. As indicated in this figure, the system has been divided into three areas. The basic idea is that significant north-to-south transfer causes high flow through area 2 and the interconnections between areas 1 and 3, and it heavily affects some corresponding overload and voltage problems. Area 2 can alleviate the severity of these problems by shifting generation from its bus 23 to its bus 13. Thus the study parameters are the
(2)
(3) Steps 1, 2, 3 for Deterministic and Probabilistic Studies In step 1, the analyst constructs the base case according to the expected system conditions. In this case, since we use a well-known test system, we describe only the changes that were made from the data reported in [32]. These changes were made so as to contrive a security-constrained region and include: • Line 11~13 is removed. • Set terminal voltage of the Bus 23 generator to 1.012 pu and bus 15 to 1.045pu. • Shift 480 MW of load from buses 14, 15, 19, 20 to bus 13; • Add generation capacity at buses 1 (100 MW unit), 7 (100 MW unit), 15 (100 MW unit, 155 MW unit), 23 (155 MW unit). • Change the outage rate of Line 12~23, 13-23, 11-14 to 0.1 1,5, 10, respectively, so their outage rates have significant difference. Once again, we assume that step 2 results in the same contingency set for the deterministic and the probabilistic evaluations. In both the contingency set is limited to all N-1 contingencies that might cause overload or voltage problems limiting the north-to-south transfer. This set includes: • Circuit outages: 12~23 out; 13~23 out; 12~13 out; 15~24 out; 14~11 out; 20~23 out; 14~16 out; 12~ 9 out; 12~10 out • Generator outages: 350 MW unit at bus 23; 197 MW unit at bus 13; 400 MW unit at bus 21; 100 MW unit at bus 7. In step 3, we identify the study parameters and their ranges as: 1. Generation at bus 23: 303 MW ~ 903 MW.
2. North-South flow (i.e. combined active power flow on lines 15-24, 14-11, 23-12 and 13-12): 455 MW ~ 1100 MW.
Steps 4, 5 for Probabilistic Method In step 4, we evaluate the probabilistic index, risk within the study region. The contours of constant risk, iso-risk curves, are
Fig. 6: Deterministic security boundary
Fig. 5: Modified IEEE RTS’96 system Steps 4, 5 for Deterministic Method The task of step 4 is to identify limiting contingencies. The performance evaluation criteria is: • Post-contingency bus voltages should be at least 0.95 pu. • Pre-contingency circuit flow should not exceed the circuit’s continuous rating. • Post-contingency circuit flow should not exceed the circuit’s emergency rating. Power flow analysis indicates that there are, within the study range, four violations of the criteria. They are: 1. Post-contingency overload limit of line 13~23 due to contingency 12~23 outage. 2. Post-contingency voltage limit of bus 12 due to contingency 13~23 outage. 3. Post-contingency overload limit of line 12~23 due to contingency 13~23 outage. 4. Post-contingency voltage limit of bus 24 due to contingency 11~14 outage. In step 5, we identify the security boundary in the space of the study parameters. Figure 6 illustrates the deterministic security boundary (solid lines).
Fig. 7a Risk contour shown in Figures 7a and 7b. From these figures, it is possible to make observations similar to those made for Figures 4a and 4b. VIII COMPARISON OF APPROACHES Based on the analysis in the last two sections, we observe that the deterministic boundary does not necessarily result in constant risk, and that there are a number of influences captured by the iso-risk curves not captured by deterministic assessment: 1. Effect of outage probability: The deterministic approach does not distinguish between the likelihood of contingencies in the contingency set, but different contingencies may have
different probabilities, and the probabilistic approach accounts for this. Thus, there may be some situations where a determinis-
Fig. 7b: Risk for points A–D along deterministic boundary tic violation contributes very low risk because the outage probability is extremely low. There may be other situations where a deterministic violation contributes very high risk because of a very high outage probability. 2. Effect of non-limiting contingencies and failure conditions: The deterministic approach assesses only the most restrictive contingencies and corresponding failure conditions; i.e., it does not recognize the influence on security level of less restrictive contingencies or failure conditions. On the other hand, the probabilistic approach does capture the increased risk caused by multiple constraints as it sums risk associated with all contingencies and failure conditions, i.e., the probabilistic approach is capable of composing risk from multiple events and multiple failure conditions and it reflects the total composite risk and not simply that from the single most restrictive contingency. 3. Effect of Risk in Insecure Region: The deterministic approach provides no information about insecure regions, yet, a boundary to a high-risk region is more threatening than a boundary to a low risk region. The probabilistic method provides for a display of various iso-risk contours, from which one may effectively consider risk variation throughout the operating region. This attribute is especially important when small variations in operating conditions at the boundary cause large risk variation. 4. Effect of uncertainty in operating conditions: The deterministic approach cannot address uncertainty in operating conditions. This limitation inhibits rigorous analysis of near future operating conditions since the future is inherently uncertain. On the other hand, probabilistic assessment treats uncertainty in operating conditions very well and is consequently appropriate for assessing future conditions. The above benefits are obtained at the cost of the data collection necessary to provide reasonable probability models. IX
DECISION-MAKING
The significance of the points made in the last section is that the probabilistic method better reflects the attributes that determine security and in so doing, provides a view of security that leads to better operational decision-making. Ultimately, this involves selecting a value of the index to delineate between acceptable and unacceptable operating regions. In principle, this can be done by [33] (a) using judgment based on experience, (b) relating to already existing criteria, and (c) cost-benefit optimization or decision. One approach is proposed in the following, appropriate for operational decision-making, that reflects all three. 1. Identify a range of risk: The minimum risk is selected as the highest risk level that excludes all deterministically identified insecure states. The maximum risk is selected as the lowest risk level that includes all deterministically identified secure states. In the case of the 5-bus test system, the range is identified as 0.00001 - 0.0002 per Fig. 4b. In the case of the IEEE RTS, the range is identified as 0.0001 - 0.0025 per Fig. 7b. 2. Decide the threshold risk: The threshold risk is the level of risk beyond which operation is considered unacceptable. A decision algorithm can be used to select the threshold risk level from the range of risk previously identified. This ensures that the threshold risk level is a level that has been acceptable in the past under deterministic analysis. As a result, it has the decided advantage of appealing to the conservatism of the operational decision-makers (ODM), the operators, operating engineers, and their managers. One simple and cautious “algorithm,” appealing to the riskaverse ODM, is to select the risk threshold as the minimum level of the identified range. On the other hand, the risk-taking ODM might select the risk threshold as the maximum level of the identified range. Alternatively, by quantifying security, probabilistic assessment facilitates the inclusion of security in economic optimization and decision-making algorithms. For example, the well-known optimal power flow (OPF), if it considers security, usually does so using inequality constraints on the network performance, e.g., flows and voltage magnitudes. One variation of this is to apply constraints on risk rather than performance; such risk constraints may be imposed on individual components, groups of components (zones or regions) and/or the entire system. In addition, probabilistic assessment provides that security may become an objective in decision-making rather than simply a constraint, suggesting a risk-based OPF that optimizes both economy and risk. One might think of adding still more terms to the decision-making objective, such as rate of change in security level or variance. This thought leads naturally to consider the rich field of multicriteria decision-making, a possibility enabled via the quantification of security [34]. Optimization and decisionmaking algorithms may result in solutions that lie outside the range discussed in step 1 above, suggesting a need to either adjust the algorithm or the range, according to the judgment of the decision-maker. Following identification of the risk threshold, the security boundary can be developed and then used in the same way as
the traditional nomograms. Yet, risk-based security boundaries are by definition uniform in risk and consequently facilitate a more consistent decision-making criterion than their deterministic counterparts. In addition, the ability to illustrate multiple iso-risk curves provides information regarding risk levels on the insecure side of the boundary and consequently the rate of risk increase associated with each boundary. The risk thresholds obtained through these procedures are system-specific and do not yield standard risk values for industry-wide application. General risk standards can only be derived by a careful study of many individual systems, evaluating differences and applying informed judgement. X CONCLUSIONS The study reported in this paper has compared the traditional deterministic security assessment approach, as used for many years in industry, with an alternative approach based on probabilistic risk, within the context of operational decisionmaking. Although deterministic assessment is simple in concept and application, results based on it can be misleading, as it does not capture the effect of outage likelihood, non-limiting events and failure conditions, violation severity, and uncertainty in operating conditions. Thus, decisions based on deterministic assessment may reflect significant inconsistency in that they can result in either very low risk or unintended high risk decisions. These effects influence the evaluation of near-future operating conditions. Given the high frequency of stressed conditions observed in many systems today, it is clear that on-line control is a continuous decision-making problem for the operator. We believe that the probabilistic risk-based security evaluation approach will serve well in this kind of environment. References 1. L. Fink, “Security: its meaning and objectives”, Proc. of the Workshop on Power System Security Assessment, pp. 35~41, Ames, IA, Apr 27~29, 1988. 2. Mohammed J. Beshir, “Probabilistic based transmission planning and operation criteria development for the Western Systems Coordinating Council”, Proc. of the 1999 IEEE PES Summer Meeting, pp 134-139. 3. CIGRE TF 38.03.12 (R.J. Marceau and J. Endrenyi, Chairmen), “Power System Security Assessment: A Position Paper”. Electra, No. 175, pp. 4878, December 1997. 4. Y. Schlumberger, C. Lebrevelec, M. de Pasquale “An Application of a Risk Based Methodology for Defining Security Rules Against Voltage Collapse,” Proc. of the 1999 IEEE PES Summer Meeting, pp. 185-190. 5. A. Abed, “WSCC Voltage Stability Criteria, Undervoltage Load Shedding Strategy, and Reactive Power Reserve Monitoring Methodology,” Proc. of the 1999 IEEE PES Summer Meeting, pp. 191-197. 6. A.M. Leite da Silva, J. Jardim, A.M. Rei, J.C.O. Mello, “Dynamic Security Risk Assessment,” Proc. of the 1999 IEEE PES Summer Meeting, pp. 198205. 7. J. Momoh, M. Elfayoumy, W. Mittelstadt, Y. Makarov, “Probabilistic Angle Stability Index”, Proc. of the 1999 IEEE PES Summer Meeting, pp. 212218. 8. S. Aboreshaid, R. Billinton, “A Framework for Incorporating Voltage and Transient Stability Considerations in Well-Being Evaluation of Composite Power Systems,” Proc. of the 1999 IEEE PES Summer Meeting, pp. 219224.
9. J. McCalley, V. Vittal, N. Abi-Samra, “An Overview of Risk Based Security Assessment,” Proc. of the 1999 IEEE PES Summer Meeting, pp. 173-178. 10. J. McCalley V. Vittal, H. Wan, Y. Dai, N. Abi-Samra, “Voltage Risk Assessment,” Proc. of the 1999 IEEE PES Summer Meeting, pp. 179-184. 11. V. Vittal, J. McCalley, V. Van Acker, W. Fu, N. Abi-Samra, “Transient Instability Risk Assessment,” Proc. of the 1999 IEEE PES Summer Meeting, pp. 206-211. 12. S. Lee and S. Hoffman, “Power Delivery Reliability Initiative Bears Fruit,” IEEE Computer Apps. in Power, Vol. 14, No. 3, July, 2001, pp. 56-63. 13. J. Endrenyi and W. Wellssow, “Power System Reliability In Terms Of The System’s Operating States,” Proc. of the IEEE Power Tech Conference, Porto, Portugal, Sept., 2001. 14. R. Billinton, S. Aboreshaid, M. Fotuhi-Firuzabad, “Conceptual framework for composite power system health analysis,” Canadian Conference on Electrical and Computer Engineering, 1996, Vol. 1, pp. 396 –399. 15. “NERC Planning Standards,” North American Electric Reliability Council, Sept., 1997. 16. “Western Systems Coordinating Council Reliability Criteria,” Western Systems Coordinating Council, March 1997. 17. “Southwest Power Pool Criteria,” Southwest Power Pool, May, 1996. 18. “MAPP System Design Standards,” Mid-Continent Area Power Pool, December, 1994. 19. “Principles and Guides for Reliability in System Planning,” Southeastern Electric Reliability Council, April, 1995. 20. “Principles and Guides for Planning Reliability Bulk Electric Systems,” Florida Reliability Coordination Council, September, 1996. 21. “MACC Reliability Principles and Standards,” Mid Atlantic Area Council, March, 1990 22. “ECAR Reliability Criteria,” East Central Area Reliability Coordination Agreement, August, 1996. 23. “Transmission Planning and Guides and The Simulation Testing of The Main Bulk Power Transmission System to Assess Adequacy and Reliability,” Mid-American Interconnected Network, November, 1994. 24. “Criteria for Design and Operation of Interconnected Power Systems,” Northeast Power Coordinating Council, August, 1995. 25. R. Billinton, M. Fotuhi-Firuzabad, and L. Bertling, “Bibliography on the Application of Probability Methods in Power System Reliability Evaluation, 1996-1999,” IEEE Trans. on Power Sys., Vol. 16, No. 4, Nov. 2001, pp595602. 26. Searle, Shayle R., Linear Models, New York, John Wiley & Sons, c1971, pp. 40-44. 27. IEEE Working Group Report, “Reliability Indices for Use in Bulk Power System Supply Adequacy Evaluation”. IEEE Transactions on Power Apparatus and Systems, Vol. 97, No. 4, pp. 1097-1103, July-August 1978. 28. CIGRE WG 38-03 (D. McGillis, Chairman), Power System Reliability Analysis Application Guide. CIGRE, Paris, 1987. 29. R. Billinton and R. Allan, Reliability Evaluation of Power Systems, Plenum Press, New York, 1996. 30. J. Endrenyi, Reliability Modeling in Electric Power Systems, J. Wiley & Sons, Chichester, 1978. 31. R. Billinton and R.N. Allan, Reliability Assessment of Large Electric Power Systems, Kluwer Academic Publishers, 1988. 32. IEEE reliability test system task force of the application of probability methods subcommittee, “ The IEEE reliability test system – 1996”, IEEE Transactions on Power Systems, Vol.14, No. 3, 1999, pp. 1010-1018. 33. Task Force on Bulk Power System Reliability of the IEEE PES Application of Probability Methods Subcommittee, “Bulk Power System Reliability Concepts and Applications,” J. Endrenyi (chair), IEEE Trans. On Power Systems, V. 3, No. 1, Feb., 1988. 34. B. Hobbs and P. Meier, Energy Decisions and the Environment, A Guide to the Use of Multicriteria Methods, Kluwer Academic Publishers, Norwell, MA., c2000.