IEEE TRANSACTIONS ON MEDICAL IMAGING, VOL. 33, NO. 12, DECEMBER 2014
2293
A Generic Approach to Pathological Lung Segmentation Awais Mansoor*, Member, IEEE, Ulas Bagci, Member, IEEE, Ziyue Xu, Brent Foster, Kenneth N. Olivier, Jason M. Elinoff, Anthony F. Suffredini, Jayaram K. Udupa, Fellow, IEEE, and Daniel J. Mollura Abstract—In this study, we propose a novel pathological lung segmentation method that takes into account neighbor prior constraints and a novel pathology recognition system. Our proposed framework has two stages; during stage one, we adapted the fuzzy connectedness (FC) image segmentation algorithm to perform initial lung parenchyma extraction. In parallel, we estimate the lung volume using rib-cage information without explicitly delineating lungs. This rudimentary, but intelligent lung volume estimation system allows comparison of volume differences between rib cage and FC based lung volume measurements. Significant volume difference indicates the presence of pathology, which invokes the second stage of the proposed framework for the refinement of segmented lung. In stage two, texture-based features are utilized to detect abnormal imaging patterns (consolidations, ground glass, interstitial thickening, tree-inbud, honeycombing, nodules, and micro-nodules) that might have been missed during the first stage of the algorithm. This refinement stage is further completed by a novel neighboring anatomy-guided segmentation approach to include abnormalities with weak textures, and pleura regions. We evaluated the accuracy and efficiency of the proposed method on more than 400 CT scans with the presence of a wide spectrum of abnormalities. To our best of knowledge, this is the first study to evaluate all abnormal imaging patterns in a single segmentation framework. The quantitative results show that our pathological lung segmentation method improves on current standards because of its high sensitivity and specificity and may have considerable potential to enhance the performance of routine clinical tasks. Index Terms—Anatomy-guided segmentation, computed tomography, fuzzy connectedness, pathological lung segmentation, random forest.
I. INTRODUCTION ULMONARY diseases and disorders are one of the major causes of deaths and hospitalization around the world. The American Lung Association estimates that about deaths occur per year in the United States from lung diseases [1]. For
P
Manuscript received April 08, 2014; revised June 26, 2014; accepted July 05, 2014. Date of publication July 08, 2014; date of current version November 25, 2014. This work was supported by Center for Infectious Disease Imaging (CIDI), the intramural research program of the National Institute of Allergy and Infectious Diseases (NIAID), and the National Institute of Biomedical Imaging and Bioengineering (NIBIB). Asterisk indicates corresponding author. A. Mansoor, Z. Xu, B. Foster, and D. Mollura are with the Department of Radiology and Imaging Sciences, National Institutes of Health (NIH), Bethesda, MD 20892 USA. *U. Bagci is with the Department of Radiology and Imaging Sciences, National Institutes of Health (NIH), Bethesda, MD 20892 USA (e-mail:
[email protected]). A. F. Suffredini and J. M. Elinoff are with the Critical Care Medicine Department, Clinical Center, National Institutes of Health, Bethesda, MD 20892 USA. K. Olivier is with Immunopathogenesis Section, Laboratory of Clinical Infectious Diseases National Institute of Allergy and Infectious Diseases, National Institutes of Health, Bethesda, MD 20892 USA. J. K. Udupa is with the Department of Radiology, University of Pennsylvania, Philadelphia, PA 19104 USA. Color versions of one or more of the figures in this paper are available online at http://ieeexplore.ieee.org. Digital Object Identifier 10.1109/TMI.2014.2337057
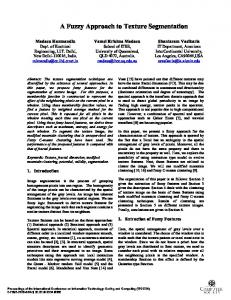
noninvasive detection and diagnosis of lung diseases, quantification of the disease severity, and therapy/surgery planning, radiological imaging techniques, particularly computed tomography (CT), are the current standard in the routine clinics. In parallel to the technological advances in imaging, automated computer analysis and decision support systems are often sought by clinicians and radiologists to further assist their diagnostic tasks. Specific to radiological quantification of lung diseases, efficient and robust image analysis tools are required for extracting information pertaining to lung pathology and morphology in a reliable and efficient way. The lung volume of interest containing abnormalities is often the subject of further analysis and; therefore, precise lung segmentation is a precursor to the deployment of such tools for pulmonary image analysis. Although current state-of-the-art lung segmentation algorithms work well for certain lung pathologies present in moderate amounts, they fail to perform when dense pathologies exist. Accurate segmentation of the pathological lung is challenging since lung pathologies hold appearances different from the normal lung tissue. Fig. 1 highlights common abnormal imaging patterns and pleura pertaining to different lung diseases. CT scans of patients with severe lung diseases often include diverse imaging patterns. Thus, it is difficult to adapt the current state-of-the-art lung segmentation methods due to their limited ability to be applied to diverse imaging patterns with dense pathologies. Our aim in this work is to target this challenge, and provide a generic solution for lung segmentation from CT scans. A. Related Work Most methods reported in the literature evaluated a subset of pathologies when segmenting lungs. Therefore, a generic solution that can work in routine clinical environment for a wide range of pathologies without expert assistance is not available. Threshold-based methods [2], [3] are often used for their efficiency. However, such methods have limited applicability as they fail to consider the intensity variations due to pathologies or even under normal conditions. Region-based methods, such as region growing [4]–[6], watershed transform [7], [8], graph search [9], [10], and fuzzy connectedness (FC) [11], [12], are found useful in catering for the intensity changes. However, with the presence of dense pathology in the lung field, the intensity alone is not enough for successful delineation. As an example, Fig. 1(c) and (d) shows substantially different intensity values of consolidation and cavity regions from normal lung parenchyma. Therefore, these areas are often falsely excluded by thresholding-based lung segmentation methods.
U.S. Government work not protected by U.S. copyright.
2294
IEEE TRANSACTIONS ON MEDICAL IMAGING, VOL. 33, NO. 12, DECEMBER 2014
Fig. 1. Different imaging patterns in pulmonary CT are shown: (a) normal lung (b) GGO (c) consolidation (d) cavity (e) tree-in-bud and micro nodules (f) nodules (g) pleural effusion (h) honeycomb.
For more advanced methods, the use of prior models has been found to be beneficial for cases with moderate amount of abnormality. For instance, anatomical shape models have been used in [13]–[18]. Basically, these methods fit a statistical shape model of an anatomical structure to the image of interest using an optimization procedure. However, as commonly known, the primary drawbacks of the model-based approaches are the requirement of large training data with high variations and accurate anatomical correspondences among the shape instances. Atlas-based methods, on the other hand, transfer a priori object information from a reference image to the target image through image registration. They have been widely used in abnormal segmentation of organs including lungs [5], [19]–[21], abdomen [22], and brain [23]. Although atlas-based methods show promising results in lung segmentation, a representative atlas is often difficult to create due to high shape and intensity variability of the lung pathologies. Furthermore, atlas-based methods may fail to accommodate small details if registration is not designed to handle local variations. Recently, machine learning approaches have gained growing interest in segmenting abnormal organs due to their strong abilities to exploit intensity, shape, and anatomy information. These approaches mostly focus on extracting suitable features (shape and/or texture) for a predefined classifier such as support vector machines, random forests, neural networks etc. Extracted features vary depending on the imaging modality and the body region. A number of feature sets for classification of lung pathologies have been proposed: 3-D adaptive multiple feature method (AMFM) [24], texton-based approach [25], intensity-based features [26], gray level co-occurrence matrix (GLCM) [27], wavelet and Gabor transform [28], shape and context-based attributes [29], [30], local binary patterns (LBP) [31], and histogram of gradients (HOG) [29]. The most challenging aspect of these approaches is the selection of feature
set appropriate for the task at hand, which is still an active area of research, however. B. Our Contributions In this paper, we present a novel approach that, to the best of our knowledge, is the first fully automated pathological lung segmentation method spanning almost the entire spectrum of commonly encountered pathologies in pulmonary CT scans. Moreover, the study has been performed on the largest data set ( CT scans) so far reported in the literature from diverse sources that contain different amounts and types of abnormalities. We developed a rough but intelligent pathology recognition system that automatically switches into the refinement step of the proposed framework when certain type of dense abnormalities are identified. Not only this switching system between the two stages of the proposed framework decreases the computational time, but it also allows users to be aware of the context of the pathologies in a similar fashion to most computer-aided detection (CAD) systems. The performance of our generic pathological lung segmentation (PLS) method was evaluated through: 1) submission to lung segmentation challenge for evaluation against the current state-of-the-art approaches on an unbiased platform, where the results were provided by organizers; and 2) surrogate truths obtained by expert observers’ manual segmentations. The performance analysis was further divided into four categories: normal controls (no pathologies), minimum, medium, and large amount of pathologies. Note that all image sets were divided into subgroups based on the severity of cases, read and evaluated by participating expert radiologists prior to computer-based evaluation. We evaluated the accuracy of the algorithm separately for each category to demonstrate the robustness of the proposed system. The remainder of manuscript describes and discusses the details of the PLS method and its performance. Section II gives
MANSOOR et al.: A GENERIC APPROACH TO PATHOLOGICAL LUNG SEGMENTATION
a glossary of the abnormalities present in pulmonary CT scans and explains basic principles of the FC image segmentation algorithm. Section III introduces different modules of the proposed PLS technique. The results are presented in Section IV. Section V discusses performance aspects and future directions followed by a conclusion in Section VI.
2295
TABLE I GLOSSARY OF COMMON ABNORMALITIES IN PULMONARY CT SCANS
II. BACKGROUND A. Fuzzy Connectedness Image Segmentation FC defines the “hanging togetherness” between any two voxels and within an image [32]. A binary adjacency relationship determines adjacent voxels in -adjacency. Then, a path between and can be identified as a sequence of adjacent voxels . For any two adjacent voxels and , their local hanging togetherness is defined using an affinity function . The greater the affinity is, the more closely related the two voxels are. Then, for an arbitrary path , the strength of the path is defined as the minimum affinity along the path (1) If P is the set of all possible paths between and , then FC between them is the strength of the strongest path P
(2)
The affinity function for two adjacent voxels under is the essential part of FC computation. Commonly, it consists of three components: distance-based affinity , homogeneity-based affinity , and object-based affinity as (3) A wide range of mathematical functions can be used for affinities [33], [34]. Here, we use Euclidean distance for , and adopt the following form of and (4) and
(5) and control the variation, and controls the exwhere pected mean intensity of the target object. FC segmentation is obtained by generating a fuzzy object O with regard to a set of seed points S. The fuzzy object membership value at a voxel is determined by the maximum FC value to all seed points as O
S
(6)
The final object is obtained by thresholding over the fuzzy object O for strength of connectedness. B. Glossary of Abnormal Ct Imaging Patterns in Pulmonary Diseases Visual patterns associated with abnormal lung anatomy in CT images carry valuable information for improving diagnostic confidence and consistency [35]. Commonly observed abnormal imaging patterns associated with lung diseases can be analyzed based on shape, texture, and attenuation information derived from CT images. The presence of more than one type of abnormality in the same region of interest can cause difficulty in understanding and quantifying the nature and extent of the disease. To enlist the common imaging patterns pertaining to different lung diseases, Table I provides a glossary of those patterns with short descriptions. Readers are encouraged to refer to [36] for further details from a clinical perspective.
III. METHODS The PLS method consists of two primary stages: 1) the initial FC segmentation step for normal lung parenchyma, and 2) the refinement stage triggered by automatic pathology identification.
2296
IEEE TRANSACTIONS ON MEDICAL IMAGING, VOL. 33, NO. 12, DECEMBER 2014
Fig. 2. Flowchart explaining the initial segmentation using FC.
A. Seed Selection and Fc Segmentation Fig. 2 summarizes the initial lung segmentation process using FC. For this process, FC requires two seed points: , located within the left and right lungs, respectively. In our design, we automatically set seed locations through a preprocessing step, we then sampled a set of seeds from the regions obtained after strict thresholding. That is, for any given CT image , we use a thresholding operation T using CT attenuation values for normal lung parenchyma (Hounsfield Units (HU): through , mean HU). Thus, T T . Finally, we set the seed locations and after randomly sampling a few seed candidates, i.e., 3 3 3 seed window (not the physical size), for each lung from T and select the voxels with minimum HU value as seeds: L
T
L
T
Fig. 3. Automatic seed selection for initial FC segmentation based on voxel intensity and geometrical knowledge, i.e., the rib cage.
and bronchi) and the left/right lungs. The extent of how well the initial FC segmentation performs depends on the amount and the kind of abnormality present in the target image. Fig. 4 illustrates how the performance of FC may deteriorate with an increase in the extent of pathology. It should be noted that although FC is more robust than region growing, graph-cut, and other region-based segmentation methods [37], further refinement is often inevitable for cases with dense pathologies. B. Pathology Presence Test
(7)
T where L denotes the location of the voxel(s), and T T . Fig. 3 demonstrates the approximate lung regions where we sample candidate seeds. Note that we carry out seed sampling over the extracted normal lung parenchyma, not the original CT image. Apart from seeds, FC algorithm also requires approximate mean and the standard deviation and of the lung region to be used in affinity functions. These values were empirically set to normal lung parenchyma as HU, HU after analyzing hundreds of CT images. Once seeds and affinity parameters for FC are set, delineation is performed. The output of the FC segmentation is a binary mask of the lung fields containing both the external airways (trachea
The goal of the pathology presence test was to check the quality of initial segmentation and to determine whether any pathological areas were present in the target lung that need to be further included in the final lung volumes. The test consisted of two constraints: 1) the smoothness of the boundary pertaining to the initially segmented lung volume, and 2) the difference between segmented and lung volumes estimated from rib cage information. Since the rib cage tightly bounds the lung field inside the body region, it can give an approximate value for expected lung volume. In other words, we used the pathology presence test to understand if the mild or severe amount of pathology present in the scan so then advanced machine learning methods can be used for voxel-based classification as a further step. It is important to note here that there is no “explicit” volume or spatial information involved in this test. Once this pathology
MANSOOR et al.: A GENERIC APPROACH TO PATHOLOGICAL LUNG SEGMENTATION
2297
Fig. 5. Plot shows the change in the normalized 2-D segmented area (per slice) along the axial planes.
Fig. 4. Images with different pathologies along with overlaid with the respective initial FC segmentation.
recognition system reveals that the advanced machine-learning is necessary, then the next stage of our proposed framework is conducted. The details of those two constraints are explained in the following. 1) Smoothness Test: This test is based on the observation that the area per slice of a normal lung has a smooth transition along the z-axis; whereas in scans with moderate/dense abnormalities the 2-D areas change abruptly due to the fact that abnormal imaging areas are not captured by the conventional segmentation algorithms. Since segmented lung areas may change irregularly between slices with the presence of abnormalities, we can track the abnormal changes in the lung surfaces by conducting a smoothness test. Let denotes the lung area on a given axial slice , then the change in segmented area in the direction orthogonal to the slice plane can be monitored by , for . To quantify how segmented regions change when minimal or no pathology exists in the CT images, we selected a set of control images , and calculated the maximal variation for each control image: , where indicates variation. Note that the control images were lung scans of healthy subjects containing minimal or no abnormalities. Based on the smoothness assumption, any abrupt change in the segmented area indicated the presence of a potential abnormality which triggers the refinement stage. As an example, Fig. 5 shows a general trend in the area per slice along the axial plane for a normal lung scan, compared with the area per slice of a scan with moderate amount of pathology. As can be seen, abrupt change in the 2-D areas of lung regions may help detecting presence of mild/severe amount of pathology.
Fig. 6. The rib cage (blue) is separated (middle) from the adjacent bones (red) (left) for volume estimation. Lung fields are enclosed by rib cage (right).
2) Volume Difference Test: Estimated lung volume is used as an additional constraint for the existence of pathology. The volume of the lung is estimated based on a regression analysis that was performed on training scans without abnormalities. First, the approximate ribcage volume for the training data was estimated by fitting a 2-D convex hull on the ribcage. Second, a linear regression analysis was performed. Based on this regressed lung volume information from the ribcage volume, one may easily conduct a volume difference test using the estimated lung volume from the initial segmented lung volume determined by the FC. A number of approaches in the literature have used ribcage information to estimate the location of lung parenchyma [38]–[42]. We used a convex-hull that fit around the rib cage for a rough lung volume estimation. As observed from Fig. 6, the rib cage can be used as an anchor to estimate enclosed volume that is closely associated with lung volume when no or minor pathology exists. Fitting a convex-hull to the rib cage structures requires the rib bony structures to be extracted. Since bone has relatively high contrast compared to surrounding tissues, thresholding allows identification of bonee structures. We chose the commonly used thresholding parameter of 300 HU for including all bone
2298
IEEE TRANSACTIONS ON MEDICAL IMAGING, VOL. 33, NO. 12, DECEMBER 2014
Fig. 8. A flow diagram explaining the automatic cavity segmentation process.
where
and ; and plateness can be formulated
as (9) Fig. 7. 2-D convex-hull (shown in blue) fitting in axial plane for pathology presence test of the segmentation.
structures. Thresholding was followed by a connected component analysis in order to retain the largest component and remove noise. Although this process provided rib cage, some of the other bone structures including sternum and spine may also be often included. However, the scapula should not be included in our convex-hull fitting around the rib cage because scapula will falsely increase the estimated volume (Fig. 7). In order to remove the scapula, we used shape information of the bones-ribs have a tubular geometry while scapula is plate-like. Based on this distinguishing information, we utilized Hessian analysis to extract shape features. As shown in [43], analyzing the secondorder information (Hessian) of a Gaussian convolved image provides local information of the structure. Specifically, eigenvalue decomposition was performed over the Hessian matrix and the resulting ordered eigenvalues, i.e., , were examined. For tubular structures, it was expected that was small and the other two were large and of equal sign; while for plate structures, it was expected that both and were small and was large. Explicitly, for a bright structure on a dark background, ribness can be formulated as
(8)
, and ; where The ribness and plateness measurements and above were calculated at different scales and the maximum response was achieved at a scale that matches the size of the structure. Therefore, by using a multi-scale approach which covers a range of structure widths and finding the maximum value , we enhanced the local tubular and plate structures. Let denote the scapula to be excluded and denote the bones useful for lung volume estimation such that . can be characterized by high and low responses, while features high and moderate values. Therefore, thresholding was applied to extract candidate scapula voxels and rib voxels . Since and usually cover only part of the entire rib and scapula, these points were used as seed points to initiate a geodesic distance transform within the initial bone segmentation using a fast-marching algorithm [44]. The final step was to detach the scapula from whole bone segmentation based on the distance map, all voxels satisfying were excluded from convex-hull generation. Once the rib cage was segmented, a 2-D convex-hull was fitted over the rib cage along the axial axis to estimate the lung volume. Let denote the set of all candidate voxels on slice and denote its convex-hull. From a boundary perspective, can be regarded as the inside of the polygon formed by deforming a contour, which initially encloses , so that the deformation simulates that of a rubber band contraction until it
MANSOOR et al.: A GENERIC APPROACH TO PATHOLOGICAL LUNG SEGMENTATION
Fig. 9. Detected cavity (a), its FC segmentation (b), and surface rendition (c) are given.
becomes taut by the outermost anchor points (Fig. 7). That is, consists of all possible linear combinations of as (10) for all possible linear combination weighting scheme such that and . After rib cage segmentation and convex-hull fitting, the volume enclosing the convex-hull was estimated. In the refinement step, when indicated by the pathology presence test, the PLS method used the random forest classification algorithm at the voxel level. Furthermore, the method has additional modules for segmenting cavities and pleural diseases due to their unique appearances. In the following subsections, we describe the refinement process of the PLS method with its specific modules: FC based cavity segmentation, random forest-based pathology identification, and neighboring anatomy guided pleural effusion detection. It is important to mention here that the parameters in both the smoothness test and volume difference test are chosen to minimize the type-II error, i.e., the probability of rejecting to proceed to the refinement stage when the target scan needs one at the expense of the type-I error. C. Cavity Detection and Segmentation Cavities occur in multiple lung diseases and are a primary marker of tuberculosis (TB) infection [45], [46]. Severe cavities and blebs have a high contrast boundary separating them from the surrounding lung parenchyma (for a reference see Table I) and are therefore usually not captured within the initial FC segmentation phase. A separate mechanism has been put in place
2299
Fig. 10. Schematic diagram showing texture classification-based refinement, highlighting both predictive model learning for RF and the pathology classification in the target image based on the learned predictive model.
in the PLS method to ensure that the cavities are detected and included in the final segmentation. Fig. 8 provides an overview of the automatic cavity segmentation technique used in the PLS method. Briefly, we automatically search the candidate cavity regions by applying thresholding operation with strict HU level HU) denoting gas-filled regions within the lung parenchyma. Our search was confine to the regions enclosed by convex-hull thus eliminating gas-filled regions. Next, amongst all the regions detected as cavities within the convex-hull, we select the voxels that had minimum HU values as seeds with which we initiated the FC segmentation. Fig. 9 shows a detected cavity region in (a), its FC segmentation in (b), and 3-D surface rendering in (c). D. Pathology Detection via Random Forest Classification Following cavity detection, the pathology presence test was repeated. If the resulting smoothness and volume difference tests still indicated the existence of pathologies, the random forest classification of lung tissues at the voxel level was conducted. With voxel-wise classification, it is possible to determine different abnormal imaging patterns within the lungs. Fig. 10 illustrates the second module of the PLS method in which we recognize the general abnormal imaging patterns pertaining to the lung diseases other than pleural and cavity patterns. Although machine learning classification methods are very useful for detecting pathology, it is not trivial to extract discriminative feature sets to drive the detection process. Moreover, assessing every voxel’s class dependency may be computationally expensive. To address these two challenges, we integrated rib cage extraction and convex-hull fitting processes into the random forest classification algorithm in order to restrict the search space to rib cage area only. For random forest voxel
2300
TABLE II EXTRACTED FEATURES FOR VOXEL-WISE CLASSIFICATION OF LUNG TISSUES
IEEE TRANSACTIONS ON MEDICAL IMAGING, VOL. 33, NO. 12, DECEMBER 2014
TABLE III PARAMETER SETTINGS
FOR RANDOM FOREST CLASSIFICATION IN PATHOLOGY DETECTION
METHOD
due to its high accuracy, efficiency, and robustness. In training a random forest classifier, two experienced observers annotated various pathology patterns from randomly selected CT scans (21 CT scans from different subjects). A total of 997 nonoverlapping ROIs were extracted from those annotations such that 507 observations belong to while 490 observations belong to . A random forest classification model was constructed using those observations with the corresponding labels. Table III summarizes the set of parameters used for feature extraction and random forest classifier training. classification of lung tissues, we employ feature sets commonly used in various lung CAD systems: gray-level run length matrix (GLRLM), gray-level co-occurrence matrix (GLCM), and histogram features. Justification of the use of GLCM, GLRLM, and histogram features is based on the visual analysis of CT lung pathologies [47]. Various studies have shown that texture, intensity, and gradient are the key discriminative features for automatically detecting abnormal imaging patterns. Thus we designed a patch-wise feature set encompassing texture, intensity, and gradient for our study. Briefly, GLCM and GLRLM were calculated using 4-orientations , and for bins [48]. For every voxel within the search region, we extract the features considering a patch (i.e., ROI) around that voxel with 7 7 7 neighborhood. The complete list of 24 distinct features is shown in Table II. Since, our aim in this study was to segment pathological lungs, we considered all pathological regions as a single label (i.e., ) rather than sub-categorization of the abnormality types such as consolidation, ground-glass opacity (GGO), etc. Assuming FC segmented the normal lung parenchyma in the initial delineation R , and cavities and pleural effusion regions are indicated by R and R (segmentation of pleural effusion regions is discussed in the next section), respectively, then the pathological regions R which require voxel classification via random forest method can be defined as R R R R R . All the voxels belonging to R were classified into two classes: pathological or nonpathological regions. In particular, neighboring structures of the lung were considered as nonlung and/or nonpathological structures and labeled as . Any machine learning algorithm with the ability to separate normal lung parenchyma and neighboring anatomical structures from known abnormal imaging patterns of lung disease can be used in the refinement process. However, random forest has been shown to be powerful for this kind of classification tasks
E. Neighboring Anatomy-Guided Pleural Effusion Detection The final module of the proposed PLS method was the detection of pleural abnormalities. Pleural effusion is an accumulation of fluid in the pleural cavity. Similar to cavity formation, we considered the existence of pleural effusions as a separate detection problem due to its unique challenges. For example, pleural fluids usually has similar textural and intensity properties with the surrounding soft tissues (see Fig. 11 for pleural effusion and plaque examples). Recent studies [49], [50] on the discriminative role of CT intensity values in characterizing the pleural fluid concluded that the CT numbers of pleural effusions do not hold enough discriminative information to accurately detect/delineate pleural effusions. Existing attempts such as [51] do not solve the lung segmentation problem because, detection of the pleural effusion using the existing methods paradoxically requires a complete lung segmentation prior to its detection. In contrast, we would like to detect pleural effusion as a part of pathological lung segmentation. To address the challenge of pleural fluid detection, we used neighboring anatomy information of the pleural region as a stable marker for lung boundary. For neighboring anatomy, ribs, heart, and liver can also be used as potential markers. Hence, we extracted the feature sets from the anatomical location of these organs and their relative positioning information. Note that the heart, liver, and other neighboring structures are not segmented but rather considered as a single unit. Their relative spatial location in normal (healthy) scans were annotated by participating expert observers using the ROIs in the training step. in contrast to the pathology classification module, the feature set here consists of the relative position of the neighboring organs in rather than the textural features. In other words, for neighboring anatomy-guided classification to detect pleural regions, we use normalized spatial coordinates as feature set. Normalized spatial coordinates in our method were obtained by dividing the spatial coordinates by the
MANSOOR et al.: A GENERIC APPROACH TO PATHOLOGICAL LUNG SEGMENTATION
2301
Fig. 11. Examples showing different cases highlighting the lung scans with pleural effusion (a)–(b) and the pleural plaque (c).
Fig. 13. An example for automatic trachea extraction (left) and trachea removal (b) is shown.
Fig. 12. Flow chart explaining the neighboring anatomy-guided segmentation for difficult cases.
estimated total rib cage volume, the latter obtained by using the convex-hull method. The random-forest algorithm was used to classify the target region R R R R R into two classes: pleura and neighboring-anatomy ]. In training the classifier, two expert observers annotated lung-field and neighboring organs from randomly selected CT scans (27 CT scans from different data sets) and a random-forest classifier was constructed using the training data with the corresponding labels. Based solely on the knowledge of anatomical location, the method divides the region R into and . The proposed framework for detecting pleural effusion is summarized in Fig. 12. F. Automatic Trachea Extraction Since the trachea is contiguous with the lung, it is also included in the lung segmentation procedure. However, trachea and airways are typically evaluated separately from the lung parenchyma routinely in clinical practice. Hence, it is of interest
Fig. 14. Flow diagram explaining the proposed automatic trachea segmentation method.
to remove the trachea from the segmented lungs. This procedure can be performed simultaneously with lung segmentation, or as an alternative final step once the segmentation has been conducted. In our study, instead of increasing the complexity of lung segmentation, we preferred to keep trachea removal as
2302
IEEE TRANSACTIONS ON MEDICAL IMAGING, VOL. 33, NO. 12, DECEMBER 2014
Fig. 15. Flow diagram explaining the hysteresis lung separation approach. (A) Original CT with binary lung segmentation, (B) Hessian analysis enhancing bright plate-like structures, (C) enhanced plate structure, (D) point groups from separated left and right lung regions by subtracting the dilated plate structures from original segmentation, (E–F) distance transform from the two point groups, (G) 2-D separation manifold determined by distance transform, and (H) final separation result.
an optional tool for users at the end of the final lung segmentation. To remove the trachea, we first used 2-D Hough transform along the axial plane to detect the tracheal region (i.e., a circular region in the top slices of the CT scan) followed by conventional FC segmentation that accepts the voxels inside the circular region as initial seed points. Meanwhile, the orientation information for identifying the seed point location was extracted from the DICOM header, followed by a smoothing filter and 2-D Hough transform. Once, the seeding was done, we used FC to finalize trachea segmentation. Next, we started estimating trachea volume from the first axial slice that we found the trachea region with the Hough transform. Expected maximum capacity of trachea (i.e., cm ) [52] and the rate of change of the volume were used to determine the stopping criteria for trachea inclusion/exclusion in the final segmentation. Note that main bronchi were not removed due to the capacity constraint feature of the trachea removal tool. Fig. 13 illustrates example slices where the removed trachea was shown in red. A block diagram explaining the proposed automatic trachea extraction method is provided in Fig. 14 and the corresponding pseudo-code is given in Algorithm 1. G. Left/Right Lung Separation Lung separation was performed using a hysteresis approach which utilizes prior information from original lung segmentation as well as the background gaps [53]. First, Hessian-filtered original segmentation was bifurcated by subtracting gaps between potential left and right lungs. Second, a 2-D separation manifold in 3-D image space was estimated based on the information from the distance transform. Finally, the separation manifold was projected back to the origin space where segmented object was relabeled as left and right lungs. Fig. 15 illustrates this operation step by step.
IV. EXPERIMENTAL RESULTS A. Data and Reference Standards To evaluate the performance of our PLS method, we used both publicly available and in-house acquired data sets. All in-house images were acquired at our institute using 64-detector row Phillips Brilliance 64 or GE Medical Systems Light Speed Ultra. Scans were performed at end-inspiration with 1.0 or 2.0 collimation and obtained at 10 or 20 mm intervals from the base of the neck to upper abdomen. After obtaining Institutional Review Board (IRB) approval, retrospective cases
MANSOOR et al.: A GENERIC APPROACH TO PATHOLOGICAL LUNG SEGMENTATION
2303
TABLE IV DATA DESCRIPTION OF THE CT SCANS USED IN OUR EXPERIMENTS
of human para-influenza (HPIV), necrotic tuberculosis (NTB), diffuse alveolar hemorrhage (DAH), influenza A (H1N1) were collected from May 2005 through September 2012. Table IV summarizes the data sets used in our study. When biopsy images are not available, manual segmentation by experts is often accepted as the gold standard. For segmentation evaluation of in-house CT data, reference standards were provided by two experienced observers through manual segmentation. The left and right lungs were labeled separately in order to evaluate each lung individually. Dice similarity coefficient (DSC) [54], Hausdorff distance (HD) [54], specificity, and sensitivity evaluation metrics were used for quantitative analysis. Table V summarizes the quantitative evaluation of all eight
data sets segmented with the PLS algorithm. An average overlap score of more than 95% was obtained in our analysis of over 400 CT scans. For qualitative evaluation, Fig. 16 indicates the initial FC segmentation of the lungs (shown in red) with various pathologies, and our proposed method (shown in green). Results obtained for different abnormal imaging patterns consistently indicate the superior performance of the PLS method. For a clinical reference, a summary of how various pathologies are handled inside our proposed framework is provided in Table VI. The table clearly demonstrates the effectiveness of the proposed technique in dealing with most commonly encountered pathologies.
2304
IEEE TRANSACTIONS ON MEDICAL IMAGING, VOL. 33, NO. 12, DECEMBER 2014
TABLE V OVERALL PERFORMANCE OF THE PROPOSED LUNG SEGMENTATION APPROACH AVERAGED OVER DIFFERENT DATA SETS AND AVERAGED OVERALL. MEAN AND STANDARD DEVIATION (STD) IS PROVIDED FOR EACH INDEX
TABLE VI SUMMARY OF THE PATHOLOGIES (ALONG WITH NORMAL LUNG PARENCHYMA) SEGMENTED BY DIFFERENT MODULES OF THE ALGORITHM
TABLE VII OVERLAP SCORES FOR THE AUTOMATED LUNG SEGMENTATION FOR THE 55 SCANS IN LOLA11, (A) PLEURAL FLUID INCLUDED INSIDE THE LUNG FIELD., (B) PLEURAL FLUID EXCLUDED FROM THE LUNG FIELD
such as the PLS method can be very useful in obtaining precise results in such cases. B. Statistical Comparison and Inter- and Intra-Observer Agreements Compared to the initial FC segmentation, we observed significant improvement in the overlap score with the PLS method when applied to the HPIV data set which contained the widest range of abnormalities compared with other data sets. The statistically significant improvement with the use of the PLS method was observed in the data set (see Fig. 17). To quantify the inter- and intra-observer agreements, we compared the DSC values of the manually delineated CT scans. Fig. 18 shows the box-plots for intra-observer (a) and inter-observer (b) agreements. For intra-observer agreements, both observers were asked to repeat the manual segmentation of randomly chosen CT scans after a week of initial delineation, and segmentation variations were computed through DSC values. These results demonstrate that the difference between the overlap scores obtained using the PLS method compared to the manual segmentation are not statistically significant and, large intra- and inter-observer differences increase in the presence of heavy abnormalities. Automatic delineation methods
C. Comparison to the State-of-the-Art Methods To analyze the effectiveness of the PLS method and for an independent evaluation and direct comparison of the proposed PLS method with other state-of-the-art techniques, we tested our algorithm using the publicly available LObe and Lung Analysis 2011 (LOLA11) Challenge data set. Submitted results were evaluated against a reference standard using overlap measures by the organizers and published online. The results were reported in terms of minimum, mean, median, and maximum overlap over the 55 scans for left and right lung separately. The final score was the mean over all scans. The evaluation provided for our algorithm was reproduced in Table VII. For comparison purpose, scores of other algorithms that joined the segmentation challenge are presented in Table VIII with a short description of each method. Further details of the methods can be found on the challenge website. Since the medical imaging community lacks consensus on whether pleural fluid should be considered as a part of lung field or not, we segmented the LOLA data set including pleural 1Available
online: http://lola11.com/
MANSOOR et al.: A GENERIC APPROACH TO PATHOLOGICAL LUNG SEGMENTATION
2305
Fig. 16. Example axial slices of segmentation results on HRCT lung scans with different pathologies. Red segmentation shows the results using the FC while the corresponding green segmentation shows results using our proposed method. (a) Pulmonary fibrosis. (b) Pulmonary fibrosis. (c) Multifocal consolidation. (d) Honeycombing. (e) GGO. (f) Intralobular lines. (g) Pleural effusion. (h) Pleural plaque. (i) Consolidation with bronchocentric distribution. (j) Cavity.
field as a part of lung (Table VII (a), a score of 0.968 was obtained) and excluding the pleural field as an additional experiment in which we obtained a score of 0.955. Although not all segmentations evaluations were available on LOLA11’s website, a few available screenshots revealed that there were some
inconsistency in creating ground truth by the organizers and this may eventually affect the ranking of the methods. For instance, screenshots of the LOLA image #37 from the website was reproduced in Fig. 19. The figure shows a reference ground truth and our method’s segmentation such that the areas marked by circle
2306
IEEE TRANSACTIONS ON MEDICAL IMAGING, VOL. 33, NO. 12, DECEMBER 2014
TABLE VIII LOLA11 SEGMENTATION CHALLENGE RESULTS WITH A SHORT DESCRIPTION OF THE SUBMITTED METHODS
Fig. 17. DSC of the segmentation evaluation of HPIV data set through (a) initial FC segmentation, and (b) the proposed PLS method.
Fig. 18. Box-plots of dice coefficients for intra-observer (a) and inter-observer (b) agreement are demonstrated.
are falsely included in the wrong lung (i.e., left lung were falsely labeled as right lung) while the same region was correctly labeled with our algorithm (b). Fig. 19(c) (d)– (e) indicated the incorrect label assignment of LOLA data set, as also confirmed by our participant radiologists. As a result, computed overlap measures for this particular CT scan was lower than what we expected because of the false calculation of the overlap measure. D. Evaluation of the Pathology Presence Test Regarding the successful detection rate for minimal, mild, and severe cases, we first divided the whole data sets into three different groups by expert scores: none/minimal number of scans , mild number of scans , and severe number of scans . In all severe cases, our pathology recognition system decides to switch into the machine learning classification phase (i.e., 100% detection rate). In evaluation of 268 mild cases, our algorithm only missed four
scans to be evaluated in the machine learning phase; therefore, a successful detection rate of 98% was observed. Among 53 cases with none/minimal pathology, our algorithm has chosen 12 scans to be analyzed in the machine learning step, although the next step was not necessary. This additional selection was due to the fact that we tuned our pathology recognition system to have a tendency to switch into machine learning step when estimated volume and initial lung volume difference lies in the decision border. Note that with the expense of type II error only contributes to an increase in the computational cost (i.e., inclusion of machine learning step for cases which do not really need this step), we reduced the type I error considerably. It should be also emphasized that some inconsistencies in machine learning classification phase might occur when CT images are low resolution or poor quality and as a result of this, extracted texture features can be less effective in finding the correct class labels for the voxels. In such cases, our complementary third step (i.e., neighboring anatomy guided refinement) diminishes inconsistencies. E. Computational Efficiency A switch named pathology-presence test has been put in place to assess if the target scan requires further refinement. One of the
MANSOOR et al.: A GENERIC APPROACH TO PATHOLOGICAL LUNG SEGMENTATION
2307
Fig. 19. Reference segmentation from the LOLA challenge (a) and segmentation using our proposed method (b) is shown along with the coronal (c), axial (d), and sagittal (e) plane views of the segmented image (lola11-37). The part of right lung mistakenly included in the left in reference segmentation by LOLA is marked in coronal, axial, and sagittal planes, (a) Reference segmentation from LOLA Challenge, (b) Segmentation using the Proposed Method, (c) Coronal plane view, (d) Axial plane view, (e) Sagittal plane view.
primary purposes of the switch is to make the segmentation platform computationally efficient by avoiding unnecessary steps. Therefore, the amount of time required to segment a particular scan depends largely on the amount of abnormality present inside the scan as well as the size the scan. For our workstation (Intel Xeon 3.10 GHz, 128 GB ram), the amount of time ranges from less than a minute (512 512 71 normal scan) to 15 min on average (512 512 792, severe parenchymal pathology and the presence of pleural pathology). A recent study to explore the use of supervoxel based near optimal key-point sampling to further reduce the computational cost of the PLS method is presented in [61].
V. DISCUSSION For CAD applications such as detection, classification, and quantification, accurate lung segmentation is an extremely important preprocessing step. Conventional techniques in lung segmentation rely only on contrast differences between the lung field and the surrounding tissues thus failing to segment areas with pathologies. Notably, lung scans containing significant amount of pathologies and other abnormalities are much more prevalent in daily clinical environment than ones without pathologies. Therefore, expert manual segmentation is still considered to be the most reliable option for pathological lungs.
2308
IEEE TRANSACTIONS ON MEDICAL IMAGING, VOL. 33, NO. 12, DECEMBER 2014
Fig. 20. Artificial objects such as breast implants may affect the accurate ribcage extraction and manual interaction can be necessary for correcting the failure of pathology presence test.
Additionally, with improvement in quality and affordability, the use of noninvasive imaging methods will become more common in routine clinical practice, generating a significant amount of data will be impractical to evaluate manually. Our pathological lung segmentation technique has been tested on over 400 CT scans, completed on more than 280 patients with a variety of comorbidities and demographic backgrounds (Table IV). By testing on versatile data, we made our best effort to cover the most prevalent cases in the routine clinical environment. We also believe that due to the fully automated nature of our technique, additional pre-/post-processing steps may be necessary for certain scan types. For instance, noise induced variabilities needs to be investigated further and rare cases of extreme noise may demand that denoising steps be performed prior to delineation. Since our proposed technique assumes certain characteristic structure to the ribs for volume estimation and seed selection, patients without fully developed bones such as in children and patients with an abnormal or fractured rib cage may require some parameter adjustments in the proposed method’s pipeline. Issues such as these will be examined in our future work. The PLS has other limitations and there are cases where different modules of the proposed system may fail. For instance, excessive noise, external objects, and very rare clinical cases may cause the PLS to perform poorly. Some of failures cases are described and illustrated below. Excessive noise: The PLS does not have a denoising mechanism built into it. Although our method is robust to a vast range of streaking and noise artifacts, excessive ranges of these artifacts may affect the performance of our method. Nevertheless, one may readily preprocess images prior to delineation step with the PLS. External objects: External objects such as tubes and medical implants may effect the performance of the method as illustrated in Fig. 20 (breast implants), and Fig. 21 (tube). Rare clinical cases: Subcutaneous emphysema occurs when gas or air is present in the subcutaneous layer of the skin (Fig. 22). The rare cases of CT scan with subcutaneous emphysema may result in the leakage of segmentation by the initial FC stage to air pockets within the subcutaneous layer. In this paper, we are not developing new feature sets or novel machine learning algorithms. Instead, we are developing and testing the complete pathological lung segmentation system on
Fig. 21. Air and fluid-containing tubes and other cavity-like artificial objects such as the one shown may affect the performance of the PLS system.
Fig. 22. Abdominal CT scan of a patient with subcutaneous emphysema (shown by an arrow).
a large variety of cases with novel infrastructure. Nevertheless, our system can be further strengthened with more powerful machine learning classifiers and/or more discriminating higher order textural features. In its current form, the PLS is a promising tool to be used in routine clinics for pathological lung volume assessment as well as pathology recognition. VI. CONCLUSION We present a novel method for fully automated lung segmentation with and without abnormalities. To the best of our knowledge, the proposed method is the first fully automated-generic technique covering a wide range of pathologies and pleura without any human assistance. The core of our method is the FC initial segmentation. Our method is equipped with multiple refinement stages including machine-learning classification to handle pathologies; further, a novel neighboring anatomy-guided learning mechanism to handle extreme cases such as pleural effusion was introduced. The robustness and the effectiveness of our proposed method was tested on
MANSOOR et al.: A GENERIC APPROACH TO PATHOLOGICAL LUNG SEGMENTATION
more than 400 lung scans acquired through various sources containing a wide range of abnormalities. The results obtained using the proposed method are tested in the most rigorous way possible, obtaining the overlap score of greater than 95%. The exhaustive testing confirm the accuracy and the effectiveness of the presented method. REFERENCES [1] Estimated prevalence and incidence of lung disease Am. Lung Assoc., Washington, DC, Tech. Rep., Apr. 2013. [2] M. S. Brown, M. F. Mcnitt-Gray, N. J. Mankovich, J. G. Goldin, J. Hiller, L. S. Wilson, and D. Aberie, “Method for segmenting chest CT image data using an anatomical model: Preliminary results,” IEEE Trans. Med. Imag., vol. 16, no. 6, pp. 828–839, Dec. 1997. [3] G. J. Kemerink, R. J. Lamers, B. J. Pellis, H. H. Kruize, and J. Van Engelshoven, “On segmentation of lung parenchyma in quantitative computed tomography of the lung,” Med. Phys., vol. 25, p. 2432, 1998. [4] S. G. Armato, III and W. F. Sensakovic, “Automated lung segmentation for thoracic CT: Impact on computer-aided diagnosis,” Acad. Radiol., vol. 11, no. 9, pp. 1011–1021, 2004. [5] I. Sluimer, M. Prokop, and B. Van Ginneken, “Toward automated segmentation of the pathological lung in CT,” IEEE Trans. Med. Imag., vol. 24, no. 8, pp. 1025–1038, Aug. 2005. [6] U. Bagci, B. Foster, K. Miller-Jaster, B. Luna, B. Dey, W. R. Bishai, C. B. Jonsson, S. Jain, and D. J. Mollura, “A computational pipeline for quantification of pulmonary infections in small animal models using serial PET-CT imaging,” Eur. J. Nucl. Med. Molecular Imag. Res., vol. 3, no. 55, pp. 1–20, 2013. [7] J.-M. Kuhnigk, H. Hahn, M. Hindennach, V. Dicken, S. Krass, and H.-O. Peitgen, “Lung lobe segmentation by anatomy-guided 3-D watershed transform,” in Proc. Int. Soc. Opt. Photon. Med. Imag., 2003, pp. 1482–1490. [8] R. Shojaii, J. Alirezaie, and P. Babyn, “Automatic lung segmentation in CT images using watershed transform,” in Proc. IEEE Int. Conf. Image Process., 2005, vol. 2, p. 270. [9] L. Zhang, E. A. Hoffman, and J. M. Reinhardt, “Lung lobe segmentation by graph search with 3-D shape constraints,” in Proc. SPIE, 2001, vol. 4321, pp. 204–215. [10] P. Hua, Q. Song, M. Sonka, E. Hoffman, and J. Reinhardt, “Segmentation of pathological and diseased lung tissue in CT images using a graphsearch algorithm,” in Proc. IEEE Int. Symp. Biomed. Imag: From Nano to Macro, 2011, pp. 2072–2075. [11] T. N. Jones and D. N. Metaxas, “Automated 3-D segmentation using deformable models and fuzzy affinity,” in Information Processing in Medical Imaging.. New York: Springer, 1997, pp. 113–126. [12] Y. Zhou and J. Bai, “Multiple abdominal organ segmentation: An atlas-based fuzzy connectedness approach,” IEEE Trans. Inf. Technol. Biomed., vol. 11, no. 3, pp. 348–352, May 2007. [13] T. F. Cootes, A. Hill, C. J. Taylor, and J. Haslam, “Use of active shape models for locating structures in medical images,” Image Vis. Comput., vol. 12, no. 6, pp. 355–365, 1994. [14] T. Kitasaka, K. Mori, J.-I. Hasegawa, and J.-I. Toriwaki, “Lung area extraction from 3-D chest X-ray CT images using a shape model generated by a variable Bézier surface,” Syst. Comput. Jpn., vol. 34, no. 4, pp. 60–71, 2003. [15] J. Pu, J. Roos, C. A. Yi, S. Napel, G. D. Rubin, and D. S. Paik, “Adaptive border marching algorithm: Automatic lung segmentation on chest CT images,” Comput. Medi. Imag. Graph., vol. 32, no. 6, pp. 452–462, 2008. [16] U. Bagci, X. Chen, and J. K. Udupa, “Hierarchical scale-based multiobject recognition of 3-D anatomical structures,” IEEE Trans. Med. Imag., vol. 31, no. 3, pp. 777–789, Mar. 2012. [17] X. Chen, J. K. Udupa, U. Bagci, Y. Zhuge, and J. Yao, “Medical image segmentation by combining graph cut and oriented active appearance models,” IEEE Trans. Image Process., vol. 21, no. 4, pp. 2035–2046, Apr. 2012. [18] X. Chen and U. Bagci, “3-D automatic anatomy segmentation based on iterative graph-cut-ASM,” Med. Phys., vol. 38, no. 8, pp. 4610–4622, 2011. [19] B. Li, G. E. Christensen, E. A. Hoffman, G. McLennan, and J. M. Reinhardt, “Establishing a normative atlas of the human lung: Intersubject warping and registration of volumetric CT images,” Acad. Radiol., vol. 10, no. 3, pp. 255–265, 2003. [20] L. Zhang and J. Reinhardt, “3-D pulmonary CT image registration with a standard lung atlas,” in Proc. SPIE Conf. Med. Imag., 2000, vol. 4322, pp. 67–77.
2309
[21] L. Zhang, E. A. Hoffman, and J. M. Reinhardt, “Atlas-driven lung lobe segmentation in volumetric X-ray CT images,” IEEE Trans. Med. Imag., vol. 25, no. 1, pp. 1–16, Jan. 2006. [22] H. Park, P. H. Bland, and C. R. Meyer, “Construction of an abdominal probabilistic atlas and its application in segmentation,” IEEE Trans. Med. Imag., vol. 22, no. 4, pp. 483–492, Apr. 2003. [23] T. Greitz, C. Bohm, S. Holte, and L. Eriksson, “A computerized brain atlas: Construction, anatomical content, and some applications,” J. Comput. Assist. Tomogr., vol. 15, no. 1, pp. 26–38, 1991. [24] Y. Xu, M. Sonka, G. McLennan, J. Guo, and E. A. Hoffman, “MDCTbased 3-D texture classification of emphysema and early smoking related lung pathologies,” IEEE Trans. Med. Imag., vol. 25, no. 4, pp. 464–475, Apr. 2006. [25] M. J. Gangeh, L. Sørensen, S. B. Shaker, M. S. Kamel, M. De Bruijne, and M. Loog, “A texton-based approach for the classification of lung parenchyma in CT images,” in Medical Image Computing and Computer-Assisted Intervention—MICCAI 2010. New York: Springer, 2010, pp. 595–602. [26] J. Yao, A. Dwyer, R. M. Summers, and D. J. Mollura, “Computeraided diagnosis of pulmonary infections using texture analysis and support vector machine classification,” Acad. Radiol., vol. 18, no. 3, pp. 306–314, 2011. [27] U. Bagci, J. Yao, A. Wu, J. Caban, T. N. Palmore, A. F. Suffredini, O. Aras, and D. J. Mollura, “Automatic detection and quantification of tree-in-bud (TIB) opacities from CT scans,” IEEE Trans. Biomed. Eng., vol. 59, no. 6, pp. 1620–1632, Jun. 2012. [28] I. C. Sluimer, M. Prokop, I. Hartmann, and B. van Ginneken, “Automated classification of hyperlucency, fibrosis, ground glass, solid, and focal lesions in high-resolution CT of the lung,” Med. Phys., vol. 33, p. 2610, 2006. [29] Y. Song, W. Cai, J. Kim, and D. D. Feng, “A multistage discriminative model for tumor and lymph node detection in thoracic images,” IEEE Trans. Med. Imag., vol. 31, no. 5, pp. 1061–1075, May 2012. [30] X. Ye, X. Lin, G. Beddoe, and J. Dehmeshki, “Efficient computeraided detection of ground-glass opacity nodules in thoracic CT images,” in Proc. 29th Annu. Int. Conf. IEEE Eng. Med. Biol. Soc., 2007, pp. 4449–4452. [31] L. Srensen, S. B. Shaker, and M. De Bruijne, “Quantitative analysis of pulmonary emphysema using local binary patterns,” IEEE Trans. Med. Imag., vol. 29, no. 2, pp. 559–569, Feb. 2010. [32] J. K. Udupa and S. Samarasekera, “Fuzzy connectedness and object definition: Theory, algorithms, and applications in image segmentation,” Graph. Models Image Process., vol. 58, no. 3, pp. 246–261, 1996. [33] K. C. Ciesielski and J. K. Udupa, “Affinity functions in fuzzy connectedness based image segmentation i: Equivalence of affinities,” Comput. Vis. Image Understand., vol. 114, no. 1, pp. 146–154, Jan. 2010. [34] K. C. Ciesielski and J. K. Udupa, “Affinity functions in fuzzy connectedness based image segmentation II: Defining and recognizing truly novel affinities,” Comput. Vis. Image Understand., vol. 114, no. 1, pp. 155–166, Jan. 2010. [35] U. Bağcı, M. Bray, J. Caban, J. Yao, and D. J. Mollura, “Computerassisted detection of infectious lung diseases: A review,” Comput. Med. Imag. Graph., vol. 36, no. 1, pp. 72–84, 2012. [36] D. M. Hansell, A. A. Bankier, H. MacMahon, T. C. McLoud, N. L. Müller, and J. Remy, “Fleischner society: Glossary of terms for thoracic imaging,” Radiology, vol. 246, no. 3, pp. 697–722, 2008. [37] K. C. Ciesielski, J. K. Udupa, A. X. Falcão, and P. A. Miranda, “Fuzzy connectedness image segmentation in graph cut formulation: A lineartime algorithm and a comparative analysis,” J. Math. Imag. Vis., vol. 44, no. 3, pp. 375–398, 2012. [38] S. Sun, C. Bauer, and R. Beichel, “Automated 3-D segmentation of lungs with lung cancer in CT data using a novel robust active shape model approach,” IEEE Trans. Med. Imag., vol. 31, no. 2, pp. 449–460, Feb. 2012. [39] M. N. Prasad, M. S. Brown, S. Ahmad, F. Abtin, J. Allen, I. da Costa, H. J. Kim, M. F. McNitt-Gray, and J. G. Goldin, “Automatic segmentation of lung parenchyma in the presence of diseases based on curvature of ribs,” Acad. Radiol., vol. 15, no. 9, pp. 1173–1180, 2008. [40] J. Wang, F. Li, and Q. Li, “Automated segmentation of lungs with severe interstitial lung disease in CT,” Med. Phys., vol. 36, p. 4592, 2009. [41] M. Sofka, J. Wetzl, N. Birkbeck, J. Zhang, T. Kohlberger, J. Kaftan, J. Declerck, and S. Zhou, “Multi-stage learning for robust lung segmentation in challenging CT volumes,” in Medical Image Computing and Computer-Assisted Intervention—MICCAI 2011, G. Fichtinger, A. Martel, and T. Peters, Eds. Berlin, Germany: Springer, 2011, vol. 6893, Lecture Notes Comput. Sci., pp. 667–674. [42] Z. Xu, U. Bagci, and D. Mollura, “Efficient ribcage segmentation from CT scans using shape features,” in IEEE EMBC, Chicago, IL, 2014, pp. 2899–2902.
2310
[43] A. Frangi, W. Niessen, K. Vincken, and M. Viergever, “Multiscale vessel enhancement filtering,” in Proc. MICCAI, 1998, vol. 1496, pp. 130–137. [44] J. A. Sethian, Level Set Methods and Fast Marching Methods: Evolving Interfaces in Computational Geometry, Fluid Mechanics, Computer Vision, and Materials Science. Cambridge, U.K.: Cambridge Univ. Press, 1999, vol. 3. [45] M. E. Visser, M. C. Stead, G. Walzl, R. Warren, M. Schomaker, H. M. S. Grewal, E. C. Swart, and G. Maartens, “Baseline predictors of sputum culture conversion in pulmonary tuberculosis: Importance of cavities, smoking, time to detection and w-Beijing genotype,” PLoS One, vol. 7, no. 1, p. e29588, Jan. 2012. [46] Z. Xu, U. Bagci, A. Kubler, B. Luna, S. Jain, W. R. Bishai, and D. J. Mollura, “Computer-aided detection and quantification of cavitary tuberculosis from CT scans,” Med. Phys., vol. 40, no. 11, 2013. [47] Y. Song, W. Cai, Y. Zhou, and D. Feng, “Feature-based image patch approximation for lung tissue classification,” IEEE Trans. Med. Imag., vol. 32, no. 4, pp. 797–808, Apr. 2013. [48] Y. S. Park, J. B. Seo, N. Kim, E. J. Chae, Y. M. Oh, S. Do Lee, Y. Lee, and S.-H. Kang, “Texture-based quantification of pulmonary emphysema on high-resolution computed tomography: Comparison with density-based quantification and correlation with pulmonary function test,” Invest. Radiol., vol. 43, no. 6, pp. 395–402, 2008. [49] Y. Abramowitz, N. Simanovsky, M. S. Goldstein, and N. Hiller, “Pleural effusion: Characterization with CT attenuation values and CT appearance,” Am. J. Roentgenol., vol. 192, no. 3, pp. 618–623, 2009. [50] K. R. Nandalur, A. H. Hardie, S. R. Bollampally, J. P. Parmar, and K. D. Hagspiel, “Accuracy of computed tomography attenuation values in the characterization of pleural fluid: An ROC study,” Acad. Radiol., vol. 12, no. 8, pp. 987–991, 2005. [51] J. Yao, J. Bliton, and R. Summers, “Automatic segmentation and measurement of pleural effusions on CT,” IEEE Trans. Biomed. Eng., vol. 60, no. 7, pp. 1834–1840, Jul. 2013.
IEEE TRANSACTIONS ON MEDICAL IMAGING, VOL. 33, NO. 12, DECEMBER 2014
[52] J. K. Leader, R. M. Rogers, C. R. Fuhrman, F. C. Sciurba, B. Zheng, P. F. Thompson, J. L. Weissfeld, S. K. Golla, and D. Gur, “Size and morphology of the trachea before and after lung volume reduction surgery,” Am. J. Roentgenol., vol. 183, no. 2, pp. 315–321, 2004. [53] Z. Xu, U. Bagci, and D. Mollura, “Accurate and efficient separation of left and right lungs from 3-D CT scans: A generic hysterisis aproach,” in IEEE EMBC, Chicago, IL, 2014, pp. 6036–6039. [54] M. Sonka et al., Image Processing, Analysis, and Machine Vision. Pacific Grove, CA: PWS, 1999. [55] J.-M. Kuhnigk et al., “New tools for computer assistance in thoracic CT. Part 1. Functional analysis of lungs, lung lobes, and bronchopulmonary segments,” Radiographics, vol. 25, no. 2, pp. 525–536, 2005. [56] O. Weinheimer, T. Achenbach, C. P. Heussel, and C. Düber, “Automatic lung segmentation in MDCT images,” in Proc. 4th Int. Workshop Pulmonary Image Anal., 2011, pp. 241–255. [57] F. Malmberg, R. Strand, J. Kullberg, R. Nordenskjöld, and E. Bengtsson, “Smart paint—A new interactive segmentation method applied to MR prostate segmentation,” in MICCAI 2012 Workshop Prostate MR Image Segmentation Grand Challenge (PROMISE’12) , Nice, France, 2012, p. 1. [58] E. van Rikxoort and B. van Ginneken, “Automatic segmentation of the lungs and lobes from thoracic CT scans,” in Proc. 4th Int. Workshop Pulmonary Image Anal., 2011, pp. 261–268. [59] A. Montillo, “Context selective decision forests and their application to lung segmentation in CT images,” in Proc. MICCAI Workshop Pulmonary Image Anal., Toronto, Canada, 2011, p. 1. [60] S. Sun, C. Bauer, and R. Beichel, “Robust active shape model based lung segmentation in CT scans,” in Proc. 4th Int. Workshop Pulmonary Image Anal., 2011, pp. 213–224. [61] A. Mansoor, U. Bagci, and D. Mollura, “Near-optimal keypoint sampling for fast pathological lung segmentation,” in Proc. IEEE EMBC, Chicago, IL, 2014, pp. 6032–6035.