A Global Optimisation Algorithm for 802.11 WLAN Radio Resource Management Yapeng Wang
Laurie Cuthbert
MPI-QMUL Information Systems Research Centre A313, Macau Polytechnic Institute Macau SAR, China
[email protected]
Department of Electronic Engineering Queen Mary University of London United Kingdom
[email protected]
Abstract— the wireless link is still the bottleneck in 802.11 WLAN systems, especially in a public WLAN deployment with high-demand users. The most common way of improving the system performance is by accurate site planning, but this still does not cope with dynamic demand from users, such as in hotspots at an airport where travellers with WLAN laptops tend to gather at different gates at different times. In this paper, a novel intelligent radio resource management system for WLANs with low-cost semi-smart antennas is proposed and evaluated. The access points can re-configure their radio coverage patterns to balance hot-spot traffic. Using a global optimisation algorithm, significant performance improvement is discovered over traditional configurations by simulations. Keywords-802.11; Radio Resource Managemnt; Smart antenna
The 802.11 based WLAN standards are a set of very successful wireless standards and WLAN products based on those standards have spread to all mobile computing devices including mobile phones. Since the initial publication in 1997 [1], a lot of research work has been undertaken, particularly for improved modulation techniques in the physical layer [2, 3] and in better efficiency in the MAC layer [2, 4]. The 802.11 standard itself has evolved to adapt faster data rates from the original 2 Mbits/s to the currently popular 802.11g that supports 54 Mbits/s; beyond that, the new standard under development (802.11n) promises even speeds up to 540 Mbits/s. Along with the development of 802.11 standards, the demand by users for high data rates to support new applications (such as Video of IP, IP TV and peer to peer downloads) has been growing rapidly. The 802.11 was initially designed for deployment with a single access point: it tries to serve clients as long as they can associate to the access point with a minimum link quality. In the case of multiple access points (APs) forming a large overlapping coverage, mobile clients just associate to the AP that offers the strongest signal power. This works well when users are distributed fairly uniformly across the network and each AP has a moderate traffic load [5]. However, when users are bunched together to form a hot spot, and when their traffic demand is higher than the capacity of the AP serving the hot spot, the AP will be heavy loaded and users will experience lower offered data. Until now, there is no standard available to solve that problem, although a few studies [6-9] have been carried out using different techniques to balance users between cells when
non-uniform user and traffic distributions occur. However, these proprietary solutions mainly use association control (similar to Connection Admission Control) and need modification to the current 802.11 standards. As the 802.11 standards are already published, their solutions offer little practical benefit. Moreover, they are semi-static: association control only occurs when the user first tries to associate. In cellular networks, however, the concept of dynamic load control is well known with users being handed-over to other cells in order to optimise the overall network capacity. One such approach is to use semi-smart antennas to control the radiation pattern in a collaborative way to match the geographical distribution of load [10] for WCDMA networks. This paper adapted such concept and extended it to the 802.11 based WLANs. The APs can re-configure their radio coverage patterns cooperatively to balance hot-spot traffic. The reason why not using fully adaptive antenna in this research lies: a) although there is some research work in the literature [11, 12] trying to utilise fully adaptive antennas to increase 802.11 capacity, the aim there is mainly concentrating on improving air channel quality for individual users, the cooperation between APs being seldom considered; b) fully adaptive antennas are considerably more expensive than the semi-smart antenna approach, which is why it is unlikely that such antennas would ever be used in WLANs where the cost of equipment is very low. I.
PROPOSED SEMI-SMART ANTENNA FOR WLAN
In WLANs, multiple APs can cover a wider area to allow mobility between APs. The most common antennas used in WLAN AP are omni-directional diverse antennas, which give a circular shape coverage area. In order to achieve more controllable radio coverage patterns, this research assumes that every AP has a semi-smart antenna structured into four sectors of 90°. Each sector has multiple antenna elements and individual power control in order to achieve directional and controllable pattern, thus the combination of four sector antennas will give an AP the ability to produce flexible radio coverage patterns. The design of a four-sector antenna array is a compromise between performance and cost. More sectors will increase the flexibility of the coverage shaping but has the disadvantages that (i) more RF power controllers would be needed and (ii) each sector would need a narrower antenna pattern, so
1-4244-1312-5/07/$25.00 © 2007 IEEE
2144
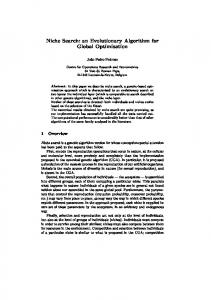
requiring physically bigger antennas. The four sector antenna pattern provides an overall coverage for each cell and by controlling the power to a sector the overall shape can be changed. In the simple example shown in Figure 1. seven APs are laid out in a hexagonal shape to cover a large area as in cellular networks. If a the central AP becomes heavily loaded because of the number of users simultaneously using that cell, then the central AP can drop the power in its sectors and reduce the numbers of users associated to it. By this method, the cell traffic can be reduced; the surrounding APs then can deliberately increase the sectors towards the traffic hot spot and “pick up” those users previously associated to the central AP. From the system point of view, the users in the central hotspot are effectively distributed to several APs instead of crowded in a single AP.
Figure 1. Cooperative changing AP coverage patterns to reduce hot spot.
II. THE GOA ALGORITHM In the author’s previous studies, an algorithm using distributed intelligent agents with cooperative negotiation techniques was invited [13, 14], agents representing APs “talk” to each other in order to produce radio coverage patterns hot spot usage scenarios. With the GOA, APs (treads running on server) periodically calculate their load utility and when the utility is higher than a threshold, the heavily loaded AP calculates and finds the least important STA(s) and informs the global optimiser that they will be unserved STA(s). The unserved STA(s) will attract adjacent APs to serve themselves and as a result, the STA(s) may be served by new AP so accomplishing the aim of load balancing. The process is iterated until all unserved STAs are reassociated or the iteration limit reached. During the iteration process, many power changes, deassociations and reassociations may occur, so the APs are only commanded to perform the antenna power change and actual deassociating of STAs at the final step. This is to ensure the network does not oscillate too much and keeps stable. The GOA can be run as a software service on one of the servers on the network without adding any new hardware. In the GOA, each serving STA was assigned a vector called
G0
repulsion force R ij . The direction of the force is from the i-th traffic unit within its frontier and is expressed as in (1).
G Rij0 = (di ,max − dij ,θij ) (1) Where dij and θij is the distance and angle from the i-th access point to the j-th mobile client, and di ,max is the distance to the frontier for the i-th access point. The radial repulsion
force represents how interested the access point is in having the specific mobile client assigned to it. As the repulsion force decreases with distance, the mobile client closest to the access point has the higher priority to be served. An AP’s serving range is set in such a way that the magnitude of the repulsion forces of clients are larger or equal
G0
to a threshold value, R iT , the amount of traffic demand inside is less than or equal to its capacity, and all antenna sectors radiation power is in the adjustable range. Calculating
G0
the threshold R iT is a local optimisation problem. The local list of mobile clients (i.e. clients within the frontier) is sorted by their repulsion force into descending order. The threshold is determined by the repulsion force magnitude of the last one that still satisfies all constraints. As the length of this local list is reasonably short, this simple searching algorithm is efficient enough for the need of computation performance. With light traffic load, all local traffic demand is well under the threshold so there is no need to readjust the list among the access points. However, the local lists of STAs will start adjustment as soon as one access point exceeds its maximum load. Once the list of an AP has exceeded the threshold, which means the associated mobile clients’ demand are higher than the AP’s capacity, the AP will send details of unserved clients to the central optimiser. The central optimiser will then start a series of re-allocating iterations in order to reduce the number of unserved mobile clients. The reallocation of clients is achieved by adding attraction forces from the unserved mobile clients to all nearby served clients in order to adjust the initial repulsion forces. The local optimisations are re-performed with the updated repulsion forces. This process is iterated until the number of unserved clients reduces to zero or the pre-defined number of iterations is reached. In this manner, the APs try to serve the unserved STA as it distorts the attraction forces nearby, and finally the optimum solution can be obtained for the current traffic condition. Figure 2. shows an example of a scenario with three APs.
Figure 2. Three access points and an unserved mobile client
Suppose there is a traffic hot spot in the area of AP1 coverage; AP1 experiences high traffic load and mobile client V4 is exceeding the threshold. AP1 will then inform the central optimiser that V4 is an unserved mobile client. As the iteration is performed by APs in a one-by-one manner, AP2 will then check if V4 is in its coverage range. As AP2 can serve V4, it will then calculate attraction forces to all clients it currently served (i.e. T1, T2 and T3). The attraction force from the k-th
1-4244-1312-5/07/$25.00 © 2007 IEEE
2145
Vk to the j-th mobile client T j at the i-th base JG λ APi during the λ -th iteration is defined as Akj
unserved client
access point in the local polar coordinates,
JG λ °( w0 , θij ), k= j Akj = ® (2) °¯( w0 , θij − θik ), k ≠ j Where θik and θij are the angles from the i-th access point APi to Vk and T j respectively, and w0 is a constant for controlling the attraction force to repulsion force ratio. For instance, the A43 in Figure 2. represents the attraction force at the mobile client T3 generated from the unserved units V4. If there is more than one unserved mobile client within the
JG λ
frontier, the resultant attraction force A j for the client T j is calculated by the vector sum of attraction forces from all the unserved clients Vk , expressed as (3).
JG λ Ui λ A j = ¦ Akj
(3)
k =0
Where U i is the number of unserved mobile clients near
JG λ
unserved clients along with served clients will share the total bandwidth and every client will experience data rate lower than the demand. Only after the optimisation converges (all unserved traffic units have been eliminated) or the maximum number of iterations has reached, are steps taken to adjust the actual powers in the antenna sectors and to reassociate mobile clients. This means the network does not change its current state until the optimisation is done, so the oscillation described above will not cause any disturbance to the current network. III.
SIMULATION AND RESUTLS
A real environment (the third floor of Macao Polytechnic Institute academic building) is used to test the performance of GOA. The building is a rectangular shape measuring 80×200m. It contains many classrooms surrounding 3 open squares. In the middle on the right there is a lecture theatre where large classes or seminars can be held. The 3-D model floor plan and locations of the APs are shown as in Figure 3. Eight APs are evenly placed in the testing environment, with 6 APs around the perimeter and 2 in the middle. All corner APs are equipped with 2 faces of the semi-smart antennas, each face covering 90 degree. The 2 APs in the central area are equipped with 4 faces of the semi-smart antennas. All semi-smart antennas have step power control between 0 – 20 dBm (1 dBm step). 2 hot spots are generated in the middle of the testing area and each hot spot’s radius is 20 m.
the i-th access points. The new repulsion force R ij in the λ th iteration is obtained by adding two parts together: the previous repulsion force, and the projection of the new resultant attraction force in the radial direction. It is formulated as (4).
increased by the attraction forces at the same side of the AP, and decreased by them at the opposite side. This results in the AP favouring serving the clients towards the unserved client V4 (including V4 itself). As AP2 tends to serve clients towards V4 (also the hot spot area), the client at the other side (e.g. T2) will get less repulsion force from the AP and may be selected as an unserved STA for the next iteration (if AP2 cannot serve all clients including V4). In this fashion, a chained handover (T2 being served by AP3 in the next iteration) is achieved as expected. This is the main purpose of employing attraction forces here as it is used as a means of inter-AP communication. This adjustment iteration is repeated until the optimisation has converged or the maximum number of iterations has been reached. After that, the traffic hot-spots are dispersed through the whole WLAN. If there are still unserved mobile clients, the clients will be re-assigned to the AP with the strongest signal power. This is because in 802.11 networks, all mobile clients are served no matter what the traffic load conditions are in the APs. These
Figure 3. 3-D model of floorplan and APs' antennas directions and layout
20 independent simulations using different random seeds are performed; the result of load/demand is shown in Figure 4. The results show that using GOA with semi-smart antennas, the system has much better performance than a traditional network setup. When there are over 200 users in the testing environment, there is little benefit from using GOA as the network is then very heavily loaded. However, 200 users is an extreme conditions (even in a university), normally 80 to 100 uses in such a area is considered as a heavy load 1.0
traditional network GOA with semi-smart antennas
0.9 0.8
overall load/demand
JG λ JG λ −1 JG λ Rij = ( R ij + A j ⋅ cos(θ j − θ ij ), θij ) (4) JG λ −1 Where R ij is the repulsion force from the previous control iteration and θ j is the angle of the resultant attraction JG λ force A j . As shown in Figure 2. the repulsion forces are
0.7 0.6 0.5 0.4 0.3 0.2 0.1 0.0 0
50
100
150
200
Number of users
Figure 4. Simulation result for Load/Demand
1-4244-1312-5/07/$25.00 © 2007 IEEE
2146
The improvement of load/demand is depicted in Figure 5. From this it can be seen the gain reaches its peak value of 36% gain when there are about 80 users in the system. Again, the system can accommodate 40 users without degrading user’s traffic demand compared with 20 users using a traditional network setup. The improvement eventually tail off because the total resource is limited and will not be about to accommodate more user even with GOA and semi-smart antennas. 40
Improvement of system load/demand
Improvement of Load/Demand (%)
35
maximum improvement
30 25 20
REFERENCES
load/demand=1 for using GOA
10 5
0
50
100
150
200
Number of users
Figure 5. Improvement of Load/Demand
Figure 6. shows individual AP’s aggregated user traffic demand when there are 80 active users in the system. From the diagram, it can be seen that by using GOA, the demand is efficiently re-balanced among different APs. Traditional Network GOA
16
Users traffic demand in AP (Mbits/s)
IV. CONCLUSION In this paper, a new global optimisation algorithm is proposed and evaluated. This method uses a centralised control where an iterative calculation calculates each AP’s antennas radiation power and association controls. The optimisation goal is reached when either all users’ traffic demand is satisfied or the maximum number of iteration is reached. The central server can be placed in the backbone network of the WLAN (usually a LAN network) and perform the calculation, periodically monitoring all APs traffic conditions and performing an optimisation calculation if certain threshold is reached.
15
0
14 12 10 8
AP's maximum capacity
6 4 2 0 1
2
3
4
5
6
7
8
Access Point
Figure 6. Individual Access Point's traffic demand 30
Traditional Network GOA with Semi-Smart
25
Number of Associated Users
The number of users associated with each AP is shown in Figure 7, which confirms that users are shifted from heavily loaded APs to more lightly loaded ones
20
15
[1] IEEE, IEEE Std 802.11-1997: Wireless Lan Medium Access Control (MAC) and Physical Layer (PHY) Specifications: IEEE Computer Society, Nov 1997. [2] "IEEE 802.11 WG, Part 11: Wireless LAN Medium Access Control (MAC) and Physical Layer (PHY) specifications, Standard," IEEE Standard Aug 1999. [3] J. Zyren, "IEEE 802.11g Explained," in Wireless Networking: Intersil Corporation, December 2001. [4] G. Bianchi, I. Tinnirello, and L. Scalia, "Understanding 802.11e contention-based prioritization mechanisms and their coexistence with legacy 802.11 stations," Network, IEEE, vol. 19, pp. 28-34, 2005. [5] A. Prasad, N. Prasad, A. Kamerman, and H. Moelard, "Performance Evaluation, System Design and Network Deployment of IEEE 802.11," Wireless Personal Communications, pp. 57-59, 2001. [6] T.-C. Tsai and C.-F. Lien, "IEEE 802.11 hot spot load balance and QoSmaintained seamless roaming," presented at National Computer Symposium (NCS), 2003. [7] H. Velayos, V. Aleo, and G. Karlsson, "Load balancing in overlapping wireless LAN cells," presented at IEEE ICC'04, June 1998. [8] A. Kumar and V. Kumar, "Optimal Association of Stations and APs in an IEEE 802.11 WLAN," presented at 11th National Conference on Communication, January 2005. [9] Y. Bejerano, S.-J. Han, and L. E. Li, "Fairness and Load Balancing in Wireless LANs Using Association Control," presented at ACM Mobicom 2004, Philadelphia, PA, USA, September 2004. [10] L. Du, J. Bigham, and L. Cuthbert, "Intelligent cellular coverage control according to geographic call traffic distribution," presented at Third International Conference on 3G Mobile Communication Technologies, 2002. [11] H. Singh and S. Singh, "Tone based MAC protocol for use with adaptive array antennas," presented at Wireless Communications and Networking Conference, 2004. WCNC. 2004 IEEE, 2004. [12] M. Budsabathon, Y. Hara, and S. Hara, "Optimum beamforming for preFFT OFDM adaptive antenna array," IEEE Transactions on Vehicular Technology, vol. 53, pp. 945- 955, 2004. [13] Y. Wang, L. Cuthbert, and J. Bigham, "Agent-based Load Balancing of WLAN in In-door Usage," presented at The 3rd IASTED International Conference on Wireless and Optical Communications (WOC 2003), Banff, Canada., 2003. [14] Y. Wang, A. Ma, and L. Cuthbert, "IEEE 802.11 WLAN load balancing using adaptive antennas and cooperative controls," presented at the IET International conference on Wireless, Mobile & Multimedia Networks, Hangzhou, China, 2006.
10
5
0 1
2
3
4
5
6
7
8
Access Point
Figure 7. Individual Access Point's Associated Users.
1-4244-1312-5/07/$25.00 © 2007 IEEE
2147