being either analytical approaches (gradient-search optimisation methods and .... acting as a source of noise helps the system to escape from local minima. ..... regards the search engine used, the ASA method compared to the SGA was found ...
A geometry based optimisation algorithm for conformal external beam orientation Eduard Schreibmann1,3, Rosa Uricchio1, Michael Lahanas1, Kiki Theodorou3, Constantin Kappas3, Nikolaos Zamboglou1,2 and Dimos Baltas1,2
1. Department of Medical Physics & Engineering, Strahlenklinik, Klinikum Offenbach, 63069 Offenbach, Germany. 2. Institute of Communication & Computer Systems, National Technical University of Athens, 15773 Zografou, Athens, Greece. 3. Medical Physics Department, Medical School, Patras University, 26500 Rio, Greece.
Abstract We consider topology based criteria for the selection of optimal beam orientations for conformal external radiotherapy. The advantage of such an approach is that computation time is considerably reduced since no dose calculation is required. The algorithm preclassifies all possible irradiation directions by assigning to each a fitness measure, the geometry fitness factor (GFF). This factor is a measure of the degree of fitting of the beam 3D shape to the planning target volume (PTV) by simultaneously avoiding any intersection with the critical structures. Individual shielding and table-gantry collision as well as userdefined margins are taken into account. After classifying all possible beam directions, adaptive simulated annealing (ASA) has been used to search for an optimal configuration of a specific number of beams by minimizing a cost function that takes into account individual beam feasibility and beam spacing. The appropriateness of choosing ASA as optimisation procedure has been checked by comparing its performance with that of the standard genetic algorithm (SGA). A phantom case where the best directions are a priori known was used to test the beam selection criteria. The robustness of the initial hypothesis is tested by comparing the dosimetric results of standard and optimised plans for a set of three clinical cases.
E Schreibmann et al: A geometrical-based beam orientation optimization algorithm for conformal external beam radiotherapy
1. Introduction A fundamental step in radiotherapy treatment planning is the selection of a suitable number of beams and their 3D orientation. There are a number of factors which influence the choice of a beam configuration. However in practice empirical knowledge relating to standard configurations such as library plans consisting of three fields (star pattern) or four fields (box technique) is often used due to ease and effectiveness of implementation. In addition the individual patient anatomy in terms of the location and shape of the planning target area and the organs at risk (OAR) and any other body structure influencing the planning and delivery of the treatment, must be considered. The problem of optimisation of beam angles, based on computing for each beam a measure of its feasibility has been studied by Myrianthopoulos et al (1992) and McShan et al (1995). Feasibility in our study is determined by inspecting the geometry and intersection volumes between beam and possible OARs. Results are displayed as a colour-coded virtual sphere surrounding the patient anatomy. The selection of the final beam set is performed according to planning criteria and experience. Recently, search techniques have been developed to automate the beams selection process (Soderstrom et al 1992). The optimisation was performed for both coplanar and non-coplanar cases, using objective functions based on dose criteria and radiobiological objectives. The search techniques used being either analytical approaches (gradient-search optimisation methods and stochastic methods) or guided random search techniques such as simulated annealing. These studies have shown that in terms of geometry, an optimised plan should satisfy two main criteria (Bortfeld et al 1993, Das et al 1997). The criteria are: (a) the volume of the combined beams should conform as close as possible to the PTV, because in this way the dose to the healthy tissue is reduced and (b) the dose received by OARs is the minimum possible. The first requirement is best fulfilled by using equispaced beams, while the second one can be achieved by minimizing the intersection volume between the beams and each OAR, by increasing the number of beams or by ensuring that the beam passes as distantly as possible from the OARs. A drawback of optimisation algorithms is that they require the evaluation of a large number of solutions, thus requiring long computation times. In optimising beam directions, if the search space is divided with a resolution of 5°, and for a six beam plan the resulting number of possible beam combinations is estimated to be 3x10²⁰ (Cho et al 1999). An alternative approach to speed up the computation could be to simplify the calculation model by using in the objective function different optimisation criteria, other than considerations based on dose calculation. The idea to use geometrical considerations in the cost function was first proposed and analysed by Haas et al (1998). A coplanar beam orientation optimisation is obtained by considering multi-objective cost function that aims to geometrically conform the 2D beam’s intersection to the PTV surface while minimizing the intersection area between beams and OARs, for the most representative 2D computed tomography slice in the plan. A genetic algorithm is further used to minimize the cost function. The idea is refined in a recent study (Wagner et al 2001) where an optimised plan for stereotactic radiosurgery is obtained by using a cost function in which the projection structures area is used as geometrical measure of beam appropriateness. A downhill optimization process is applied to minimize this cost function. This work uses an adaptive simulated annealing algorithm (ASA) and a true volume computation to optimise a geometrical multi-objective cost function. By using a direct calculation of the volume intersection between the beam and OARs it takes into account beam divergence and concave shapes, and it improves the search technique by replacing the downhill optimisation with ASA, because gradient-based algorithms could in some cases provide only a local optimal solution. There are three main differences from the work of Haas et al: (a) the 3D volume of intersection is computed rather using the 2D slice approach, (b) both concave and convex beam shapes are considered, and (c) individual beam shaping by blocks or multi-leaf
2
E Schreibmann et al: A geometrical-based beam orientation optimization algorithm for conformal external beam radiotherapy
collimators is implemented. The optimisation algorithm makes use of simulated annealing instead of genetic algorithms when minimizing the cost function. By comparing the results obtained by ASA with a standard genetic algorithm when minimizing the same cost function, it is shown that ASA is most suitable for optimising the geometrical cost function, both in computation times and in the quality of the final solution found.
2. Methods 2.1. Beam direction Possible beam directions are quantified by studying in user-defined discrete steps of usually 5° for the table and gantry movements. The beam directions are identified with points on a virtual sphere situated around the patient and centred at the isocenter. Each point represents a possible beam direction, and can be transferred to a set of corresponding table and gantry angles by a transformation from Cartesian coordinates to spherical coordinates. The transformation is consistent with the machine movement directions. These points are checked for practical deliverability by eliminating directions corresponding to beams passing through regions where there is a lack of anatomical data, or for positions where a collision between gantry and table would occur. The elimination of beam directions corresponding to a lack of anatomical data is checked by comparing the point’s z coordinate with the z coordinate limits of the scanned CT data. A second test, for gantry and table collision is checked by searching for intersection between two simple polygonal models of the gantry and table. 2.2. Plan settings The customization of a treatment plan includes the possibility of using individual shielding, definition of margin for the PTV or OARs, and possible limits on the gantry or table movements. When using individual shielding, the beam is constructed to fit the PTV projection to the source. When not using individual shielding, an oriented bounding box (OBB) (Gottschalk et al 1996) algorithm is used to determine the best fit collimator. The OBB computes a box that would minimally encompass the target. The orientation of this box is identified with the collimator rotation, and the box dimensions give the collimator size. The possibility to use an non-isotropic margin around a selected structure (PTV or an OAR) can be implemented by using spline transformations, which have the property that given a set of source points and another set of target points, it computes a transform that translates the source points into the target points. The source points are defined as the corners of the structure’s bounding box. The target points are selected as the corners of a second bounding box that encompass the required final surface. When the transformation is applied, the structure is inflated resulting to a not-isotropic margin around the initial surface. This method has the advantage that it can be applied on both convex and concave surfaces. For practical reasons, the user may want to impose some restrictions on the movements of table or gantry. For each restriction, a set of upper and lower angular limits are fixed. This option is implemented by eliminating from the virtual sphere the points corresponding to angles situated outside the user-defined limit. 2.3. Beam feasibility pre-calculation Each beam direction is classified by taking into account the intersection volumes between beam and OARs. The measure used to evaluate each beam feasibility is the geometrical fitness factor (GFF), defined as:
æ (PTV ∩ B ) ö N æç (OARi ∩ B ) ö GFF = ç ÷ * wi ç1 − OARi è PTV i =1 è
(1)
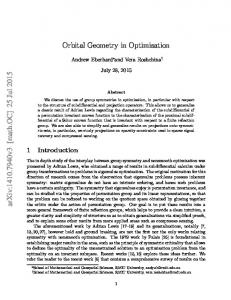
This GFF describes the two regions that should be maximized, namely part of the PTV irradiated and part of the OAR spared, see Figure 1. The term (PTV ∩ B ) is the volume
3
E Schreibmann et al: A geometrical-based beam orientation optimization algorithm for conformal external beam radiotherapy
intersection between the PTV and the beam B, and the term (OARi ∩ B ) the intersection volume between the beam and the ith OAR. Thus, the first factor in equation 1 describes the part of the PTV that is irradiated by the beam and the second factor is a measure of that part of ith OAR not intersected by the beam. The terms wi are the score function weights for each critical structure, specified according to the planning objectives. This procedure has two advantages. First it gives the possibility to store the GFF value for each beam. This pre-processing avoids the calculation of the beam score at each iteration of the optimisation procedure and significantly reduces the time required for optimisation. The second advantage is that the score for each beam can be represented graphically, enabling the treatment planner to quickly analyse the result of the optimisation and make any necessary adjustments.
Figure 1. The geometry for computing GFF values for individual beams in a simplified 2D representation. The beam edges are shown as dashed lines and the PTV and critical structures are represented with solid lines. The aim is to maximize the shaded areas: (1) A portion of irradiated PTV, PTV ∩ B and (2) A portion of spared OAR OARi ∩ B .
(
)
(
)
2.4. Cost function For finding the set of beams that would best fit our goals, we define a bi-objective cost function. The objectives are (a) producing plans containing adequately spatial distributed beams and (b) selecting beams directions that do not pass through OARs. Taking into account these two objectives, we select our cost function as Nb (2) CF = w1 * GCOIN + w2 * ∏ GFFi i
In the first term of equation 2, Geometrical Conformity Index (GCOIN) is a measure of how the beam set covers the PTV, and is defined in equation (3) as: GCOIN
NB NB é ù é ù ê PTV ∩ 1 B i ú ê PTV ∩ 1 B i i =1 i =1 ú*ê = ê NB PTV ê ú ê Bi 1 ê ú ê ë ë i =1
(3)
This is defined in an analogue way as the Conformal Index COIN introduced by Baltas et al NB
(1998)
1 B is the intersection volume of the N beams B , i=1,…,N . Thus the first factor is a i
i =1
i
B
measure of how well the beams conform to the PTV. As the beam coverage follows the pattern of the PTV volume it approaches unity and has smaller values for poor beam orientations. This is because beams having close entrance points will generate a large intersection volume in the overlap region and thus a low value for the first factor in equation 3. The second factor is that part of the PTV covered by the intersection of all beams. This factor is also usually less than unit and would ideally approach unity, see Figure 2. As both
4
E Schreibmann et al: A geometrical-based beam orientation optimization algorithm for conformal external beam radiotherapy
5
terms are less than unit but ideally approaching unity, the entire GCOIN would ideally tend towards unity.
Figure 2. The geometry for GCOIN calculation in a simplified 2D representation. A set of two beams is NB
selected their edges are shown as dashed lines. The aim is to conform the beams intersection,
7B , i
i =1
which is shown as shaded area, to the PTV shape.
The term w2 *
NB
∏ GFFi
in the cost function represents the product of individual
i
feasibilities for beams in the set. The weights w1 and w2 are the importance factors assigned to each objective. 2.5. Optimisation procedure The optimisation procedure aims to automatically detect the optimum beam positions. The problem of so many beams combinations, due to the large number of possible beams requires the use of stochastic optimisation algorithms. We compared the performance of two such algorithms: the standard genetic algorithm and adaptive simulated annealing algorithm.
2.5.1. Adaptive simulated annealing Consider the analogy with a technique known in metallurgy when a molten metal reaches a crystalline structure which is the global minimum thermodynamic energy of the system, if it is cooled slowly enough. The parameters (configurations) are produced randomly according to a so called visiting probability distribution. The cooling schema depends on this visiting probability distribution. In SA two consecutive configurations are compared. The temperature acting as a source of noise helps the system to escape from local minima. Near the end of the cooling process the system is hopefully inside the attractive basin of the global optimum. The challenge is to decrease the temperature fast enough without any irreversible trapping at any local minimum. Two basic methods have been developed. The generalized SA method (GSA) that follows from the Tsallis distribution and the adaptive SA method (ASA) (Ingber 1989,1992) that uses a re-annealing and adapts the cooling for each individual decision variable by analysing its sensitivity upon temperature changes. ASA has the following three advantages over other simulated annealing algorithms: (a) It enables a faster convergence rate (b) solutions can be obtained from a bounded parameter space and (c) the convergence rate is adapted to parameter sensitivity.
2.5.2. Standard genetic algorithm The standard genetic optimisation algorithm (SGA) as described by Goldberg et al (1989) was used for the optimisation process. Each beam direction is encoded as the index. The number of parameters is identical with the number of required beams in the plan. Each
E Schreibmann et al: A geometrical-based beam orientation optimization algorithm for conformal external beam radiotherapy
parameter is allowed to take values between 0 and the number of possible beam positions. At each iteration, one or more of the beam indices are changed and a new solution is obtained. The SGA uses integer arithmetic, because beam indices are integer numbers and a configuration based on integer arithmetic enables a faster optimisation process than would be otherwise be possible. We use a binary representation for the chromosomes. The mutation operator was implemented by flipping a bit of each chromosome with a given probability. The crossover used was a simple one point crossover operator. The elitistic option (the best solution found is preserved in the new generation) was used to improve the algorithm’s performance. Selected parameters were a crossover probability of 60% and a mutation probability of 1%.
2.5.3. Rearrangement of the beam directions ASA performs better if the states to be optimised are ordered in the GFF space. Since the beam positions indices are transferred to indices based on their position, as the index increases or decreases, the GFF associated with the beam takes different values. A small change in the beam index gives an unordered change in feasibility. ASA works by adding fine grains to the indices, and thus it is more suitable to construct the indices in the order of beam’s GFF value before proceeding with the optimisation. This is because in this way a change in indices will result in a expected change in the beam’s GFF. To implement this we constructed a map from the beam indices to a set of ordered beam indices, and ran the optimisation on this second set. The initial state of the algorithms includes plans that are supposed to be good. The optimised plans would have either a high GFF value for individual beams, or the beams would be equally spaced to spare normal tissue. We found that it is more efficient to modify the initial state to include equally spaced beams, since this increases the convergence of the algorithms.
3. Results In order to assess whether the optimisation algorithm can lead to a better plan, we compared the dose distribution for three clinical plans and the corresponding optimised plans. We also made a comparison for a phantom case where the ideal beam directions are simple to guess. The clinical cases were obtained by delineating contours using a Nucletron treatment planning system PLATO RTS Vs. 2.5.2 (Nucletron B. V. Veenendeal, The Netherlands) and importing them to the optimisation software. We searched for a plan containing the same number of beams and using the same shielding option, as the plan created in PLATO. Because the contours are identical in both plans it is possible to make a comparison by visual inspection and by a dosimetric analysis based on dose volume histograms (DVH). 3.1. Phantom case In the phantom case all structures are modelled as spheres. The PTV is represented by a sphere of radius 20 mm situated in the centre of the patient model and the two OARs are represented by spheres of radius 40 mm situated at a distance of 70 mm from the PTV. The OARs are positioned along the x and y axis of the model. To test the beam selection algorithm, we choose to run the optimisation for a plan containing the table fixed at 0° (coplanar beam geometry), using blocks to protect the OARs, no margin defined for the PTV and OARs and an angular resolution of 1°. All OARs were assigned the same weight of unity. Because of the simple geometry, we can guess that an optimum plan configuration will be composed of beams that irradiate the PTV, and are between the two OARs in order to avoid them. In addition, in order to spare the healthy tissue, we expect beams to be equally spread between the available angles. The expected beam angles and the beam angles found by the optimisation procedure are shown in Figure 3a. The optimised angles differing by 2° and 1° from the expected angles at 47° and 316°. This can be justified by the fact that
6
E Schreibmann et al: A geometrical-based beam orientation optimization algorithm for conformal external beam radiotherapy
the phantom geometry permitted us to put beams that do also not intersect the OARs at 47° and 316°. The method of calculating GCOIN is not very sensitive to small changes in beam orientations. The time needed to compute the four beams optimisation, starting from the precalculated GFF values, was 4 seconds. If we use a different number of beams, the beams chosen will have more or less the same angles as in the case of using four beams, but they will always respect the preferential directions previously described, and the equal distance condition. Figure 3b shows the result of calculation using ASA for the phantom case, for six beams. For more than four beams the condition of equally spacing the beams becomes more difficult to satisfy because beams then tend to pass through OARs.
Figure 3. Comparison between ideal and optimised plans for a test case consisting of a spherical PTV and two OARs. The optimisation was performed for a plan containing the table fixed at 0°, using blocks to protect the OARs, with no margin defined for PTV and OARs, and with an angular resolution of 1°. (a) The beam positions found after optimisation, are represented by lines. For each position, the gantry angle found by optimisation is marked, and in brackets, the expected gantry angle. (b) Selected beam directions for an optimised plan containing six coplanar beams. The beam position of the four beam plan remain unchanged, the two additional beams are selected to intersect as less as possible from the OARs but still satisfying the equal spacing condition.
3.2. Clinical case 1 The first clinical case represents a brain tumour of 233 cm3 volume. The eyes and the myelon, as well as the whole brain, have been delineated as radiosensitive structures. A clinical plan consisted of two beams, one lateral and one anterior oblique, see Figure 4. For the optimization algorithm a non-coplanar configuration was selected, with 2° angular resolution, shielding of OARs, and no limits imposed on gantry or table movement. The importance factors used were 1 for the eyes, 0.8 for the myelon and 0.5 for the brain. Two plans were generated, with two and three beams respectively (see Figures 5, 6). The resulting DVHs (see Figure 7) show a decrease in the dose received by both eyes, especially for the left eye. This is at the expense of an increase in the dose received by the brain at high dose values. Comparing the clinical and the optimised plan containing two beams, for the left eye, the maximum dose decreased from 59 cGy to 41 cGy, and the average dose from 19 cGy to 7 cGy. The average dose received by the brain decreased from 111 cGy to 108 cGy. In the case of the optimised three beams plan (see Figure 6) the maximum and the average dose for the left eye was 15 cGy and 7 cGy respectively, where the average dose for the brain was 104 cGy.
7
E Schreibmann et al: A geometrical-based beam orientation optimization algorithm for conformal external beam radiotherapy
Figure 4. A clinical case of brain tumour Beam arrangement for the clinical plan (a) 3D view of patient anatomy and the selected beams. (b) BEV view of the first selected beam, at table angle T=0°, and gantry angle G=90° (c) BEV view of the second beam, at table angle T = 270° and gantry angle G=349°.
Figure 5. Beam arrangement for the optimised plan containing 2 beams (a) 3D view of the selected beams. (b) BEV view of the beam, at table angle T=0°, and gantry angle G=225° (c) BEV view of the second beam, at table angle T = 0° and gantry angle G=36°
Figure 6. Beam arrangement for the optimised plan containing 3 beams. (a) 3D view of the selected beams. (b) BEV view of the first selected beam, at table angle T=0°, and gantry angle G=45° (c) BEV view of the second beam, at table angle T = 0° and gantry angle G=225° (d) BEV view of the second beam, at table angle T = 0° and gantry angle G=100°
8
E Schreibmann et al: A geometrical-based beam orientation optimization algorithm for conformal external beam radiotherapy
a)
100
PTV
Volume (%)
80 60
Brain
40
Body Eye R 20 0
0
Eye L
50
100
150
200
Dose (cGy)
b)
100
PTV
Volume (%)
80 60
Brain
40
0
Body
Eye R
20
Eye L 0
50
100
150
200
Dose (cGy)
c)
100
PTV
Volume (%)
80 60
Brain
40
Body Eye R Eye L
20 0
0
50
100
150
200
Dose (cGy)
Figure 7 DVH analysis for the brain tumour case. Three cases are involved, a clinical plan represented by a full curve, an optimised plan with 2 beams with a dash line and an optimised plan with 3 beams, (dotted line). a) Comparison of the Clinical case with the optimised plan (2 beams), b) Comparison of the Clinical case with the optimised plan (3 beams), c) Comparison of the optimised plans with 2 and 3 beams.
9
E Schreibmann et al: A geometrical-based beam orientation optimization algorithm for conformal external beam radiotherapy
3.3. Clinical case 2 : Comparison between SGA and ASA speed A prostate case with a PTV volume of 28.65 cm3 was chosen. The femurs, ileum, ischium, pubis, sacrum bones, as well as the rectum, were delineated as OARs. The weights assigned were 1 for rectum, 0.8 for bladder and 0.1 for the bones. The plan consisted of a coplanar configuration with the table fixed at 0°, with shielding defined, and without limits imposed on table or gantry movement. The optimised plan found the best directions at 0°, 90°, 180° and 270°, identical with the angles selected in the clinical plan. This case was also used to compare the performance of ASA with SGA. In Figure 8 the performance of the genetic algorithm is shown. The evolution of the best individual for different settings of the population size and number of generation was recorded for 20 consecutive runs, and the mean value of these runs is displayed. Three configurations are considered, a small population and only a small number of generations, a large population with a small number of generations, a small population with a large number of generations. It can be observed from the graphs that increasing the population size has some advantages over increasing the number of generations size: It has a greater probability of finding a global minimum and it needs a shorter computation time. Increasing the population size, a mean final value of 0.18859 was obtained, compared to the mean cost function of 0.18881 when increasing the number of generations. Also, increasing the population size gives similar result from run to run. The standard deviation of the final cost value was 0.00085 compared with 0.0017 when we used a large number of generations. In conclusion, increasing the population size is advantageous both in computing time and in the final cost value found. It is interesting to note that the two long runs did not guarantee that increasing the population size and number of generations will always lead to a better solution. Figure 9 shows the result obtained with ASA with different parameters for the annealing scale ni. Compared to SGA, ASA gave better results both in speed and final cost function value, but only if parameters are chosen carefully. The final cost function found was 0.18725 for using ni =1, which is lower than the value found by SGA when using a large population size and a high number of generations. For other values of ni, the final cost values were 0.188548, 0.188624, and 0.189478. These are values that are comparable with the one found by SGA. The time needed for calculation was 14 seconds, less than the 88 seconds time needed by SGA to find a comparable value for the cost function.
Cost Value
0.22
N = 100 t= 1000 N = 1000 t= 100 N = 1000 t= 1000
0.21
0.20
0.19 0
200
400 600 Generations
800
1000
Figure 8. Comparison of best cost function for each generation during SGA optimisation. Each graph is taken using different settings for the population size N and number of generations t. For the set N = 1000, t= 100, computing time was 88 seconds, the mean final cost value 0.18859 while for the set N = 100, t = 1000, computing time was 250 seconds, mean final cost value was 0.18881. The best final value found of 0.18746 was obtained for a population of 1000 individuals over 1000 generations, at the expense of a computing time of 890 seconds.
10
E Schreibmann et al: A geometrical-based beam orientation optimization algorithm for conformal external beam radiotherapy
Cost Function
0.22
S=1 S=3 S = 10 S = 100
0.21
0.20
0.19 0
2000
4000 6000 Iteration
8000
10000
Figure 9. Convergence analysis for different annealing scale S settings of ASA optimisation. The final cost value ranged between 0.1872 and 0.189478, the first being a better value that the one found by SGA in all the runs. Computation time was 14 seconds.
3.4. Clinical case 3 The third clinical case selected was a prostate tumor of volume 176 cm3. The bladder, rectum and the bony structures have been delineated as critical structures. The plan settings used where a fixed table angle of 0°, and shielding of OARs. The plan found by the optimization algorithm differed from the four beam clinical plan by a rotation of the whole configuration of some 10°, see Figure 10 and Figure 11. The result of this change was a decrease of the average dose from 147 cGy to 144 cGy in the bladder, and from 153 cGy to 145 cGy in the rectum. Maximum dose decreased from 181 cGy to 177 cGy in the bladder and from 184 cGy to 178 cGy in the rectum, see Figure 12.
11
E Schreibmann et al: A geometrical-based beam orientation optimization algorithm for conformal external beam radiotherapy
�
�
� �
��
�
�
Figure 10. A prostate tumour case, configuration of the clinical plan. (a) 3D view of selected beams (b) Beam at gantry angle G = 0° (c) Beam at G = 180° (d) Beam at G = 90° (e) Beam at G = 270°
12
E Schreibmann et al: A geometrical-based beam orientation optimization algorithm for conformal external beam radiotherapy
Figure 11. A prostate tumour case, configuration of the optimised plan. (a) 3D view of selected beams (b) Beam at gantry angle G = 20° (c) Beam at G = 111° (d) Beam at G = 290° (e) Beam at G = 201°
13
E Schreibmann et al: A geometrical-based beam orientation optimization algorithm for conformal external beam radiotherapy
100
PTV Right Femur
Volume (%)
80
Rectum
60
Bladder
40
Left Femur 20
Body 0
0
50
100
150
200
Dose (cGy)
Figure 12. DVH analysis of the prostate case for the clinical plan (full curve) versus optimised plan (broken curve)
4. Conclusions An automatic method for searching for the optimum beam arrangements in radiotherapy treatment planning was presented. The method is based on optimising a cost function that combines the individual feasibility of each beam with a geometrical measure describing the beam separation. Individual beam feasibility, is determined by inspecting the volume intersection between beams and OARs. The second part of the objective function describes how well the beam intersection volume conforms to the PTV volume. By dividing the computation procedure in two steps, one pre-calculation step that computes each beam feasibility and one optimisation procedure that selects a suitable beams set, two aims are achieved. These are (a) the time needed to compute the optimised plan is reduced because it does not imply recalculation of beam – OARs intersection at each optimisation step and (b) the result for each beam GFF can be represented graphically to the user in a treatment plan module, thus obtaining a simple and efficient tool for inspecting the calculation results. This methods requires only a few seconds to find an optimal set of beam directions when starting from the pre-computed feasibility values. This time taken is much less than the time needed for a dose-based optimisation, which can take some minutes to hours. As regards the search engine used, the ASA method compared to the SGA was found to give better results for both the value of the final cost function and the computation time. The procedure can also be used also as a pre-processing step to find a good initial configuration for optimisation algorithms based on dose or DVH objectives.
Acknowledgements This research was supported through a European Community Marie-Curie Fellowship (HTMP-2000-00011)
References Baltas D, Kolotas C, Geramani K, Mould R.F., Ioannidis G, Kekchidi M and Zamboglou N 1998 A Conformal Index (COIN) to Evaluate Implant Quality and Dose Specification in Brachytherapy. Int. J. Rad. Oncol. Biol. Phys., 40, 515-524 Bortfeld T and Schlegel W 1993 Optimization of beam orientations in radiation therapy: some theoretical considerations Phys. Med. Biol. 38, 291–304
14
E Schreibmann et al: A geometrical-based beam orientation optimization algorithm for conformal external beam radiotherapy
Cho B J, Roa W H, Robinson D, and Murry B 1999 The development of target-eye-view maps for selection of coplanar or noncoplanar beams in conformal radiotherapy treatment planning Med. Phys. 26 2367–2372 Das S K and Marks L B 1997 Selection of coplanar or noncoplanar beams using threedimensional optimization based on maximum beam separation and minimized nontarget irradiation Int. J. Radiat. Oncol. Biol. Phys. 38 643–55 Goldberg D R 1989 Genetic Algorithms in Search, Optimization, and Machine Learning Addison-Wesley, Reading, MA. Gottschalk S, Lin M and Manocha S 1996 OBB-Tree: A Hierarchical Structure for Rapid Interference Detection, Proc. ACM Siggraph 1996, 171-180 Haas O C L, Burnham K J, and Mills J A 1998 Optimization of beam orientation in radiotherapy using planar geometry Phys. Med. Biol. 43 2179–93 Ingber L 1989 Very fast simulated re-annealing J. Math. Comput. Modeling 12, 967–73 Ingber L 1992 Genetic Algorithms and Very Fast Simulated Reannealing : A Comparison Mathl. Comput. Modelling. Vol 16 N0. 11 pp 87-100 McShan D L, Kessler M L, and Fraass B A 1995 Advanced interactive planning techniques for conformal therapy: high level beam descriptions and volumetric mapping techniques Int. J. Radiat. Oncol. Biol. Phys. 5 1061-72 Myrianthopoulos L C, Chen G T, Vijayakumar S, Halpern H J, Spelbring D R and Pelizzari C A 1992 Beam’s eye view volumetrics: an aid in rapid treatment plan development and evaluation Int. J. Radiat. Oncol. Biol. Phys. 2 367–75 Sailer S L Rosenmann J G, Symon J R, Cullip T J and Chaney E L 1994 The tetrad and hexad: maximum beam separation as a starting point for noncoplanar 3D treatment planning: prostate cancer as a test case Int. J. Radiat. Oncol. Biol. Phys. 30 439–46 Soderstrom S and Brahme S 1992 Selection of suitable beam orientations in radiation therapy using entropy and Fourier transform measures Phys. Med. Biol. 37 911–24 Wagner T H, Meeks S L, Bova F J, Friedman W A, Buatti J M and Bouchet L G 2001 Isotropic beam bouquets for shaped beam linear accelerator radiosurgery Phys. Med. Biol. 46 2571–25
15