A Graph-Based Approach to Disassembly Model for End-of-Life Product Recycling Hong C. Zhang and Tsai C. Kuo Department of Industrial Engineering Texas Tech University Lubbock, TX 79409-3061 Phone: (806)742-3543 Fax: (806)742-3411 Email:
[email protected]
Abstract Manufacturing industries are beginning to face one of the consequences resulting from the rapid development which has occurred during the last decade. The most evident effect is that landfill capacity is being used up. Therefore, a systematic approach to recycling is both urgent and imperative. It has been also recognized that appropriate disassembly of used products is necessary in order to make recycling economically and environmentally viable in the current state of the art reprocessing technology. This paper proposes a graph-based heuristic approach to the disassembly model. The model is embedded on a graph representation and object-oriented modeling, which is obtained by generating disassembly sequences. Information exchange within the disassembly model is done through three phases: (1) disassembly analysis, (2) database and data management, and (3) recycling cost minimization. With graph representation, the problem of identifying the optimal disassembly and recycling strategy is transformed into a graph search problem. By solving the graph search problem, one can determine the termination of disassembly, generate the disassembly sequence, calculate the disassembly cost, select recycling plans, monitor the material flow, and evaluate environmental compatibility of the product. In addition, this paper illustrates the prototype using personal computer disassembly as an example.
I. Introduction A growing concern for the environment, especially about the waste and landfill, has
0-7803-3642-9196 $4.00 01996 IEEE
247
motivated research into the design of more environmentally benign product. In Europe, 800,000 tons of old TV sets, computer equipment, radios, and measuring devices, and three million tons of automobile equipment are thrown into the national garbage center each year (Owen 1993). In the United States, the municipal solid waste (MSW) generated by households and industrial establishments is about 4 pounds per person each day (Gibbons 1992). Under pressure by European governments, global manufacturers are thinking about how to appropriately dispose of their womout products. Currently there is a trend towards increased product “take back” with special emphasis on disassembly and separation for product recycling and reuse. The life-cycle approach is a useful way to examine the environmental impact of a product; however, environmental impact is only one of many issues for recycling. Other issues include material substitution and selection, disassembly A more sequence, and recycling cost. comprehensive approach is needed to integrate environmental and traditional design concerns. Generally, it is not possible to recover 100% of all materials used in the end-of-life (EOL) products. Components can rarely be re-used directly; therefore, most products must be disassembled or dismantled to be separate materials in order to recycle them as secondary materials. This paper proposes a graph-based heuristic approach for a disassembly model. The model is embedded on a graph representation and object-oriented modeling, which is obtained by generating disassembly sequences. Information exchange within the disassembly model is done through three phases:
1996 IEEElCPMT Int’l Electronics ManufacturingTechnology Symposium
the mating conditions of all the faces of the subassembly. Each subassembly face which mates with a non-subassembly face restricts the degree of freedom in the direction of the outward normal to the face. Homem de Mello and Sanderson (1991) have developed a system which permits parts to have both planar and cylindrical faces. All of the disassembly motions must be straight-line translations or screw motions. Li et al. (1995) used a simulated annealing algorithm to find 2. Relative research Most products are not designed within life cycle economically optimal sequences that give the consideration today; therefore, the key is to design maximum return value and provide a suggestion future products which can be easily disassembled about where the disassembly operation should stop. and recycled (Mauro 1995). There has been A precedence relationship among the components significant research focused on design for recycling is analyzed; however, Li et al. did not consider the of automotive, electromechanical, electronic, and modularity among the components. Modularity is different component and/or consumer products. Alting (1993) addressed integrating recycling within a Life Cycle Design concept. subassembliesthat share a physical relationship and In disassembly and Alting indicated that a product must be produced, some similar function. distributed, used and disposedrecycled without recycling analysis, modularity design is focused on harm to the environment in any of these phases. the physical relationship and similar retirement All of these phases must be considered from the method (e.g., re-use, remanufacture, high grade perspective of the conceptual stage, where it is recycling, low grade recycling, chemical possible to accommodate the requirements of each decomposition recycling, incineration recycling, successive stage while changing the outcomes in a and disposal) (Simon 1991). Chen et al. (1994) cost-efficient manner. Amezquita et al. (1995) used Suh’s (1990) independent design axiom to developed the reusability metrics based on life derive the measurement of product modularity. cycle factors of engineering systems. A validation Ishii et al. (1995) proposed clumping by the strategy has been developed to determine the technology life cycle, which can aggregate the component’s material compatibility. In the correctness and validity of these metrics. clumping method, materials and fastening methods Disassembly sequence analysis: A possible should be compatible with existing reprocessing disassembly sequence is to remove one parts technologies. Gu and Yan (1995) used the liaison without interference from other parts. Arai and graph, decomposed the liaison graph into subIwata (1993) proposed an evaluation method for the groups, generated the disassembly sequence for ease of sssembly/disassembly based on the each sub-group, merged disassembly sequences for kinematic simulation system. In the kinematic sub-groups, and reversed it into assembly simulation system, the part is decided to be sequences. removed by comparing the evaluation standard values of candidate parts when several parts can be Product recycling cost: It is important to find the removed at the same time. By using the product economically optimal disassembly sequences that model of 3-D solid geometry, possible movements give the maximum return value and determine of each part in the product are calculated, and the whether the disassembly operation should stop. removal possibility from the product can be Usually, product recycling includes disassembly, searched. KO and Lee (1987) determined the material reprocessing, disposal cost, and salvage direction of disassembly by taking the direction of profit (Zhang and Kuo 1996). Disassembly cost is the normal to the largest mating face of each part in defined as the cost to separate the components of the subassembly. Khosla and Mattikali (1989) end-of-life (EOL) products to be recycled. Most improved the method of KO and Lee by considering components are joined together with methods that (1) disassembly analysis, (2) database and data management, and (3) recycling cost minimization. By solving the graph search problem, one can determine the termination of disassembly, generate the disassembly sequence, calculate the disassembly cost, select recycling plans, monitor the material flow, and evaluate environmental compatibility of the product.
248
1996 IEEEICPMT Int’l Electronics ManufacturingTechnology Symposium
prevent them from being separated (e.g., methods, (e.g., reuse, remanufacture, high/low ultrasonic, welding or adhesives and fasteners). grade recycling). Some materials cannot be The more components are disassembled, the higher recycled because of their physical properties. For the disassembly costs will be. Material recycling instance, the printed circuit board (PCB) is cost is defined as the total cost to reprocess the commonly used by FR-4 (FR = "fire resistant") material for reuse by different recycling methods. glass reinforced polyester resin with additives to As different recycling methods are used, the reduce flammability. The resin is thermoset PE different material reprocessing cost are calculated. with many additives. Therefore, PCB can not be Usually, the more components are disassembled, recycled because of its physical properties. the higher the material reprocessing cost will be. Disposal cost is defined as the cost of landfill Phase I11 - recycling cost minimization. The dispose of the components which can not be reused third step is to determine the disassembly strategy or reprocessed. Usually, the disposal cost is simply and recycling cost. When the product's structure the landfill fee. Salvage benefit is defined as the has been clarified, it will be found that not every value of components for resale in marketing. When disassembly operation is suitable. Some operations the components are recycled, they can be reuse:d in are not possible because there are no physical the production line as raw materials or parts.
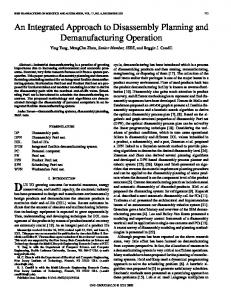
3. Disassembly Model The key to recycling EOL products depends on the planning of disassembly processes and recycling strategies. To build a theoretically sound disassembly model, three phases are involved: disassembly analysis, database and database management, and recycling cost minimization. Phase I - disassembly analysis. In this phase, product structure and disassembly sequence are analyzed. The structure of the product refers to the geometric components and assembly relationship among the components. During this phases, the disassembly strategies are evaluated and the disassembly sequences are determined. To obtain the disassembly sequence, the graph theory is used to split the products into several sub-assembly. Also, the disassembly precedence is used to obtain a disassembly tree. Most of the time, there exists many feasible disassembly sequences. Groups of these disassembly sequences are represented by a disassembly tree. Phase I1 - database and database management. After the product structure is analyzed, the material properties are investigated. There is a need for a material database containing information on the
component's physical properties (e.g., material characteristics, weight, volume, toxicity), recycling
249
Figure 1: A disassembly model relations between the components, while others cannot be carried out because the joints are fixed and no physical separation is possible (welding, soldering, etc.) In addition, disassembly is not the reverse of assembly, and many operations can be omitted if they are not profitable. Therefore, the recycling costs are studied in this step. The above phases are formulated as a disassembly model for EOL product recycling and is shows in figure 1.
3.1 Disassembly Analysis In order to generate the disassembly sequence, it is important to represent the geometric and nongeometric information about the assembly. A
1996 IEEVCPMT Int'l Electronics ManufacturingTechnology Symposium
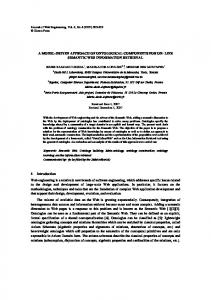
prerequisite to developing an appropriate model for Class Fastener { EQL product disassembly is the use of a product ID; ID; ID; Name; Name: Name; assembly model. Many product assembly models Material-Type; Number-of-Fastener; Disassembly-Method; Fastener-ID; Dlsassembly-Tool; Weight; reported in the literature has been developed based Recycling-Method; 1 Disassebly_Tlme; on the language of the graph (Gu 1995). In this 1 Recycling-Cost; Number-of-Child; study, the assembly relationships among Child-ID; components of a product are represented as a graph with the vertices representing components (fasteners are treated as components) and edges Figure 2: Data information in disassembly model representing assembly relationships. After Figure 3 shows a partially disassembled carefully studying various assembly models, a graph-based disassembly model for the purpose of personal computer (PC) and it's corresponding recycling was developed. Two distinct features of component-fastenergraph is shown in Figure 2. the model are: (1) fasteners are treated differently from components, (2) a product model is Power Supply Main Case \ , z represented using graphs and matrices, namely, Extension Card'., "!. t component-fastener graph and disassembly (3) groups of precedence matrices, and disassembly sequences are represented as a disassembly tree.
,
ComDonent-fastener a-aph. This graph represents the component-fastener relationships among the components. A component is a constituent part of a product, without which the product will not function properly. A fastener is used to attach one component to another for the purpose of assembly. Examples of fasteners include screws, rivets, inserts, etc. In a component-fastener relationship graph G, = (V, E ) the components are represented as the vertices V = {vi, v2,..., vn}, where n is the number of components. Their relationships are represented as the edges E = { e l , e2,..., em), where m is the number of edges. If two components Vi and vj (i f j ) are joined by fasteners, then (Vi,vj) E E; otherwise (vi, vj) @ E. The graph G, is an undirected graph. The vertices and edges in graph G, are modeled using object-oriented techniques. While the object vertex consists of component information including its name, weight, material type, etc., the object edge consists of fastener information including the number of fasteners, fastener type, etc., and the object fastener refers to the disassembly method between components. Figure 2 shows all the information contained in the vertex, edge and fastener.
250
Inaccessible Drive Ba!
Figure 3. A partially disassembled personal computer (PC). Modularity analysis. Modularity analysis is used to simplify the complexity of a product. All of the components which share the same characteristics are grouped into a sub-assembly. The analysis starts with searching for cut-vertices in the component-fastener graph. A cut-vertex is defined as a vertex whose removal disconnects the graph. If a cut-vertex is found, the graph is split into two or more sub-graphs. Each sub-graph represents a module. These modules are the child vertices of the parent vertex. The fasteners that must be removed in order to obtain a child vertex (a module) are embedded in the edge connecting the child vertex with its parent.
For each of these
modules, the same procedure is applied until no cut-vertices can be found. In figure 5, component 1 and component 2 are cut-vertices; therefore, the graph was split into 9 sub-graph. The corresponding modules are {V,}, { V,}, { V,, V,, V,, v617{v71y {v8),{v9)7{V1,,},{vll},{Vl21-
1996 IEEUCPMT Int'l Electronics ManufacturingTechnology Symposium
Table 1:Disassembly precedence matrices Figure 4:Component-fastener relationship graph for the assembly shown in Figure 1. Disassemblv Drecedence metrics. After the components are simplified by modularity analysis, the disassembly precedence metrics is analyzed. Precedence is defined between contacting parts; if the absence of a part gives more freedom of movement to another part, then the former has precedence over the latter. The precedence relation is local to the parts concerned, and signifies the partial order of disassembly (Yokota K, and Brough D. R., 1992). Disassembly precedence means a component cannot be disassembled before certain other components. Table 1 shows the disassembly precedence metrics of the 9 sub-graph in figure 5. For example, sub-graph { 3,4,5,6)can not be removed until sub-graph { 1) and -z direction) and { 11) (h, and +z direction) are removed.
(e,
n
Disassemblv tree generation. The final disassembly tree is constructed based on the disassembly modules and the disassembly precedence metrics of the EOL product. Referring to the disassembly precedence metrics shown in Figure 3, { 11 and { 2) are the cut-vertices which are considered to be disassembled lastly. Only sub-assembly { 11}, { 12), {7), (8), (9) and { 10) can be disassembled from the +z, and +y direction. Therefore, in the first step of disassembly, only { 1l ) , { 12), {7), { 8}, (93, and { 10) are disassembled. The other sub-graphs are merged together because after some components are disassembled, the cut-vertices will change. Perhaps new cut-vertices will be generated, or old cut-vertices will change to become non cut-vertices. Example is sub-graph {2},after (7) through { 10) are removed, ( 2 ) is no longer a cut-vertex. Figure 6, shows the first step of the disassembly tree. The process should be repeated to find the cut-vertex and evaluate all the disassembly precedence memcs until a complete disassembly tree is generated. Figure 7 shows the final disassembly tree. 3.2 Material database management In the activities of disassembling and recycling, material information related to EOL products is especially needed, including information on material properties (e.g ., material compatibility, and toxicity, substitution possibilities, environmental persistence, energy usage, material costs, and
recycling
costs
and procedures).
Although some material data and information exist, it is not easily accessible to the design and
Figure 5: Modularity analysis
251
1996 IEEVCPMT Int'l Electronics ManufacturingTechnology Symposium
manufacturing community. Manufacturers cannot directly control all materials used to manufacture products because many product and process materials are supplied by outside companies. This lack of knowledge about materials and their impacts is greatly detrimental to the incorporating environmental concerns into the design and manufacture of products. Hence, when a disassembly model is developed, the material information should be taken into consideration for design trade off and manufacturing alternatives.
the sum of the disassembly cost, material reprocessing cost, and disposal cost minus salvage profit. For each component, the disposal cost, the disassembly cost, and the recycling cost and salvage benefit are compared. Only one alternatives will be selected, which means only one method of retiring will be applied to the component: 1) the component will be disassembled, 2) the component will be disposed into landfill, or 3) the component will be recycled and sold in the market. The recycling cost is formulated as follows (figure 8):
( I
&
Level0
Figure 6: The first step of disassembly tree
Level1
E:,
Figure 7: The final disassembly tree
...
Level2
"f-,
Lcvclq-l
Lcvelq
,
Figure 8: recycling cost in the disassembly tree (cp
3.3 Recycling cost minimization
:disposal Cost in vertex I$:,),
)%,,
C C D jV4
:disassembly Cost in vertex
ccM)v4
:material Recycling Cost
( a qh
Termination of disassembly. The termination of disassembly is determined based on the issue of cost and profit. Three types of cost and one type of profit are addressed: (1) disassembly cost, (2) material reprocessing cost, (3) disposal cost, and (4) salvage profit. The total cost is calculated as
y:qjz
(aq),
CCS)"4 m q ) , ( C T R )"a
252
:salvage Benefit l$:q
Iz
:total Recycling Cost in vertex V o
1996 IEEEiCPMT Int'l Electronics Manufacturing Technology Symposium
vr:
: vertex of q level in the disassembly
'1)i
tree, where 0,= k,k, ...k , , in which i = I , 2, ..., U
Disassembly cost (C,)
= D,x y.+D2x
(cp)vpa,,,i
+...+D j x Xi
i: index of component i DSCi: disposal cost for component i Dj: weighted value of disposal cost where j = I , ...,n wit weight of component i Vi: volume of component i Xi:other physical property of component i
:In the disassembly tree,
'@,h
the disassembly cost is associated with each link. Disassembly cost is a function of labor cost and disassembly time. The disassembly cost is associated with each link, DCi, is calculated as: n
Salvage profit (C,)
i: index of link i and component i , C, : labor cost per hour, (C ) :the cost to disassemble the '?aqh
component i , Tk : time to remove the fastener k. k : 1...n, number of fasteners in link i Material recycling cost
(C,)
,
'm,h
: When the components are
recycled, they can be reused in the production line, as raw materials or parts. Salvage profit is one of the function of weight, volume, or another property, like capacity, etc.
(C& mq h
= P x w i + P , x v , + ...+e x y ,
i: index of component i SBi:salvage benefit for component i
: After the 'mqh
Pj: weighted value of recycled method, where j = l , ...,n Wiz weight of component i
components are disassembled, some components can be directly reused, while the others should be reprocessed (e.g., remanufacturing or highflow grade recycling) before they can be directly reused. As different recycling methods are used, the different material reprocessing costs are calculated.
Vi: volume of component i Yi:other physical property of component i Total recycling cost (CTR)i: Total recycling cost is calculated by summing the total disassembly cost, total material reprocessing cost, total disposal cost and total regainable benefit.
i: index of component i : recycling cost for component i (C,),, (0
Jt
Rj: decision variable, wherej = 1,...,n i: index of component i (CTR)i :Total recycling cost for each component i : Disassembly cost for component i
? I
C R i = 1,
Ri
E
[O,l]
i=l
Crue: reuse cost of component i Crem: remanufacturing cost of component i Chigh: high grade recycling cost of component i C low: low grade recycling cost of component i C,: other recycling cost of component i
Disposal cost (C,)
D ('
):'aq),
(C,),,
; Material recycling cost for ( O q JL
component i : Salvage benefit for component i (C,jYq (0sh
(C
: It is a function of either
'mqh
)
: Disposals cost for component i
vf%qJl
Xi:Decision variable, where i = 1,2,3
weight, volume, or other property, like toxicity, etc. 253
1996 IEEEKPMT Int'l Electronics ManufacturingTechnology Symposium
4. C ~ n ~ l u s ~and o nFuture Research Recycling is increasingly gaining attention world-wide. The importance of recycling is recognized by most industrially developed countries, with varying emphases on issues concerning legislation, standardization, basic research, and industrial implementation. Nonetheless, research on recycling is in its infancy. In this paper, research activities concerning the recycling of end-of-life products and the disassembly model were developed. Based on the developed technique, numerous EOL products can be recycled effectively. The model is currently focused on PC recycling; however, it has great potential to be developed for other products such as TVs, telephones, automobiles, etc. As preliminary research, this project is one of the pioneers for computer recycling. The research project will impact the current computer industry by means of raising environmental conscious in manufacturing.
eference 1. Alting, L., 1993, “Designing for a Lifetime,” Manufacturing Breakthrough, May/June, pp. 2.
3.
4.
5.
6. 7.
29-33. Amezquita, T., Hammond, R., Salazar, M., and Bras, B., 1995, “Characterizing the Remanufacturability of Engineering Systems,” Design Engineering Technical Conferences, 1 pp. 271-278. Arai E., and Iwata, K., 1993, “CAD System with Product AssemblyDisassembly Planning Function,” Robotics & Computer-Integrated Manufacturing, vol. 10, no. 1/2, pp. 41-48. Chen, W., Rosen, D., Allen, J. K., and Mistree, F., 1994, “Modularity and the Independence of Functional Requirements in Designing Complex Systems,” Concurrent Product Design, ASME, vol. 74, pp. 31-38. Gibbons, H. J,, 1992, Green Products by Design - Choice for a Cleaner Environment, Congress of the United States Office of Technology Assessment. Gu, P., and Yan, X., 1996, “CAD-Directed Automatic Assembly Sequence Planning,” Int. J . PROD. RES., vol. 33, no. 11, pp. 3069-3100. Homem de Mello, L. S., and Sanderson, A. C., 1991, “A Correct and Complete Algorithm for
the Generation of Mechanical Assembly Sequences,” IEEE Trans. Robot. & Automate. vol. 7 , no. 2, pp. 228-240. 8. Hong C. Zhang, and T. C. Kuo, 1996, “Disassembly Model for Recycling - Personal Computer,” Technical Papers of the North American Manufacturing Research Institution of SME, pp. 139-144. 9. Ishii K., and Lee, B. H., and Eubanks, C. F., 1995, Design for Product Retirement and Modularity Based on Technology Life-Cycle, Manufacturing Science and Engineering, ASME, MED-Vol. 2-2/MH-V01. 3-2, pp. 921933. 10. Khosla, P. K., and Mattikali, R., 1989, Determining the Assembly Sequence from a 3-D mold, Journal of Mechanical Working Technology, vol. 20, pp. 153-162. 11. Khosla, P., and Mattikali, R., “Determining the Assembly Sequence from a 3D model,“ J . Mech. Working Tech., vol. 20, no. 9, pp. 153-162, 12. KO,H., and Lee, K., 1987, “Automatic assembly procedure generation from mating conditions,” Computer Aided Design, vol. 19, no. 1, pp. 310. 13. Li, W., Zhang, H.-P7 Wang, B., and Awoniyi, S. A., 1995, “Design for Disassembly Analysis for Environmentally Conscious Design and Manufacturing”, Manufacturing Science and Engineering, ASME, pp. 969-976. 14. Mauro, G., 1995, Computer Recycling in Layman’s Terms, Texas General Land Office, Mar. 15. Owen, J. V., 1993, “Environmentally Conscious Manufacturing,” Manufacturing Engineering, Oct., pp. 44-55. 16. Porter, M. E,, and Linde, C., “Green and Competitive Ending the Stalemate,” Harvard Business Review, September-October,pp. 120134. 17. Rummler, T., “Requirements for Used Cars Recycling in the Federal Republic of Germany,” Ingenious del’ Automobile, vol. 678, 1993, pp. 44-46. 18. Suh, N. P., 1990, Principles of Design, Oxford University Press.
254
1996 IEEEKPMT Int’l Electronics Manufacturing Technology Symposium