A Multiple Regression Model Approach to Contrast the Performance of 2-Hydroxy-4-Methylthio Butanoic Acid and DL-Methionine Supplementation Tested in Broiler Experiments and Reported in the Literature M. Va´zquez-An˜o´n,†1 D. Kratzer,* R. Gonza´lez-Esquerra,† I. G. Yi,† and C. D. Knight† *E-SCI, Olivet, MI 49076; and †Novus International Inc. St. Louis, MO 63141 ABSTRACT The purpose of this paper was to compile all available literature comparing the relative performance of 2-hydroxy-4-methylthio butanoic acid (HMTBA) with DL-methionine (DLM) in broiler chickens and using multiple regression techniques, to estimate the predicted dose responses and relative performance of the 2 Met compounds for gain and feed conversion (FC). A database was developed that contained all available broiler studies in which HMTBA and DLM were both present in the same study; weight gain was recorded; Met addition, age of birds, and duration of study were defined; and an unsupplemented control treatment was present. Sixty-two references complied with these criteria and included 100 experiments with 427 observations for HMTBA and 411 for DLM. Multiple regression analysis of the database was used to identify the experimental and dietary conditions that contributed to the gain and FC responses of each source of Met activity. All identified variables contributed similarly to each Met source predicKey words: Alimet,
DL-methionine,
tion model and both gain and FC models described a quadratic dose response. Under the average conditions of the database, the predicted responses for gain and FC models did not significantly differ between HMTBA and DLM. However, a trend was observed (P ≤ 0.1) for the peak gain response for HMTBA to be numerically greater than DLM, suggesting benefits of HMTBA over DLM in the region of supplementation that is commercially relevant. The experimental and nutritional conditions that contribute to the response to HTMBA and DLM were identified and are discussed in the paper. This statistical approach provided a means to summarize the results obtained from a multitude of studies conducted over the last 5 decades and has provided a meaningful estimate of the relative performance of the 2 sources of Met activity. The lack of differences between the 2 predicted models under experimental and commercial conditions supports an overall conclusion of equal performance of DLM and HTMBA when compared on an equal molar basis. bioefficacy, multiple regression analysis 2006 Poultry Science 85:693–705
sors to the animal, there are substantial differences between them with respect to chemistry, absorption (Knight and Dibner, 1984), transport in the body (Lobley et al., 2001), and metabolism by the tissues (Dibner, 2003). Extensive research evaluating the relative efficiency of HMTBA and DLM as sources of Met activity in broilers has generated a large number of studies over the last 5 decades; however, no efforts have been made to provide a comprehensive summary of all existing literature in which the environmental and nutritional factors that determine the response to HMTBA and DLM could be evaluated. Because HMTBA and DLM both provide Met activity, it has been assumed that they both demonstrate the same performance dose response. This assumption is evident in several studies that have compared the relative performance of the 2 Met source using slope ratio analysis in which an asymptotic exponential curve with common intercept and plateau was fitted over the mean response to greater levels of the 2 Met sources (Jansman et al.,
INTRODUCTION In poultry diets, Met is considered to be the first limiting amino acid, and synthetic Met activity is typically added either as DL-methionine (DLM) or as 2-hydroxy4-methylthio butanoic acid (HMTBA). Both products are available in liquid [Alimet feed supplement (Novus International, Inc., St. Louis, MO) contains 88% HMTBA; AT88 (Adisseo, Antony Cedex, France) contains 88% HMTBA; Liquidmeth (Degussa Hulls, Dusseldorf, Germany) contains 40% DLM] and dry forms [MHA feed supplement (Novus International, Inc.) contains 84% HMTBA; DLM powder contains 99% DLM, various suppliers]. Although both compounds provide Met precur-
2006 Poultry Science Association, Inc. Received May 13, 2005. Accepted December 6, 2005. 1 Corresponding author:
[email protected]
693
´ N ET AL. ´ ZQUEZ-AN ˜O VA
694
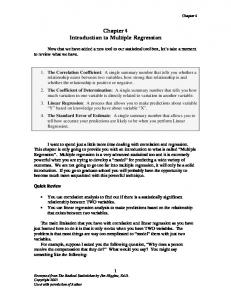
Figure 1. Distribution of the gain response to 2-hydroxy-4-methylthio butanoic acid (HMTBA) and DL-methionine (DLM) across levels of supplementation. Gain response to HMTBA and DLM supplementation followed a quadratic response. Fifty percent of the observations fell in the deficient region of the response curve, between 0.02 and 0.10%, and 98% of the observations fell in the levels of supplementation of 0.4% or lower, resulting in a nonsymmetric distribution of levels of supplementation with high frequency at the low levels of supplementation.
2003). This bioassay technique assumes that HMTBA is a dilution of DLM and, therefore, both sources follow similar asymptotic exponential response curves that reach the same plateau response. There are several studies in the literature that either demonstrate different dose response characteristics or that assumed a common dose response but the published mean responses do not support the assumption (Thomas et al., 1984; Schutte and de Jong, 1996; Lemme et al., 2002; Gonza´lez-Esquerra et al., 2004; Va´zquez-An˜o´n et al., 2003a,b,c). Given the evidence for a different dose response, it is critical that a statistically valid approach to compare the 2 Met sources is used, such as one that allows the data from
each source to define its own response curve model and determine relative performance of HMTBA and DLM by comparing the predictions of each model. Multiple regression analysis as described by Neter et al. (1985) is a statistical approach used in a variety of animal nutrition fields (Thompson et al., 1993, Rosen, 1995; Doepel et al., 2004; Hristov et al., 2004) to identify and quantify factors that contribute to the prediction of a response using previously published information. All available test data can be integrated into a nutritional model, in which the experimental and nutritional conditions of each study are taken into account in the analysis (Rosen, 1995). It also allows for comparison of results obtained over a long period of time in a single comprehensive analysis. Incorporation of all available literature in such a way allows for a broader inference space than that obtained from a single study. Neither are there any a priori assumptions regarding the relative dose response of either source of Met activity, allowing the data for each to dictate the best model that will predict the response. It also identifies and quantifies the contribution of the different nutritional and experimental conditions to the Met response. The analysis goes beyond providing a single efficacy value for HMTBA and DLM, which in the case of different dose responses leads to invalid conclusions. Rather, by providing predictions for the selected use conditions with associated standard errors, contrasts of the predicted performance from HMTBA and DLM supplementation can be tested to determine probabilities for differences to occur between the 2 Met sources.
Table 1. Quantitative nutritional, experimental, and performance variables extracted from the literature from the 2-hydroxy-4-methylthio butanoic acid (HMTBA) and DL-methionine (DLM) databases Variable Year of publication Number of experiments per study Age of bird at start of study, d Age of bird at end of study, d Duration of study, d Bird number per pen Number of replicates per treatment Dietary CP, % Dietary Cys, % Dietary energy, Mcal/kg Dietary Lys, % Dietary Arg, % Dietary calcium, % Dietary available P, % Met in the control diet, % Level of supplementation, % Gain of control, g Gain response to HMTBA, g Gain response to DLM, g FI of control,2 g FI response to HMTBA, g FI response to DLM, g FC of control3 FC response to HMTBA FC response to DLM Mortality, % 1
N = number of observations. FI = feed intake. 3 FC = feed conversion. 2
n1
Mean
SD
Minimum
Maximum
427 427 427 427 427 400 383 318 371 301 314 170 177 126 375 427 427 427 411 424 424 408 424 424 408 30
1,989 1.69 6.61 31.17 24.56 19.19 5.53 19.90 0.30 3,132 1.16 1.35 0.91 0.45 0.28 0.15 799.86 144.57 159.75 1,676 119.76 134.49 2.16 −0.39 −0.37 1.81
11.97 1.06 7.53 11.17 11.91 30.02 2.87 2.65 0.10 168.42 0.15 0.21 0.09 0.05 0.05 0.19 710.36 129.88 148.23 1,532 155.88 194.22 0.87 0.73 0.56 2.24
1,952 1 0 14 6 1 2.00 10 0.08 2,457 0.618 0.73 0.66 0.29 0.1 0.02 6.4 −225.68 −724.51 53.31 −352.56 −1,001 1.25 −6.33 −6.64 0
2,005 7 42 58 49 250 24.00 26.48 1.12 3,489 1.53 1.94 1.20 0.53 0.41 2.00 3,258 953.1 941.60 5,973 1,173 1,632 8.33 0.38 0.71 8.57
695
LITERATURE COMPILATION OF METHIONINE SOURCES Table 2. Quantitative nutritional and experimental variables extracted from the literature from the 2-hydroxy4-methylthio butanoic acid (HMTBA) and DL-methionine (DLM) databases Variable Type of cage Battery (0), pen (1) Type of facility Research (1), commercial (0) Type of house Open (0), controlled environment (1) Type of water system Nipple system (1), others (0) Antibiotic treatment Absence (0), presence (1) Coccidiostat treatment Absence (0), presence (1) Reported sick birds Absence (0), presence (1) Ambient temperature Thermoneutral (1), heat stress (0) Mixed sex Mix or straight run (1), rest (0) Female Females (1), rest (0) Male Males (1), rest (0) Form of HMTBA Dry (1), liquid (0) Form of DLM Dry (1), liquid (0) Process feed Pellet (1), mash + unreported (0) Mash feed Mash (0), pellet (1)
Observations, n
Frequency of variable 0, %
Frequency of variable 1, %
327
75.23
24.77
417
0
100
277
15.52
84.48
74
71.62
28.38
366
70.49
29.51
366
73.22
26.78
417
98.80
1.20
417
16.31
83.69
345
81.74
18.26
345
94.49
5.51
345
81.74
18.26
427
71.43
28.57
411
6.08
93.92
427
81.97
18.03
178
56.74
43.26
Despite years of study, there remains today some controversy regarding the relative bioefficacy of these 2 sources of methionine activity. Given the disparity in the estimates of bioefficacy of these 2 products, it appears that the nutritional and experimental conditions employed may play a role in the range of reported conclusions. The purpose of this paper was to compile all available literature comparing the relative performance of HMTBA and DLM in broiler chickens and using multiple regression techniques, quantify the contribution of nutritional and experimental conditions to the response to Met, and estimate the predicted dose response and relative efficacy of the 2 Met sources for gain and feed conversion (FC).
MATERIALS AND METHODS Compilation of the Available Literature into a Database Extensive research has been done since the 1950s in which the performance response to HMTBA and DLM supplementation has been evaluated and compared in growing broilers. A survey of the available scientific publications (full papers and abstracts) was done by accessing the NERAC database from 1950 to 2004. Certain unpublished reports available to the authors were also included in the database and are provided in the appendix section with the list of references.
The criteria for inclusion of the studies in the database were purposely kept broad to incorporate the greatest representation of the available information. The criteria included: (1) that both HMTBA and DLM were present in the study. This guaranteed that the prediction equations for the 2 sources were derived from the same extensive sample of genetic, nutritional, and experimental circumstances, (2) BW or gain was the primary measure required to evaluate performance, (3) the level of supplementation of both sources was defined, (4) there was some indication of the duration of the study and age of the birds, and (5) an unsupplemented control or basal treatment was present in the study. A total of 62 references that provided 100 different experiments complied with the selection criteria just described and were used to build the database. A list of variables was identified and extracted from each of the 100 experiments as described in Tables 1 and 2. Descriptive variables such as bird gender (sex), physical form of Met source, sick birds, and type of facilities were converted into indicator variables, 0 or 1, for use in the regression analyses. An indicator variable estimated the average effect of the classification it represented on the performance variable when simultaneously taking into account the other independent variables in the model. In the case of bird gender, the majority of the studies were run with males, followed by mixed sex, and a very small proportion of studies with females only. A male indicator variable was defined such that a value of 1
´ N ET AL. ´ ZQUEZ-AN ˜O VA
696
Table 3. Description of the parameter estimates, SE, and probabilities associated with the independent variables of the DLM (DL-methionine) gain response prediction model that were identified as significant using the multiple regression analysis of the available DLM database Variable
Parameter estimate
SE
P-value
Partial R2
Intercept Gain of control, g Met of basal diet, % Age of bird at start, d Age of bird at end, d Level supplemented, % Level supplemented,2 % Year of publication Dietary lysine, % Dietary CP, % Dietary energy, Mcal/kg Process feed Antibiotic
−19,094 −0.25 −1,083.29 −12.01 18.86 1,181.62 −2,280.43 9.09 319.35 12.43 0.12 70.14 66.93
1,533.35 0.022 191.34 0.87 1.29 241.63 722.07 0.74 64.45 3.68 0.044 16.15 12.20