A Hierarchical Distributed Fog Computing Architecture for Big Data Analysis in Smart Cities Bo Tang
Zhen Chen
Gerald Hefferman
Department of Electrical, Computer, and Biomedical Engineering University of Rhode Island
Department of Electrical, Computer, and Biomedical Engineering University of Rhode Island
[email protected]
[email protected]
Warren Alpert Medical School Brown University Department of Electrical, Computer, and Biomedical Engineering University of Rhode Island
[email protected] Qing Yang
Tao Wei
Haibo He
Department of Electrical, Computer, and Biomedical Engineering University of Rhode Island
Department of Electrical, Computer, and Biomedical Engineering University of Rhode Island
Department of Electrical, Computer, and Biomedical Engineering University of Rhode Island
[email protected]
[email protected]
[email protected]
ABSTRACT
Keywords
The ubiquitous deployment of various kinds of sensors in smart cities requires a new computing paradigm to support Internet of Things (IoT) services and applications, and big data analysis. Fog Computing, which extends Cloud Computing to the edge of network, fits this need. In this paper, we present a hierarchical distributed Fog Computing architecture to support the integration of massive number of infrastructure components and services in future smart cities. To secure future communities, it is necessary to build large-scale, geospatial sensing networks, perform big data analysis, identify anomalous and hazardous events, and offer optimal responses in real-time. We analyze case studies using a smart pipeline monitoring system based on fiber optic sensors and sequential learning algorithms to detect events threatening pipeline safety. A working prototype was constructed to experimentally evaluate event detection performance of the recognition of 12 distinct events. These experimental results demonstrate the feasibility of the system’s city-wide implementation in the future.
Fog computing; smart city; big data analysis; distributed computing architecture; pipeline safety monitoring
CCS Concepts •Computer systems organization → Distributed architectures; •Computing methodologies → Parallel computing methodologies; Machine learning; •Security and privacy → Network security;
Permission to make digital or hard copies of all or part of this work for personal or classroom use is granted without fee provided that copies are not made or distributed for profit or commercial advantage and that copies bear this notice and the full citation on the first page. Copyrights for components of this work owned by others than ACM must be honored. Abstracting with credit is permitted. To copy otherwise, or republish, to post on servers or to redistribute to lists, requires prior specific permission and/or a fee. Request permissions from
[email protected].
ASE BD&SI 2015, October 07-09, 2015, Kaohsiung, Taiwan c 2015 ACM. ISBN 978-1-4503-3735-9/15/10. . . $15.00
DOI: 10.1145/2818869.2818898
1.
INTRODUCTION
In the past decade, the concept of Smart City has drawn great interest in both the science and engineering fields as a means to overcome the challenges associated with rapidly growing urbanization. A smart city is an urbanized area where multiple sectors cooperate to achieve sustainable outcomes through the analysis of contextual, real-time information. Smart cities reduce traffic congestion and energy waste, while allocating stressed resources more efficiently and improving quality of life. Smart city technologies are projected to become massive economic engines in the coming decades, and are expected to be worth a cumulative 1.565 trillion dollars by 2020, and 3.3 trillion dollars by 2025. Today, companies are actively vying for a central role in the smart city ecosystem, creating an expanding number of technologies and employment opportunities. Already, IBM, Intel, GE, and many other companies have initiated projects to integrate their products and services into a smart city framework [1]. Hundreds of millions of jobs will be created to facilitate this smart city conversion; in June 2014, Intel and the city of San Jose, CA began collaborating on a project implementing Intel’s Smart City Demonstration Platform, installing a network of air quality and climate sensors which alone fostered 25,000 new high tech jobs in San Jose [2]. While rapid urbanization provides numerous opportunities, building smart cities presents many challenges, such as large-scale geospatially distributed sensing networks, big data analysis, machine-to-machine communication, etc. Currently, the “pay-as-you-go” Cloud Computing paradigm is widely used in enterprises to address the emerging challenges of big data analysis because of its scalable and distributed data management scheme. However, data centers in the Cloud faces great challenges on the burden of exploding amount of big data and the additional requirements
of location awareness and low latency at the edge of network necessary for smart cites. Fog Computing recently, proposed by Cisco, extends the Cloud Computing paradigm to run geo-distributed applications throughout the network [6]. In contrast to the Cloud, the Fog not only performs latency-sensitive applications at the edge of network, but also performs latency-tolerant tasks efficiently at powerful computing nodes at the intermediate of network. At the top of the Fog, Cloud Computing with data centers can be still used for deep analytics. In this paper, we introduce a hierarchical distributed Fog Computing architecture for big data analysis in smart cities. Due to the natural characteristic of geo-distribution in big data generated by massive sensors, we distribute intelligence at the edge of a layered Fog computing network. The computing nodes at each layer perform latency-sensitive applications and provide quick control loop to ensure the safety of critical infrastructure components. Using smart pipeline monitoring as a use case, we implemented a prototypical 4-layer Fog-based computing paradigm to demonstrate the effectiveness and the feasibility of the system’s city-wide implementation in the future.
2. 2.1
RELATED WORK Computing and Communication Architecture for Smart Cities
The new challenges of big data analysis posed by smart cities demand that researchers investigate and develop novel and high-performance computing architectures. The rising of Cloud Computing and Cloud Storage in industry provides a solution to support dynamic scalability in many smart city applications, such as large scale data management for smart house [16], smart lighting [7] and video surveillance [10], and intensive business and academic computing tasks in education institutions [20]. However, the deployment of massive numbers of sensors in future smart cities requires location awareness and low latency, which are lacking in current commercial Cloud Computing models. In [6], a Fog Computing platform is developed to extend the Cloud Computing paradigm to the edge of the machine-to-machine network to support the Internet of Things. The work described in this paper develops this Fog Computing concept further, and the new paradigm will be described in detail in the following section.
2.2
Smart Computing Technologies in Smart Cities
In addition to the large-scale data storage, the “smartness” of infrastructure in future smart cities requires intelligent data analysis for smart monitoring and actuation to achieve automated decision making, thereby ensuring the reliability of infrastructure components and the safety of public health. Such “smartness” in smart cities derives from the employment of many advanced artificial intelligence algorithms or the combination of several of them, including density distribution modeling [18], supervised and non-supervised machine learning algorithms [11] [17], and sequential data learning [19], to name a few. The wide use of heterogeneous senors leads to another challenge to extract useful information from a complex sensing environment at different spatial and temporal resolutions [13]. Current state-ofthe-art methods usually shallow this problem: they firstly
apply supervised learning algorithms to identify pre-defined patterns and use unsupervised learning algorithms to detect data anomalies. Then, sequential learning methods with spatial-temporal association are employed to infer local activities or predefined events. Complex city-wide spatial and longer temporal activities or behaviors could be further detected at a higher layer [13]. It is worth noting that the proposed hierarchical architecture in this paper is suitable for such distributed employment of artificial intelligence algorithms across multiple layers.
3.
HIERARCHIC DISTRIBUTED FOG COMPUTING PLATFORM FOR SMART CITIES
The big data in smart cities exhibits a new characteristic: geo-distribution [5]. This new dimension of big data requires that the data needs to be processed near the sensors at the edge, instead of the data centers in traditional Cloud computing paradigm. It is necessary to offer low latency responses to protect the safety of critical infrastructure components. Fog Computing is a suitable paradigm by extending the Cloud Computing to the edge of network. Because the data is processed at the edge, quick control loops are feasible using the Fog Computing model. The proposed 4-layer Fog computing architecture is shown in Fig. 1. At the edge of network, layer 4, is the sensing network which contains numerous sensory nodes. Those sensors are non-invasive, highly reliable, and low cost; thus, they can be widely distributed at various public infrastructures to monitor their condition changes over time. Note that massive sensing data streams are generated from these sensors that are geospatially distributed, which have to be processed as a coherent whole. The nodes at the edge forward the raw data into the next layer, layer 3, which is comprised of many low-power and high-performance computing nodes or edge devices. Each edge device is connected to and responsible for a local group of sensors that usually cover a neighborhood or a small community, performing data analysis in a timely manner. The output of the edge device has two parts: the first are reports of the results of data processing to an intermediate computing node at its next upper layer, while the second is simple and quick feedback control to a local infrastructure to respond to isolated and small threats to the monitored infrastructure components. Layer 2 consists of a number of intermediate computing nodes, each of which is connected to a group of edge devices at layer 3 and associates spatial and temporal data to identify potential hazardous events. Meanwhile, it makes quick response to control the infrastructure when hazardous events are detected. The quick feedback control provided at layers 2 and 3 acts as localized “reflex” decisions to avoid potential damage [15]. For example, if one segment of gas pipeline is experiencing a leakage or a fire, these computing nodes will detect the threat and shutdown the gas supply to this area. Meanwhile, the data analysis results at these two layers are reported to the top layer, for large-scaled and long-term behavior analysis and condition monitoring. The top layer is a Cloud Computing data center, providing city-wide monitoring and centralized controlling. Complex, long-term, and city-wide behavior analyses can be also performed at this layer, such as large-scale event detection, long-term pattern recognition, and relationship modeling, to
Figure 1: The 4-layer Fog computing architecture in smart cities, in which scale and latency sensitive applications run near the edge. support dynamic decision making. This allows municipalities to perform city-wide response and resource management in the case of a natural disaster or a large-scale service interruption. In summary, the 4-layer Fog Computing architecture supports the quick response at neighborhood-wide, communitywide, and city-wide levels, providing high computing performance and intelligence in future smart cities.
4.
A PROTOTYPE OF SMART PIPELINE MONITORING
In this section, we present the implementation of 4-layer Fog Computing architecture for smart pipeline monitoring. Pipelines play important role in resource and energy supplying and are essential infrastructure components in cities. However, several threats endanger the integrity of pipeline, such as aging and sudden environmental changes. Those threats lead to corrosion, leakage, and failure of pipelines, with serious economic and ecologic consequences [3][4]. We show that the hierarchical Fog Computing architecture is suitable for accurate and real-time monitoring of city-wide pipelines and provides quick responses when predefined threats and hazardous events are detected.
4.1
Layer 4: Fiber Optic Sensing Networks
At layer 4, optical fibers are used as sensors to measure the temperature along the pipeline. Optical frequency domain reflectometry (OFDR) system is applied to measure the discontinuity of the regular optical fibers [12]. With the continuous sweep method, the Rayleigh scatter (about -80dB) as a function of length along the fiber under test can be obtained via the Fourier transform. With the time-domain filter and cross-correlation method, the extracted frequency patterns
at certain locations can be used to detect the ambient physical change, such as strain, stress and temperature [8]. For the detailed description of OFDR interrogation system, we refer interested readers to our previous work [9] [14].
4.2
Layer 3: Edge Device for Feature Extraction
Layer 3 is composed of parallelized small computing nodes, or edge devices. Each edge device usually performs two computing tasks. The first task is to identify potential threat patterns on the incoming data streams from sensors using machine learning algorithms, and the second one is to perform feature extraction for the computing at the upper layer for further analysis. Considering a region governed by one edge device with a total length of hundreds of meters, millions of temperature sensors in our high resolution sensing network produce massive data streams and lead to a high data rate. Instead of transmitting the raw sensor data to layer 2, it is necessary to reduce the communication load between the edge devices and the intermediate computing nodes. Thereafter, raw sensor data is discarded.
4.3
Layer 2: Intermediate Computing Node for Event Recognition
The intermediate computing nodes at layer 2 are connected to tens and hundreds of edge devices, governing the community-level sensors. The data streams from these edge devices represent measurements at various locations. The key is to associate the spatial and temporal data and to identify potential hazardous events. Assume an intermediate computing node connects n edge devices, and denote a m × 1 vector si (t) by the features outputted from the i-th edge device at time t. Since the sensors are static, the features output from each edge de-
4.4
Layer 1: Cloud for Data Management
The top layer is at data centers of the Cloud, which collects data and information from each intermediate computing node on layer 2. We build the Cloud using the open source Hadoop, taking advantage of the power of clusters and high performance computing and storage. At this layer, very large-scale (city-wide) and very high-latency (years) computing tasks will be performed, such as long-term natural disaster detection and prediction.
5. 5.1
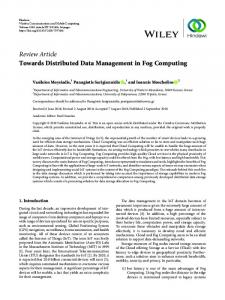
is modeled by a Gaussian mixture model (GMM) with K Gaussian components. We performed 10-fold cross validation to evaluate the recognition performance. All the following reported results were averaged over 10 runs. For each sequential test data, we run online prediction, i.e., at time frame t, a decision was made based on its currently and previously observed sequence x0:t . The online recognition performance with different number of hidden states is shown in Fig. 3, when K = 2 Gaussian components are used in GMM, and the performance with different number of components in GMM is given in Fig. 4, when Q = 2 hidden states are used. The results in Fig. 3 and Fig. 4 illustrate that more hidden states and Gaussian components used in HMM would increase the inference performance due to the growing capacity of HMMs. However, the complex HMM models need more training data for model parameters estimation and the computational complexity would increase. The results also show that we are able to obtain more than 90% accuracy to classify 12 events at the end of the heating process (at the 40-th frame). 1 0.9 Averaged Classification Accurancy
vice contains the geospatial information. After receiving all the features from n edge devices, we combine these n groups of feature vectors into a mn × 1 feature vector x(t). Hence, from time 1 to time t, this intermediate computing node receives the data sequences X = {x(1), · · · , x(t)}, and the task of event recognition at this layer is to recognize the event pattern given its previous data sequences. After that, we apply hidden Markov model (HMM) for modeling the spatial-temporal pattern of each event in a probabilistic manner. Specifically, at the learning state, we apply the Baum Welch learning algorithm to estimate model parameters, and at the evaluation stage, we use maximum a posteriori (MAP) rule for making classifications.
EXPERIMENTAL RESULTS AND ANALYSIS Sensor Data Collection
In our experiments, we built a prototype of pipeline monitoring system. The layout of pipeline structure is shown in Fig. 2. The optical fiber sensors were distributed along this the pipeline such that the temperature of pipeline is measured. The real-time data was collected from the fiber sensor network along the prototypical pipeline system with a temporal resolution of 1 second and a spatial resolution of 0.01 meters.
0.8 0.7 0.6 0.5 0.4 0.3 Q=2 Q=3 Q=4
0.2 0.1 0
10
20
30
40 50 60 Time Frame
70
80
90
100
Figure 3: The online inference performance with different number of hidden states in each HMM: Q = 2, Q = 3, and Q = 4, when two components GMMs are used (K = 2).
1 Averaged Classification Accurancy
0.9
Figure 2: The layout of prototype pipeline system.
0.8 0.7 0.6 0.5 0.4 0.3
0.1 0
We simulated 12 events around the pipeline and collected the sensor data of pipeline temperature. Each event includes a heating and a cooling process. A heat source was placed nearby, blowing the hot air towards the pipeline system. In each experiment, 100 frames of sensing data were gathered, where in the first 10 frames the system remained stable, from 11 to 40 frames the heat source was on, and from 41 to 100 the heat source was off.
5.2
Spatial-Temporal Event Recognition
We trained a HMM for each event. Each HMM has Q hidden states, and the observation probability distribution
K=1 K=2 K=3
0.2
10
20
30
40 50 60 Time Frame
70
80
90
100
Figure 4: The online inference performance with different number of Gaussian components in the observation distribution of each HMM: K = 1, K = 2, and K = 3, when two hidden states are used (Q = 2).
5.3
Discussion
The Fog Computing architecture has significant advantages over the Cloud Computing architecture for smart city monitoring. First, the distributed computing and storage
Figure 5: The comparisons of the amount of data transmitted to the Cloud and the response time for hazardous events within three different architectures: (a). The amount of data that are sent to the Cloud per second; (b). The response time for hazardous events, when the Internet bandwidth is 1M b/s; (c). The response time for hazardous events with different Internet bandwidths. The log values in the y-axis are used to clearly illustrate the comparisons. nodes of Fog Computing ideally suited to support the massive numbers of sensors distributed throughout a city to monitor infrastructure and environmental parameters. If Cloud Computing alone is used for this task, huge amounts of data will need to be transmitted to data centers, necessitating massive communication bandwidth and power consumption. Specifically, suppose that we use current sensing setup with 1cm spatial-resolution and 0.5s time-resolution, and that each edge device covers 10 meters pipeline and each computing node connects 5 edge devices. Considering the total pipeline length L ranging from 10km to 50km, we compare the size of data that needs to be sent to the Cloud per second in Fig. 5(a) for the following three cases: our current Fog Computing architecture with layers 2 and 3, the Fog Computing architecture with only layer 3 by removing the computing tasks at layer 2 to the Cloud, and the traditional Cloud Computing architecture in which both computing tasks at layers 2 and 3 are executed at Cloud. To clearly illustrate the difference among these three architectures, we plot log values of data size. The results in Fig. 5(a) show that using Fog Computing, the data transmitted is about 0.02% of the total size, significantly reducing transmission bandwidth and power consumption. Second, Fog Computing supports real-time interactions. Because of high burdens on data transmission, Cloud Computing fails to provide real-time control. To quantify the response time for hazardous events under the above three computing architectures, we assume that the execution speed in computing node is 1GIPS, and we omit the memory access time for simplifying our analysis. The comparison of response time for these three architectures is shown in Fig. 5(b), when the Internet bandwidth connecting to the Cloud is 1M b/s. It is seen that the response time is dominated by the data transmission in Cloud Computing. Fig. 5(c) also shows the response time when different Internet bandwidths are considered. As shown in Fig. 1, different levels of latency of response can be provided in the Fog computing, which is distinct from the batch processing of Cloud Computing. These results illustrate that Fog Computing addresses the big data analysis challenge by distributing computing tasks to the edge devices and computing nodes at the edge of network, thus offering optimal responses to changes in city environment.
6.
CONCLUSIONS
In this paper, we introduce a hierarchical Fog Computing architecture for big data analysis in smart cities. In contrast to the Cloud, the Fog Computing parallelizes data processing at the edge of network, which satisfies the requirements of location awareness and low latency. The multi-layer Fog computing architecture is able to support quick response at neighborhood-wide, community-wide and city-wide levels, providing high computing performance and intelligence in future smart cities. We further enhance the “smartness” of city infrastructure by employing advanced machine learning algorithms across all system layers. To verify the effectiveness of this architecture, we have implemented a prototypical system for smart pipeline monitoring. A sequential learning method, hidden Markov model, was successfully used for hazardous event detection to monitor pipeline safety. These observed performance of the hierarchical Fog Computing architecture indicates its substantial potential as a method of future smart city monitoring and control.
7.
ACKNOWLEDGEMENT
The authors are grateful to the anonymous reviewers for providing comments and suggestions that improved the quality of the paper. This research is supported in part by NSF grants CCF-1439011 and CCF-1421823. Any opinions, findings, and conclusions or recommendations expressed in this material are those of the author(s) and do not necessarily reflect the views of the National Science Foundation.
8.
REFERENCES
[1] Smart Cities. http://www.ibm.com/smarterplanet/us/ en/smarter cities/overview/. Accessed: 2015-07-26. [2] Smart Cities USA. http://smartamerica.org/teams/smart-cities-usa/. Accessed: 2015-07-26. [3] R. Alzbutas, T. Ieˇsmantas, M. Povilaitis, and J. Vitkut˙e. Risk and uncertainty analysis of gas pipeline failure and gas combustion consequence. Stochastic Environmental Research and Risk Assessment, 28(6):1431–1446, 2014. [4] B. Anifowose, D. Lawler, D. Horst, and L. Chapman. Evaluating interdiction of oil pipelines at river
[5]
[6]
[7]
[8]
[9]
[10]
[11] [12]
[13]
[14]
[15]
[16]
[17]
[18]
[19]
crossings using environmental impact assessments. Area, 46(1):4–17, 2014. F. Bonomi, R. Milito, P. Natarajan, and J. Zhu. Fog computing: A platform for internet of things and analytics. In Big Data and Internet of Things: A Roadmap for Smart Environments, pages 169–186. 2014. F. Bonomi, R. Milito, J. Zhu, and S. Addepalli. Fog computing and its role in the internet of things. In Proceedings of the first edition of the MCC workshop on Mobile cloud computing, pages 13–16, 2012. M. Castro, A. J. Jara, and A. F. Skarmeta. Smart lighting solutions for smart cities. In International Conference on Advanced Information Networking and Applications Workshops (WAINA), pages 1374–1379, 2013. Z. Chen, G. Hefferman, and T. Wei. Multiplexed oil level meter using a thin core fiber cladding mode exciter. IEEE Photonics Technology Letters, (99):1–1, 2015. Z. Chen, Y. Zeng, G. Hefferman, and Y. Sun. Fiberid: molecular-level secret for identification of things. In IEEE International Workshop on Information Forensics and Security (WIFS), pages 84–88, Dec 2014. S. Dey, A. Chakraborty, S. Naskar, and P. Misra. Smart city surveillance: Leveraging benefits of cloud data stores. In IEEE Conference on Local Computer Networks Workshops, pages 868 – 876. R. O. Duda, P. E. Hart, and D. G. Stork. Pattern classification. John Wiley & Sons, 2012. M. Froggatt and J. Moore. High-spatial-resolution distributed strain measurement in optical fiber with Rayleigh scatter. Applied Optics, 37(10):1735–1740, 1998. J. Gubbi, R. Buyya, S. Marusic, and M. Palaniswami. Internet of Things (IoT): A vision, architectural elements, and future directions. Future Generation Computer Systems, 29(7):1645–1660, 2013. G. Hefferman, Z. Chen, L. Yuan, and T. Wei. Phase-shifted terahertz fiber bragg grating for strain sensing with large dynamic range. IEEE Photonics Technology Letters, 27(15):1649–1652, Aug 2015. J. Kane, B. Tang, Z. Chen, J. Yan, T. Wei, H. He, and Q. Yang. Reflex-Tree: A biologically inspired parallel architecture for future smart cities. In International Conference on Parallel Processing (ICPP), 2015. K. Su, J. Li, and H. Fu. Smart city and the applications. In International Conference on Electronics, Communications and Control (ICECC), pages 1028–1031, 2011. B. Tang and H. He. ENN: Extended nearest neighbor method for multivariate pattern classification. IEEE Computational Intelligence Magazine (CIM), 10(3):52–60, 2015. B. Tang, H. He, Q. Ding, and S. Kay. A parametric classification rule based on the exponentially embedded family. IEEE Transactions on Neural Networks and Learning Systems, 26(2):367–377, Feb 2015. B. Tang, S. Khokhar, and R. Gupta. Turn prediction at generalized intersections. In IEEE Intelligent
Vehicles Symposium (IV), pages 1399–1404, 2015. [20] S. Yamamoto, S. Matsumoto, and M. Nakamura. Using cloud technologies for large-scale house data in smart city. In IEEE 4th International Conference on Cloud Computing Technology and Science, pages 141–148, 2012.