HiCH, for IoT-based health monitoring systems. e core components of the proposed ...... An Apache server is programmed in the gateway for transmi ing data to.
HiCH: Hierarchical Fog-assisted Computing Architecture for Healthcare IoT IMAN AZIMI, University of Turku ARMAN ANZANPOUR, University of Turku AMIR M. RAHMANI, University of California Irvine and TU Wien TAPIO PAHIKKALA, University of Turku MARCO LEVORATO, University of California Irvine PASI LILJEBERG, University of Turku NIKIL DUTT, University of California Irvine
The Internet of Things (IoT) paradigm holds significant promises for remote health monitoring systems. Due to their life- or mission-critical nature, these systems need to provide a high level of availability and accuracy. On the one hand, centralized cloud-based IoT systems lack reliability, punctuality and availability (e.g., in case of slow or unreliable Internet connection), and on the other hand, fully outsourcing data analytics to the edge of the network can result in diminished level of accuracy and adaptability due to the limited computational capacity in edge nodes. In this paper, we tackle these issues by proposing a hierarchical computing architecture, HiCH, for IoT-based health monitoring systems. The core components of the proposed system are 1) a novel computing architecture suitable for hierarchical partitioning and execution of machine learning based data analytics, 2) a closed-loop management technique capable of autonomous system adjustments with respect to patient’s condition. HiCH benefits from the features offered by both fog and cloud computing and introduces a tailored management methodology for healthcare IoT systems. We demonstrate the efficacy of HiCH via a comprehensive performance assessment and evaluation on a continuous remote health monitoring case study focusing on arrhythmia detection for patients suffering from CardioVascular Diseases (CVDs). Additional Key Words and Phrases: Internet of Things, Remote Patient Monitoring, Hierarchical Computing, Fog Computing, MAPE-K, Machine Learning
1
INTRODUCTION
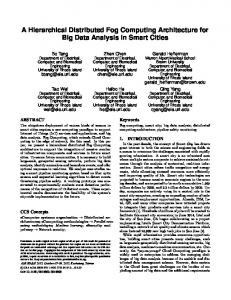
There is a growing demand for dependable autonomous health monitoring services for patients suffering from acute diseases [56]. The main function of automated health monitoring systems is to detect medical emergencies and patient health deterioration early enough, as rapid response (i.e., from a few seconds to a few minutes) is instrumental to implement effective countermeasures [45, 53]. Thanks to recent advancements in Internet of Things (IoT) technologies, it is possible to develop remote monitoring services with 24/7 availability for early-detection and preventive purposes. The IoT paradigm envisions a network scenario where objects (e.g., sensors) are connected and uniquely identified over the global communication infrastructure [9]. Within the healthcare sector, IoT architectures can be decomposed into three main layers [3], as shown in Figure 1. At the first layer, data collection is performed by distributed and mobile sensors. At the second layer, gateways and access points provide continuous connectivity and conventional services such as protocol conversions. These two layers are located at the vicinity of the monitored person. Different communication protocols such as Wi-Fi and Bluetooth LE are often used at this layer to communicate with sensors [54]. In a traditional (i.e., client-server cloud-based) architecture for 2017. 1539-9087/2017/10-ART1 $15.00 DOI: 0000001.0000001 This article will be presented in the International Conference on Embedded Software 2017 and will appear as part of the ESWEEK-TECS special issue
1
I. Azimi et al.
Fig. 1. IoT-based system for remote patient monitoring.
remote health monitoring, gateways only act as a relay between sensors and remote servers. The third layer consists of cloud resources interconnected to the local edge layers through multi-hop networks. The cloud layer stores and process the sensory data to extract information, and possibly generate notifications as a form of actuation. A broad range of data analytics, machine learning and artificial intelligence algorithms have been implemented at this layer to provide a wide spectrum of services [16]. For instance, the cloud can serve as a pre-processing layer for data whose extracted content is eventually post-processed by experts (e.g., health providers). Alternatively, the extracted information can be stored for later actions (e.g., health coaching) [41, 47]. The cloud-based IoT architecture can provide acceptable performance and reliability to support non-safety and latency critical applications. Examples of such services are several commercial and smart city applications [16]. However, remote patient monitoring systems necessitate a higher degree of dependability, accessibility, and robustness. Therefore, a straightforward extension of the classic client-server model used in the Internet to encompass “things” is not suitable for a large class of IoT applications, among which lies that at the focus of this investigation. Important issues which interests traditional cloud-based architectures is the occurrence of disconnection from the core network or bandwidth and latency variations. Clearly, these issues can have a severe negative impact on remote health monitoring services, where the end-user is often a patient with critical and time-sensitive needs. For instance, in emergency situations, a delay in establishing a connection may lead to fatal consequences for the patient. In addition, remote monitoring of several patients over time can overload storage and processing capabilities of the cloud, as well as generate an excessive load (i.e., big data) to communication networks, possibly disrupting existing services [13, 37]. Although producing a large volume of data is inevitable in many IoT applications, intelligent pre-processing techniques at the edge can significantly mitigate the volume of the generated data as well as the stress to the network infrastructure. Alternative approaches propose the use of an intermediate Fog computing layer [15] capable of data processing to enhance reliability and efficiency of the IoT architecture. An intelligent use of such resource can lead to performance sufficient to meet the stringent requirements of healthcare applications. The fog layer is equipped with (limited) computational capacity, which enables the system to locally provide basic, and yet critical, services, and locally controlled distributed systems. Thus, to implement reliable healthcare applications and services, there is the need for effective and application-centric methodologies to map computational and resource management tasks across the layers of the IoT architecture. In our context, an effective model can leverage the available resources and manage flow of data within the system from sensors to computational resources, as well as the reverse flow of control. In this paper, we present a hierarchical fog-assisted computing architecture, HiCH, for remote IoT-based patient monitoring systems featuring autonomous data management and processing at the edge. We first show that the conventional Observe-Decide-Act (ODA) control strategy [38] is not capable of fully exploiting the features offered by the fog computing paradigm, and then, This article will be presented in the International Conference on Embedded Software 2017 and will appear as part of the ESWEEK-TECS special issue
HiCH: Hierarchical Fog-assisted Computing Architecture for Healthcare IoT
1
propose to exploit and customize the concept of MAPE-K autonomic computing – with adaption control loops – introduced by IBM [33] as a more efficient alternative. The main contributions of this paper are as follows: • We propose a hierarchical computing architecture and a methodology to efficiently partition and accommodate the existing machine learning methods for fog-enabled healthcare IoT systems. • We customize, enhance, and map IBM’s MAPE-K model for the proposed architecture to better manage system resources. • We present a closed-loop management technique featuring an adaptive data transmission solution based on patient’s conditions. • We demonstrate a full system implementation for continuous remote health monitoring case study focusing on arrhythmia detection for patients suffering from CardioVascular Diseases (CVDs). The rest of the paper is organized as follows. Section 2 outlines background and related work for this research. We detail our proposed approach, HiCH, in Section 3. In Section 4, we demonstrate a full system prototype and evaluate HiCH via a case study. In Section 5, we briefly discuss advantages, limitations and future work of HiCH. Finally, Section 6 concludes the paper. 2
BACKGROUND AND RELATED WORK
In this section, we first briefly survey contemporary IoT-based health monitoring systems published in the literature. We then describe the computing models typically deployed in IoT systems. 2.1
IoT Architecture and Fog Computing
IoT-enabled systems for health monitoring are typically designed to provide health applications such as early-detection and prediction for users (e.g., patients and health providers) by implementing data collection from patients, data transmission and data analytics. These scheme are broad in scope, ranging from simple to complex monitoring systems. In simple IoT-based monitoring systems, only data collection, transmission and visualization for the users are implemented, and no decision nor analytics concerning patient’s health condition is reported [7]. Hence, these simple IoT-based monitoring systems are insufficient for ubiquitous monitoring that demands the additional capabilities of analytics and decision-making. Similarly, there are various medical cyber-physical system (MCPS) solutions designed to autonomously actuate tasks w.r.t the sensor data and local decision making. Instances are artificial pancreas for insulin injection regulation [27] and a brain machine interfaces [57]. Such solutions are mostly restricted to typical data processing techniques (e.g., peak detection) using local computational capacity. Therefore, they do not use heavy data analytics such as complex learning algorithms for predictions mainly due their resource constraints. On the other hand, more complex monitoring systems augment intelligent services using data analytic methods varying from rule-based method to different learning algorithms [32]. Cloudbased services are conventionally responsible for these analytics. In such systems, medical data is collected from the individual via sensors; the data is delivered to cloud servers through a gateway; and extracted information and awareness regarding individual’s conditions are shared with users (e.g., health providers). Several IoT-based architectures have been proposed for remote monitoring using this model. Some examples are ECG monitoring systems using wearable devices [10, 41, 52], Early Warning Score (EWS) systems for health deterioration detection [5, 11] and remote physiological parameter monitoring [21, 25, 26, 28, 30]. Unfortunately, these systems critically rely on uninterrupted Internet connections during monitoring; loss of (or degraded access to) This article will be presented in the International Conference on Embedded Software 2017 and will appear as part of the ESWEEK-TECS special issue
1
I. Azimi et al.
Internet connections during monitoring may result in loss of important services such as emergency situation notification and abnormality prediction. Therefore, remote health monitoring with fully cloud-based services run a risk of having flaws in case of patient health deterioration. In addition to cloud-based IoT systems, there are IoT architectures enabled by fog computing concepts. Fog computing [14, 49] is the concept of extending the cloud computing paradigm to the edge of the network and has been recently proposed to enable new types of services such as local computation, storage, and control for IoT systems. One approach to realize this concept, in particular for the healthcare domain, is by forming an intermediary layer of networked smart gateways between sensors and the cloud [50]. Fog computing offers a variety of advantages to IoT-based applications from both user and system perspectives. Geographic diversity, improved privacy, enhanced reliability and latency reduction are among these benefits [17, 20, 55, 58]. In fog-based architectures, gateway devices perform local data processing along with data transmission to cloud servers. Several research studies have investigated fog computing for health monitoring systems. In these systems, different analytics such as feature extraction [43] and data processing methods [18, 19, 23] are pushed to the fog layer. Moreover, fog computing enables resource management at the local layer, however the management techniques are mostly limited to methods with low computation costs such as rule-based methods [2, 6]. Although these fogbased systems offer notable benefits for remote health monitoring systems, their functionality is bounded due to the limited computational capacity at the edge nodes. Therefore, powerful machine learning algorithms for local decision making cannot be implemented in the fog. Furthermore, the performance, Quality of Service (QoS) and Quality of Experience (QoE) of the system might be degraded since these fog-based algorithms may not as powerful/sophisticated as cloud-based ones. In sum, ubiquitous health monitoring applications need to provide a high level of quality in attributes such as availability and accuracy, most of which cannot be satisfied by the aforementioned systems. Although both cloud-based and fog-based architectures provide benefits for the monitoring, their applications are insufficient due to their architectural limitations. In this regard, a new architecture is needed to overcome the limitations while leveraging the best features offered by both schemes. This could be achieved by amalgamating both computing paradigms and partitioning the health analytics in a hierarchical behavior. Moreover, a management technique enabled by learning algorithms is required to adjust system behavior with respect to the analytics and based on the context. We overcome these issues in our HiCH approach by presenting an autonomic computing model for the IoT architecture as described next. 2.2
Computing Models
The computation model plays an important role in IoT systems to efficiently implement various analytics at different architectural layers. Therefore, to enhance different system characteristics, it is crucial to identify, customize, and map a proper computing model to IoT system tiers (i.e., sensor network, gateway, and cloud). Depending on the application, different computing models can be utilized for this purpose. The conventional Observe-Decide-Act (ODA) management strategy [38] is an existing popular model that is composed of three parts: to manage data collection (Observe), to analyze data and exploit knowledge (Decide) and to implement suitable actions (Act). Due to its centralized nature for analytics and decision making, this model is well-suited for cyber physical systems (CPS) with local computation capacity at the sensor network or centralized cloud-based IoT systems; however it cannot fully exploit available resources in distributed or hierarchical computing systems. MAPE-K is an alternative computing model introduced by IBM [33]. MAPE-K provides automated management components for computational units and specifies system behaviors. The architecture This article will be presented in the International Conference on Embedded Software 2017 and will appear as part of the ESWEEK-TECS special issue
HiCH: Hierarchical Fog-assisted Computing Architecture for Healthcare IoT
1
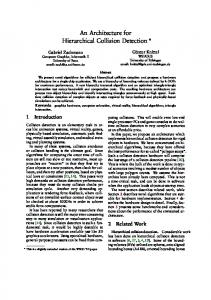
Fig. 2. IBM’s MAPE-K model [33]
for MAPE-K model is specified in four different computing components: Monitor, Analyze, Plan, and Execute with access to a partially or fully shared knowledge base (see Figure 2). Monitor collects data coming from different resources (i.e., sensors). It is the closest computing component to the sensing fabric. It can also track and determine events that need to be analyzed. Analyze provides data analytics to model situations. Data pattern, prediction techniques and metadata are exploited in this component. Plan is in charge of selecting or generating a procedure for the system w.r.t. the inputs received from the Analyze component. This procedure can be either a single command or a complicated plan. Finally, Execute provides necessary changes in the system, to implement procedures generated in Plan component and in general to adjust the behavior of the system. In this work, we address the reliability, efficiency, and management issues in the existing health monitoring systems by leveraging the concept of MAPE-K and proposing a novel partitioning strategy to hierarchically compute data analytics and manage system resources. Our approach aims at exploiting the best of both worlds, cloud and fog computing. 3
HICH: THE PROPOSED SYSTEM
In this section, we present HiCH, a hierarchical computing architecture tailored for fog-enabled IoT systems and designed to leverage the benefits of fog and cloud computing paradigms for remote health monitoring. HiCH offers a new computing and management model with two major contributions: 1. HiCH partitions the health data analytics into two parts: the centralized part located in the cloud, and the distributed part running on fog nodes. In contrast to traditional approaches that use a centralized computing core in the cloud or fog tier, we propose a hierarchical autonomic healthcare system where the computation and knowledge are distributed across different tiers. This hierarchical computing scheme enables partitioning of analytics and decision making between the fog and cloud, thereby significantly enhancing the availability, response time and robustness of health monitoring services at the edge. The edge devices (e.g., gateways) are augmented with a high degree of intelligence to provide local monitoring and notification when the cloud connectivity is unavailable or unstable. 2. HiCH deploys a closed-loop system management technique tuned to the patient’s conditions (i.e., context). These conditions could be defined according to the patient’s medical parameters, activities and surrounding environments. The approach can be used to manage different system resources, although in this paper we only focus on traffic management to control data transmission from the fog to the cloud. To clarify the functionality and definitions of the architecture, we present and exemplify different components of HiCH via a case study. Below, we first describe our case study of a continuous remote health monitoring system. This article will be presented in the International Conference on Embedded Software 2017 and will appear as part of the ESWEEK-TECS special issue
1
I. Azimi et al.
Fig. 3. Enhanced MAPE-K model
3.1
Case Study
Our case study focuses on arrhythmia detection in ECG monitoring for patients suffering from CVDs, as an exemplar of a continuous remote health monitoring using HiCH. The deployed system uses a typical single-channel ECG with 250 samples per second, a Microcontroller Unit (MCU), and a wireless transmitter integrated as a sensor node. In the setup, we consider 10-second windows for ECG signals, and the transmission (from fog to cloud) period of 1 minute. 3.2
Architecture
The HiCH architecture incorporates the concept of MAPE-K and fog and cloud computing paradigms in remote health monitoring systems, enabling hierarchical partitioning and execution of machine learning algorithms across these computing layers. As discussed in Section 2.2, MAPE-K model includes 4 computing components, each sharing the system knowledge. To enable hierarchical computing, MAPE-K components need to be properly mapped into the three layers of the IoT system. Furthermore, to fulfill the desired closed-loop behavior for resource management, we propose an enhanced MAPE-K model in which a new component System Management is integrated (see Figure 3). The four MAPE-K components are enabled with feedback in the model. The feedback received from Execute, System Management is used to periodically tune the computing components with respect to the inputs and the computations in the model. We distribute and map the 5 components of the enhanced MAPE-K into a 3-tier IoT-based system. Figure 4 illustrates the architecture. The idea is to i) map the heavy training procedures in the cloud while outsourcing the trained hypothesis (e.g., classifier) to the fog nodes to be able to operate in a standalone way, ii) periodically update the hypothesis at the fog, and iii) exploit the knowledge at the edge to enhance resource management via closed-loop control. The blue arrows in Figure 4 show the closed-loop behavior: the flow of action to the user and the flow of feedback to the system through the sensors. Monitor is the first computing component in HiCH located in the sensor layer. This component is a bridge between sensors and other units. Analyze is the only computing component located in the cloud to process and model complex monitoring conditions. The component receives data from System Management. The data contains various information regarding patient health conditions and presumably his surrounding contexts. Analyze derives a hypothesis function (i.e., model) from the data and transfers it to Plan. Plan is placed in the fog layer to enable local decision making that determines the patient’s condition. The decision making is enabled by receiving the hypothesis from Analyze and continuous sensory data. The sensor data are received through System Management. Execute is the second computing component in the fog layer to set system behaviors during monitoring. Finally, System Management is the third component in the Fog layer to locally manage the system configurations. It determines the current state of the system considering previous states and the decision received This article will be presented in the International Conference on Embedded Software 2017 and will appear as part of the ESWEEK-TECS special issue
HiCH: Hierarchical Fog-assisted Computing Architecture for Healthcare IoT
1
Fig. 4. HiCH: Our proposed IoT-based architecture
regarding the patient condition. In this architecture, we only allocate data transmission (i.e., bandwidth) management to this component although it can be extended to cover other types of system resources (e.g., energy). In the following, we present the role of each component in the architecture, and exemplify them via our case study. 3.2.1 Monitor. The Monitor component is shown in Figure 5(a). It includes an Analog-to-Digital Converter (ADC) to convert sensor analog outputs to digital parameters and signals. Moreover, a Microcontroller Unit (MCU) is integrated to enable data aggregation in a local data storage and data pre-processing such as noise filtering and normalization. Finally, the data are packetized and periodically transmitted to System Management. The packet size and the transmission period depend on the data type collected by sensors. In our case study, a sensor node including a digitized single-channel ECG, a Microcontroller Unit (ATmega328P), and a wireless transmitter (RN42) is used. 3.2.2 Analyze. According to the type of sensor data, different machine learning algorithms can be chosen for data analytics in the Analyze component (Figure 5(b)). Since the generated hypothesis function (model) needs to be executed at the edge in the Plan, the limited processing power and data storage capacity of the gateways at the edge needs to be considered in the proposed techniques. To indicate the functionality in HiCH, we assume a simple supervised learning model [1] in Analyze. To this end, we define h as a hypothesis function in a hypothesis set (h ∈ H ) to satisfy: h:X→Y
(1)
where X ∈ Rd represents the input space including n samples with d attributes and Y is output space that is a vector of patient or context conditions. To simplify the model, we consider an output vector with two possible outcomes, that is, normal and emergency conditions. However, the model can be extended to provide multi-class classifications (more details in [42]). Let us consider a classifier h inferred by a linear machine learning method (e.g., perceptron or linear support vector machine): h(x ) = sдn(w T x + b) (2) This article will be presented in the International Conference on Embedded Software 2017 and will appear as part of the ESWEEK-TECS special issue
1
I. Azimi et al.
(a) Monitor in sensor layer
(c) Plan in fog
(b) Analyze in cloud
(d) System Management in fog
Fig. 5. Major components of HiCH
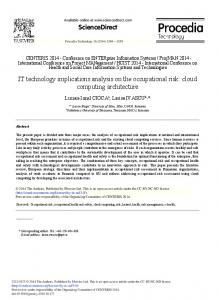
where sдn(.) is a sign function, x is the input with d attributes, b is a bias value and w is a weight vector inferred by the learning algorithm from the training data. From Equation (2), we observe that the computational complexity of performing a prediction with hypothesis h is O (d ) in both space and time, since it requires storing the d-dimensional vectors x and w in memory and carrying out an inner product between them. Nonlinear classifiers may also be fitted to HiCH depending on their time and space complexity. However, some nonlinear classifiers are inappropriate for this architecture. For instance, instancebased learning methods such as K-Nearest Neighbor (KNN) cannot be used in this architecture as the training set would need to be stored in the fog layer, and hence the space complexity would be O (dn), where n denotes the number of training data. In the Analyze component, x and y are constructed in Training Data (Figure 5(b)). Since sensor data defined in specific time-windows are heterogeneous (e.g., various signals and parameters), we must extract attributes for each time-window. x is created using the extracted attributes from sensor data and other attribute vectors from History Data and Plan feedback. In this manner, h is learned and personalized during the monitoring not only from current sensory data but also from patient history and system feedback (i.e., possible errors). Moreover, y as the output labels are generated using user feedback (e.g., daily reports in occurred events) and other calibrated devices (e.g., medical and hospital devices). h is generated in Learning Algorithm using x and y from Training Data and possible hypotheses from the Hypothesis Set (see Figure 5(b)). In this system, the learning is divided into two parts. At the system initialization phase, h is generated with recorded history data. At runtime, h is updated during the monitoring with new data. h is stored in Final Hypothesis and subsequently is sent to Plan for local decision making. Moreover, values such as the intensity of emergency events are sent to History Data for future learning. In our case study, the Training Data unit is responsible for denoising the input signal by using a bandpass filter with the range of 3 − 45 Hz. Then, ECG cycles are identified by segmenting each window based on RR peaks. To this end, we use the Biosppy toolbox [34] in Python. Figures 6(a) and 6(b) provide examples of normal ECG cycles (60 cycles) and abnormal ECG cycles affected by arrhythmia (67 cycles) referring to a one minute period. To better illustrate the ECG This article will be presented in the International Conference on Embedded Software 2017 and will appear as part of the ESWEEK-TECS special issue
HiCH: Hierarchical Fog-assisted Computing Architecture for Healthcare IoT
1
(a) One minute of normal ECG cycles (b) One minute of ECG cycles with ar- (c) An ECG cycle in temporal domain (60 cycles). rhythmia (67 cycles)
Fig. 6. (a) and (b) indicates collected ECG cycles. (c) represents a cycle with different temporal features.
cycle differences, the detected peaks are aligned. As shown in the figures, when abnormality is not present, the signal is almost unchanged across ECG cycles. In contrast, the signals corresponding to arrhythmia present significant variations across ECG cycles. Moreover, Training Data extracts 5 features in the temporal domain [36] for each ECG cycle. The features include QRS complex duration, T wave duration, RR interval, PR interval and ST segment. One ECG cycle in temporal domain is illustrated in Figure 6(c). To extract temporal features, we implement cross-correlation between each cycle and a Triangular signal, defined as: Z def ∞ ∗ ( f ∗ д)(τ ) = f (t )д(t + τ )dt (3) −∞
where f is the ECG cycle, and д is a Triangular signal defined by: 0 x (t ) = A[1 −
|t | T ]
|t | ≥ 1 |t | < 1
(4)
where T is the signal length that in our case equals to a QRS complex length, and A is the amplitude that in our case is a QRS complex amplitude. Using this cross-correlation, we utilize the two signals similarities for detecting peaks in each ECG cycle. We use linear Support Vector Machine (SVM), a supervised machine learning algorithm, to distinguish between the binary hypothesis (normal vs. arrhythmia). The algorithm is selected because of its low computation cost compared to other alternatives such as neural network backpropagation in which more values (i.e., weights for different layers) should be stored in Plan. Moreover, the algorithm represents an acceptable binary classification on the data (see Section 4.3). The implemented SVM classifier uses the hypothesis function defined by Equation 2 by storing the vector of primal variables w along with the constant b and then sending it to Plan. Consequently, a single inner product between w and x in Plan is deployed, instead of expensive computations. For more details see [42]. The classifier is implemented using Scikit-learn [46] in Python. 3.2.3 Plan. Similar to the feature extraction approach in Analyze, attributes are extracted from the sensor data in Test Data unit. Then, Decision Making input, x 0 ∈ Rd including d attributes, is created (see Figure 5(c)). The generated hypothesis in Analyze is periodically downloaded to Hypothesis Function unit. Such feature provides a personalized classifier during the monitoring and subsequently increases This article will be presented in the International Conference on Embedded Software 2017 and will appear as part of the ESWEEK-TECS special issue
1
I. Azimi et al.
Fig. 7. Abnormality detection implemented in the Plan.
the accuracy. The update period (e.g., daily or weekly) is specified with respect to the types of the sensor data. A decision vector is generated from Decision Making unit that indicates the current patient’s condition. The vector as the Plan output is forwarded to the Execute for system actuation. In our case study, the incoming ECG signals defined in 10 windows is converted to features in Test Data unit. Then, the window is classified as normal or abnormal using the current hypothesis function. Finally, the component sends the label assigned to each window to Execute component. Figure 7 shows an example where abnormality is detected at the Plan component. Decisions are indicated by the red dots, with an abnormal situation detected between the 600 to 720 second interval. 3.2.4 Execute. Execute fulfills the actuation in the system by forwarding updates to three other parts in the architecture. First, it updates System Management to apply changes with respect to the patient condition. Second, it locally notifies patient and health providers about the patient condition; third, it provide a system feedback for Analyze by sending the decision to the cloud. 3.2.5 System Management. In this architecture, data transmission control is performed by System Management. This component includes 4 different units to receive data from the sensor layer, to locally store and organize the data and to transmit it to Plan and the remote cloud. Figure 5(d) indicates the units along with data and command flows. The sensory data are collected via Receiver and are stored in Data Storage. Data Storage is designed to locally store and organize the data (e.g., data structure), to send a complete set of
Fig. 8. The state diagram for n = 4 and m = 4. S 1:n shows system states while P1:m represents patient’s conditions. This article will be presented in the International Conference on Embedded Software 2017 and will appear as part of the ESWEEK-TECS special issue
HiCH: Hierarchical Fog-assisted Computing Architecture for Healthcare IoT
1
sensory data to Plan for local decision making and to implement required data reduction for the transmission to the cloud. Transmitter sends the data to the remote servers with a reconfigurable transmission rate with respect to the commands from Management Algorithm. Management Algorithm is the processing core of this component that receives updates from Execute. It controls data reduction and data transmission rate via communicating with Data Storage and Transmitter. We utilize a finite-state machine (FSM) to model Management Algorithm. In the model, S = [s 1 , s 2 , ..., sn ] includes n possible system states where s 1 performs the lowest state (i.e., the most cost-effective setting with the lowest transmission rate from the fog to the cloud) and sn represents the highest state (i.e., the most accurate setting with the highest performance). External input of the FSM defines as P = [p1 , p2 , ..., pm ] containing patient conditions where p1 indicates normal condition and pn represents high-risk condition. Regarding the current state and the external input, the next state is determined, and subsequently system configuration is updated. In the state determination, the system instantly jumps from a low state to higher ones to enable rapid response to emergency cases. However, it gradually decreases (one step per iteration) from a high state to lower ones. To indicate the functionality of the proposed FSM, we represent the state diagram of an example in Figure 8.
Fig. 9. The flowchart for data transmission from the fog to the cloud This article will be presented in the International Conference on Embedded Software 2017 and will appear as part of the ESWEEK-TECS special issue
1
I. Azimi et al.
In our case study, System Management is a Python process running on gateways and being responsible for deciding which portion of incoming data should be transferred to the cloud. This is a part of the local processing which dramatically reduces the external bandwidth from the gateway device to the cloud. Given that the decision making is implemented in the fog (i.e. Plan), and the data is transmitted to the cloud (i.e., Analyze) for updating the model. Therefore, this data reduction does not affect the decision making. In other words, in our case, System Management eliminates redundant features in normal conditions although in abnormal cases, it completely transmits the data, from which new information could be obtained for the model. In System Management, data are recorded in two cache storage units defined based on patient’s conditions (i.e., normal and abnormal). Figure 9 shows the control flowchart in the System Management. We define W as the number of windows in a transmission period, and Q as the portion of data that will be transmitted if the patient’s condition is normal. In the considered setup, the window length is 10 second, and the transmission period is 1 minute; so W is 6. The flowchart indicates a loop over each window in the transmission period. In this loop, the cache storage A stores every window of data irrespectively of the conditions, and cache storage B stores only Q window(s) of data whether patient’s condition is normal in the current transmission period. At the end of each iteration, System Management sends the data in cache A to the cloud if at least one abnormal window is detected, otherwise it sends the data in cache B. 4 SYSTEM DEMONSTRATION AND EVALUATION In this section, we present a typical use-case for HiCH where continuous monitoring of ECG signals is used to detect possible arrhythmia. The detection of arrhythmia triggers a notification to the person under monitoring and health providers. In this case study, HiCH is compared with a baseline IoT system introduced in Section 4.1. 4.1
The Baseline IoT System
As discussed in Section 2, there are various IoT-based remote health monitoring systems (e.g., cloudbased and fog-based) that can be selected as a baseline for performance and efficiency comparisons. We consider the conventional and centralized ODA- and cloud-based IoT architecture as the baseline in this study. The baseline IoT system is illustrated in Figure 10. In this architecture, health data is first collected from the sensor layer. The data is then transmitted to the cloud through an access point, (i.e., gateway device). Afterwards, incoming data is stored and analyzed in the cloud layer to provide actions for the system and notifications for users. In this architecture, no significant computing resources are placed in the gateway and the computing core is centralized in the remote server. The computing core in this architecture can be modeled by
Fig. 10. The IoT-based system modeled by ODA This article will be presented in the International Conference on Embedded Software 2017 and will appear as part of the ESWEEK-TECS special issue
HiCH: Hierarchical Fog-assisted Computing Architecture for Healthcare IoT
Jetson-TK1
HP Compaq 8200 Elite
Architecture
Quad-core Cortex A15 + 192 CUDA cores ARMv7-A
Speed
2.33 GHz
3.10 GHz
RAM
2 GB
16GB
Processor
1
Quad-core Core i3 2100 Intel Core
External 16 GB fast 250GB SATA HDD Storage eMMC Table 1. The gateway devices’ specifications
ODA control strategy in which Observe is placed in the sensor layer and Decide and Act are placed in the cloud, as shown in Figure 10. 4.2
Setup
For the training and test medical data, we utilize “Long-Term ST Database” available on Physiobank [29, 35]. Since we use existing data, we emulate the sensing part by transmitting the pre-recorded data from the MicroSD card of the sensor node. We use ATmega328P micro-controller [8] to read the pre-recorded data, which is then sent to an RN-42 Bluetooth module [40] through serial link. From the available data set, we select a period of 5 hours from a healthy patient along with 5 hours from an individual suffering from a CVD. The samples are used to train a data analysis module in the Analyze component. A test data set is also created to assess the performance of the remote classifier whose task is to detect abnormalities. In the test data set, we simulate an emergency scenario by introducing ECG data corresponding to arrhythmia at a random point within a normal ECG signal. To facilitate the analysis, we divide the signal into windows of 10 seconds. For the fog layer, we use single-board computers. Specifically, Linux-based computing boards are selected to run an Apache server and Python code for the data processing at the fog. In this case study, we used an NVIDIA Jetson-TK1 [44] board and an HP Compaq 8200 Elite Linux machine, each of which presents different characteristics. The HP Compaq 8200 Elite is powered by a Quad-core Corei3 2100 CPU and 16GB RAM, which provides much better performance compared to Jetson-TK1 platform. Table 1 indicates the platforms’ specifications. At the fog layer, a Python service is responsible for receiving data from sensor nodes via a Bluetooth module using the serial communication port. The Python service is also developed to store and process the data. An Apache server is programmed in the gateway for transmitting data to the cloud. The fog device uses TCP protocol to establish a wireless communication link to the cloud server. In order to implement the adaptive behavior which is the core of the proposed architecture, the System Management has a set of transmission rates which can be dynamically selected while relaying the data. The rate is controlled concerning normality or abnormality detection in Plan component. In the baseline IoT system, the gateway sends all the data to the cloud using TCP protocol, and waits for the acknowledgment from the cloud server. The cloud server is a Linode VPS (virtual This article will be presented in the International Conference on Embedded Software 2017 and will appear as part of the ESWEEK-TECS special issue
1
I. Azimi et al. Predicted Value True Value
TN = 0,97 FN = 0,01
FP = 0,03 TP = 0,99
Table 2. Normalized confusion matrix
private server) [39] with two 2.50GHz Intel Xeon CPU(E5-2680 v3), 4GB memory and SSD storage drive running Apache web server on Ubuntu Linux. 4.3
Accuracy Assessment
We first validate the outcomes of the proposed architecture. To assess the accuracy of detection at the cloud, we use the k-fold cross-validation technique [1], where we set k to 10, the defined training set of 10 hours is partitioned into 10 sub-periods where in each experiment, 9 sub-samples are considered as training data and 1 as validation data. The overall accuracy is equal to 0, 936 (±0, 055). Although the portion of ECG signals with arrhythmia might be less than normal ones in practical experiments, we utilized training set with almost equal portions of normal and abnormal ECG data to obtain unbiased results. In addition to the validation performed using training data set from the same patients, we crossvalidate the performance of the system using test data from 4 new patients, whereas the classifier is trained using data from the previous patients. Using the true values and the estimated values, we have the normalized confusion matrix indicated in Table 2, whose F 1 score is also calculated as: 0, 98. However, we remark that different implementations of the classifier may produce different results. In consequence, the algorithm performed an acceptable classification to distinguish between normal and abnormal ECG cycles. 4.4 Performance Evaluation Next, we assess HiCH in comparison with the baseline IoT system from two different perspectives: (i) we consider response time, and (ii) we evaluate data traffic (bandwidth utilization) in both systems. 4.4.1 Response Time. We now focus on response latency, a critical metric to measure system response to alert the user in case of emergency. Dividing time latency into data transmission time and computation time, we have:
Fig. 11. Response time in the baseline IoT and HiCH. This article will be presented in the International Conference on Embedded Software 2017 and will appear as part of the ESWEEK-TECS special issue
HiCH: Hierarchical Fog-assisted Computing Architecture for Healthcare IoT
Spec. (Ping, DL, UL) b + c (ms)
Wi-Fi
4G
3G
GPRS
2ms 30Mb/s 15Mb/s 125±17
20ms 4Mb/s 3Mb/s 147±16
100ms 750kb/s 250kb/s 405±23
500ms 50kb/s 20kb/s 3686±4
1
Table 3. Latency (b + c) between the gateway devices and server with different connection networks.
a) b) c) d)
Data transmission time from the sensor node to the gateway device Data transmission time from the gateway device to the cloud Notification transmission time from the cloud to the gateway device Notification transmission time from the gateway device to the patient (i.e., a node placed in the sensor layer)
and α) Computation time for data analytics in the cloud β ) Computation time for data analytics in the fog Therefore, the baseline IoT system’s latency is calculated as a + b + α + c + d while the latency for HiCH is a + β + d (Figure 11). In our case study, the ECG data sampling rate is 250 samples per second while each sample is 3 bytes. Considering the recording time for a window (10 seconds in our case) and the header, the sensor node should send 8000 bytes (7500 bytes of data + 500 bytes header) per transmission to the gateway. The transmission module (i.e., RN-42 Bluetooth) in the sensor node takes 651 ms to transmit 8000 bytes using 115200 bit/s baud rate. Therefore, a = 651 ms. Moreover, sending a 500-bytes notification header using the same module and baud rate takes 43 ms (d = 43 ms). In contrast with {a and d}, {b and c} are not fixed values and depend on the available network specification. Table 3 shows {b + c} values for Wi-Fi, 4G, 3G and GPRS networks, each of which has different latency (i.e., ping time), download and upload speeds. These values were obtained from data transmission for 1 hour monitoring. The computation time in our case study is measured as follows: α equals (22 ± 3ms), and β (using different boards) equals: (27 ± 2ms) using HP and (65 ± 3ms) using Jetson-TK1. Given that Plan has the most computation burdens compared to the two other components at the edge. The response time for the systems are shown in Figure 12. The respond time for the baseline systems (illustrated with violet bars) depends on the network transmission rate while the response time in HiCH system (illustrated with red bars) relies on the computational capacity of the gateway device. Compared to the baseline IoT systems, HiCH reduces the response time when using any of the gateway devices. This improvement is particularly significant when the connection provided by the network is weak or lost. However, we remark that gateway device specification is important in this system. To this end, we also tested HiCH on a less powerful edge device, Raspberry Pi Zero device[51], and obtained the response time of 1414ms. 4.4.2 Bandwidth Utilization and Storage. Next we evaluate the bandwidth savings in our system compared to the baseline IoT system, by assessing data transmission from the gateway to the cloud and data storage in the cloud. We use the cache size to estimate the required bandwidth to transmit the data and the required memory to store the data in the cloud. Table 4 shows the traffic handled by the System Management as a function of the parameter Q (i.e., the portion of data that will be transmitted if the patientfis This article will be presented in the International Conference on Embedded Software 2017 and will appear as part of the ESWEEK-TECS special issue
1
I. Azimi et al.
5000
4402
Response Time (ms)
4000 3000 2000 1121
863
841
759
721
B GP ase RS lin ne e Io Ba two T: rk se li ne ne tw IoT o : Ba rk 3G se lin ne e tw IoT or : 4 k G B W ase iF lin in e et IoT w H ork : iC H de : Je vi ts ce on H iC H :H P de vi ce
1000
Fig. 12. Response time for different approaches
condition is normal). The obtained values indicates a significant reduction in the bandwidth utilization over a 1 hour monitoring period if Q is small. This data traffic reduction is 82% if Q is 1. Note that if Q is set to 6, all the data is transmitted to the cloud, so it can be considered the same situation as in the baseline system. This reduction becomes more significant when the number and resolution of monitored vital signs or patient activities is increased. Similarly, Table 5 indicates the volume of stored data in the cloud for 1 hour monitoring (with 8 minutes abnormality). The volume of data during abnormality detection does not change with varying Q, due to the maximum transmission rate. However, the stored data in normal condition is remarkably reduced. This reduction of unnecessary data transmission becomes particularly more significant in long-term health monitoring scenarios where large amounts of health data need to be stored in the cloud for every patient.
Q
Data to be transferred to the cloud (KB)
Data description (KB)
TCP overhead (KB)
Total traffic (KB)
1 439 29 13 481 2 879 29 25 933 3 1318 29 37 1384 4 1756 29 49 1836 5 2197 29 61 2287 6 2636 29 73 2738 Table 4. Data traffic for 1 hour monitoring with different Q
This article will be presented in the International Conference on Embedded Software 2017 and will appear as part of the ESWEEK-TECS special issue
HiCH: Hierarchical Fog-assisted Computing Architecture for Healthcare IoT
Q
Data in normal cond. (KB)
Data in abnormal cond. (KB)
Data stored in the cloud (KB)
1
Reduction in data size
1 406 355 761 71 % 2 787 355 1142 57 % 3 1167 355 1522 43 % 4 1549 355 1904 29 % 5 1929 355 2284 14 % 6 2310 355 2665 0% Table 5. Data storage for 1 hour monitoring with different Q
5
DISCUSSION
We now discuss the advantages, limitations and potential of HiCH in remote health monitoring systems from both user and system perspectives. From the user perspective, enhancing Quality of Service (QoS) and Quality of Experience (QoE) are the main targets in HiCH. Cloud-based systems heavily depend on the connectivity between local devices and the server, and hence, binds the system functionality to the availability of Internet connection. HiCH, on the other hand, has no constraint on ubiquitous Internet connection due to local decision making and notification. Security is an essential issue in HiCH as well as in every health IoT application since failures could put lives at risk [50]. We consider our system security as three parts. a) Data transmission security from the sensor network to the fog: Most wireless transmission protocols are recently enabled to encrypt data during the transmission. Using Bluetooth protocol, communication starts with pairing, and subsequently encrypted data is transmitted. In our case study, RN-42 Bluetooth module transfers data using 128-bit AES-CCM encryption [24]. b) Data transmission security from the fog to the cloud: In WiFi and LAN networks, data is encrypted in a higher level using Secure Sockets Layer (SSL) connection as used in our case study. c) Data storage security on the fog and the cloud: An attribute-based encryption (ABE) algorithm provides several data access levels for stored data in fog and the cloud. It has been shown that the ABE algorithm is feasible in IoT applications to hold multi-level data access as well as privacy [4]. Moreover, an end-to-end secure framework for Fog-enabled IoT-systems has been recently introduced to enable efficient authentication and authorization while complex security algorithms perform at the edge [48]. Fully local computing systems are bounded to their processing power and data storage, so sensitivity and specificity of these systems are compromised compared to cloud-based systems. In contrast, HiCH copes with this issue by moving the training phase to the cloud and periodically updating local decision makers. This enables the remote servers to form personalized models and leverage patient medical history in the model building. Moreover, system response time is reduced in HiCH particularly in case of poor connectivity. This is advantageous to healthcare providers since they can proactively react to possible health deterioration cases. It should be also noted that the processing power and storage capacity of fog devices play an important role in determining the efficiency of the HiCH as shown in our experiment. However, with the current trend of increasing processing power and storage of the edge devices, the significance of this concern is diminishing. Another possible limitation in HiCH is the choice of the learning algorithm. As we discussed in Section 3, some learning algorithms, such as instance-based learning, might not fit within this This article will be presented in the International Conference on Embedded Software 2017 and will appear as part of the ESWEEK-TECS special issue
1
I. Azimi et al.
system. Hence, in some cases, the accuracy of decisions in HiCH might not be as high as in cloudbased systems. This concern is mostly application-specific, and the range of HiCH-compatible algorithms that are widely used nowadays for machine learning is broad. Moreover, the closed-loop local control enables a dynamic and personalized resource management in systems where various configurations can be adjusted with respect to patient’s conditions. In this paper, we only concentrated on the traffic management between the fog to the cloud, however HiCH can be enriched to consider more holistic resource management. Our future work in this direction will consider personalized energy management to increase the sensors’ battery life. In addition to the healthcare domain, HiCH can be adapted to other domains, where reliability, punctuality and availability are important, for instance IoT-based home and environmental monitoring applications focusing on early-detection and preventive purposes [9, 31]. Examples are fire early-detection, environmental disaster prevention and home intrusion detection. Moreover, HiCH can be tailored for assistive IoT-based services (e.g., assisted living and assisted driving) targeting people with disability or frailty [12, 22]. 6
CONCLUSIONS
Considering the life critical nature of remote health monitoring systems, a high level of availability and accuracy is required. IoT-based solutions appear to be a viable scheme to deliver availability and accuracy. However, conventional centralized cloud-based IoT systems need uninterrupted Internet connectivity, which poses challenges in the face of mobility and/or degraded access to the Internet. On the other hand, fully distributed fog-based IoT systems support untethered operation but sacrifice accuracy due to the limited computation capacity at the edge. In this paper, we proposed a novel computing architecture, HiCH, for IoT-based health monitoring systems to leverage the benefits of fog and cloud computing paradigms. The two major contributions of HiCH are: 1) a hierarchical computing architecture for partitioning and execution of machine learning data analytics; 2) a closed-loop management technique enabled by autonomic system adjustment with respect to patient’s condition. We evaluated HiCH in comparison with a baseline IoT system and discussed the advantages and limitations of the proposed architecture in remote health monitoring systems. Finally, as a proof of concept, we demonstrated a full system implementation targeting continuous health monitoring for abnormal condition detection using ECG signals. ACKNOWLEDGMENTS We acknowledge financial support by the Marie Curie Actions of the European Union’s H2020 Programme. REFERENCES [1] Y. S. Abu-Mostafa et al. Learning From Data. AMLBook, 2012. [2] M. Al-Faruque and K. Vatanparvar. Energy Management-as-a-Service Over Fog Computing Platform. IEEE Internet of Things J., 3(2):161–9, 2015. [3] A. Al-Fuqaha et al. Internet of Things: A Survey on Enabling Technologies, Protocols, and Applications. IEEE Commun. Surveys & Tuts, 17(4):2347–76, 2015. [4] M. Ambrosin et al. On the Feasibility of Attribute-Based Encryption on Internet of Things Devices. IEEE Micro, 36(6):25–35, 2016. [5] A. Anzanpour et al. Context-aware early warning system for in-home healthcare using internet-of-things. In LNICST, 2015. [6] A. Anzanpour et al. Self-Awareness in Remote Health Monitoring Systems using Wearable Electronics. In DATE Conf., 2017. [7] F. Arriba-P`erez et al. Collection and Processing of Data from Wrist Wearable Devices in Heterogeneous and MultipleUser Scenarios. Sensors (Basel), 16(9), 2016. [8] ATMEL. Atmega328p, Retrieved on March 2017. www.atmel.com/devices/atmega328p.aspx. This article will be presented in the International Conference on Embedded Software 2017 and will appear as part of the ESWEEK-TECS special issue
HiCH: Hierarchical Fog-assisted Computing Architecture for Healthcare IoT
1
[9] L. Atzori et al. The internet of things: A survey. Computer Networks, 54(15):2787–805, 2010. [10] D. Azariadi et al. ECG signal analysis and arrhythmia detection on IoT wearable medical devices. In MOCAST, 2016. [11] I. Azimi et al. Self-aware early warning score system for iot-based personalized healthcare. In LNICST, volume 181, 2016. [12] I. Azimi et al. Internet of things for remote elderly monitoring: a study from user-centered perspective. JAIHC, 8(2):273–89, 2017. [13] M. Beyer. Gartner says solving ’Big Data’ challenge involves more than just managing volumes of data, Retrieved on March 2017. www.gartner.com/newsroom/id/1731916. [14] F. Bonomi et al. Fog computing and its role in the internet of things. MCC’12, pages 13 – 16, 2012. [15] F. Bonomi et al. Fog computing: A platform for internet of things and analytics. Big Data and Internet of Things: A Roadmap for Smart Environments, 546:169 – 86, 2014. [16] A. Botta et al. Integration of Cloud computing and Internet of Things: A survey. FGCS, 56:684–700, 2016. [17] C. Byers and W. Patrick. Fog Computing Distributing Data and Intelligence for Resiliency and Scale Necessary for IoT: The Internet of Things (Ubiquity Symposium). Ubiquity, pages 1–12, 2015. [18] L. Catarinucci et al. An IoT-Aware Architecture for Smart Healthcare Systems. IEEE Internet of Things J., 2(6):515–26, 2015. [19] R. Craciunescu et al. Implementation of Fog computing for reliable E-health applications. In 49th Asilomar Conference on Signals, Systems and Computers, 2015. [20] R. Deng et al. Optimal Workload Allocation in Fog-Cloud Computing Toward Balanced Delay and Power Consumption. IEEE Internet of Things J., 3(6):1171–81, 2016. [21] A. Dohr et al. The Internet of Things for Ambient Assisted Living. In ITNG, 2010. [22] M. Domingo. An overview of the Internet of Things for people with disabilities. JNCA, 35(2):584–96, 2012. [23] H. Dubey et al. Fog Data: Enhancing Telehealth Big Data Through Fog Computing. In ASE BD&SI ’15, 2015. [24] M. Dworkin. Recommendation for block cipher modes of operation: the ccm mode for authentication and confidentiality. Technical report, NIST 800-38C, 2004. [25] M. Fazio et al. Exploiting the FIWARE Cloud Platform to Develop a Remote Patient Monitoring System. In ISCC, 2015. [26] D. Gachet et al. Big Data Processing of Bio-signal Sensors Information for Self-Management of Health and Diseases. In IMIS, 2015. [27] M. Ghorbani and P. Bogdan. A cyber-physical system approach to artificial pancreas design. In CODES+ISSS, 2013. [28] A. M. Ghosh et al. Remote Health Monitoring System through IoT. In ICIEV, 2016. [29] A. L. Goldberger et al. PhysioBank, PhysioToolkit, and PhysioNet: Components of a new research resource for complex physiologic signals. Circulation, 101(23):e215–e220, 2000. [30] J. G`omez et al. Patient Monitoring System Based on Internet of Things. Procedia Computer Science, 83:90–7, 2016. [31] J. Gubbi et al. Internet of Things(IoT): A vision, architectural elements, and future directions. FGCS, 29(7):1645–60, 2013. [32] A. Gulenko et al. Evaluating machine learning algorithms for anomaly detection in clouds. In IEEE Int. Conf. on Big Data, 2016. [33] IBM Corporation. An architectural blueprint for autonomic computing. White paper, 2006. [34] Instituto de Telecomunicacoes. Biosppy 0.2.0: Python package index, Retrieved on March 2017. https://pypi.python. org/pypi/biosppy/0.2.0. [35] F. Jager et al. Long-term st database: a reference for the development and evaluation of automated ischaemia detectors and for the study of the dynamics of myocardial ischaemia. Medical & Biological Engineering & Computing, 41(2):172–183, 2003. www.physionet.org/physiobank/database/ltstdb/. [36] T. T. Khan et al. ECG feature extraction in temporal domain and detection of various heart conditions. In ICEEICT, 2015. [37] D. Laney. 3D Data Management: Controlling Data Volume, Velocity, and Variety. Technical report, META Group Inc., 2001. [38] E. Lee. Cyber Physical Systems: Design Challenges. In ISORC, pages 363–9, 2008. [39] Linode, Retrieved on March 2017. https://www.linode.com/. [40] Microchip. RN42 - Wireless - Bluetooth Module, Retrieved on March 2017. http://www.microchip.com/rn42. [41] J. Mohammed et al. Internet of Things: Remote Patient Monitoring Using Web Services and Cloud Computing. In CPSCom, 2014. [42] K. P. Murphy. Machine Learning: A Probabilistic Perspective. The MIT Press, 2012. [43] T. Nguyen-Gia et al. Fog Computing in Healthcare Internet of Things: A Case Study on ECG Feature Extraction. In CIT Conf., 2015. [44] Nvidia. Jetson tk-1, Retrieved on March 2017. www.nvidia.com/object/jetson-tk1-embedded-dev-kit.html.
This article will be presented in the International Conference on Embedded Software 2017 and will appear as part of the ESWEEK-TECS special issue
1
I. Azimi et al.
[45] C. O’Keeffe et al. Role of ambulance response times in the survival of patients with out-of-hospital cardiac arrest. Emerg Med J., 28(8):703–6, 2011. [46] F. Pedregosa et al. Scikit-learn: Machine learning in Python. Journal of Machine Learning Research, 12:2825–2830, 2011. [47] L. Pescosolido et al. An IoT-inspired cloud-based web service architecture for e-Health applications. In ISC2, 2016. [48] S. Rahimi-Moosavi et al. End-to-end security scheme for mobility enabled healthcare Internet of Things. FGCS, 64:108–24, 2016. [49] A. Rahmani et al. Fog Computing in the Internet of Things - Intelligence at the Edge. Springer, 2017. [50] A. M. Rahmani et al. Exploiting smart e-health gateways at the edge of healthcare internet-of-things: A fog computing approach. FGCS, 2017. [51] Raspberry Pi Foundation. Raspberry pi zero, Retrieved on March 2017. www.raspberrypi.org/blog/raspberry-pi-zero/. [52] E. Span`o et al. Low-Power Wearable ECG Monitoring System for Multiple-Patient Remote Monitoring. IEEE Sensors J., 16(13):5452–62, 2016. [53] TeleTracking. The value of time in healthcare. White paper, 2004. [54] F. Touati and R.Tabish. U-Healthcare System: State-of-the-Art Review and Challenges. J Med Syst, 37(3):9949, 2013. [55] L. M. Vaquero and L. Rodero-Merino. Finding Your Way in the Fog: Towards a Comprehensive Definition of Fog Computing. SIGCOMM Comput. Commun. Rev., 44(5):27–32, 2014. [56] WHO, World Heart Federation and World Stroke Organization. Global atlas on cardiovascular disease prevention and control. Technical report, 2011. [57] Y. Xue et al. A spatio-temporal fractal model for a CPS approach to brain-machine-body interfaces. In DATE, 2016. [58] S. Yi et al. A Survey of Fog Computing: Concepts, Applications and Issues. In Mobidata’15, pages 37–42, 2015.
This article will be presented in the International Conference on Embedded Software 2017 and will appear as part of the ESWEEK-TECS special issue