diagnostics to ensure fault-free operation and enables diagnostic capabilities for the various building systems by providing a distributed platform that is powerful ...
©2006, American Society of Heating, Refrigerating and Air-Conditioning Engineers, Inc. (www.ashrae.org). Published in HVAC&R Research, Vol. 12, No. 1, January 2006. For personal use only. Additional distribution in either paper or digital form is not permitted without ASHRAE’s permission.
VOLUME 12, NUMBER 1
HVAC&R RESEARCH
JANUARY 2006
A Hierarchical Rule-Based Fault Detection and Diagnostic Method for HVAC Systems Jeffrey Schein
Steven T. Bushby
Associate Member ASHRAE
Member ASHRAE
Received April 13, 2005; accepted August 15, 2005
A rule-based, system-level fault detection and diagnostic (FDD) method for HVAC systems was developed. It functions as an interface between multiple, equipment-specific FDD tools and a human operator. The method resolves and prioritizes conflicting fault reports from equipment-specific FDD tools, performs FDD at the system level, and presents an integrated view of an HVAC system’s fault status to an operator. A simulation study to test and evaluate the method was conducted.
INTRODUCTION Building HVAC equipment routinely fails to satisfy performance expectations envisioned at design. Such failures often go unnoticed for extended periods of time. Additionally, higher expectations are being placed on a combination of different and often conflicting performance measures, such as energy efficiency, indoor air quality, comfort, reliability, limiting peak demand on utilities, etc. To meet these expectations, the processes, systems, and equipment used in both commercial and residential buildings are becoming increasingly sophisticated, which inadvertently causes more problems. This development both necessitates the use of automated diagnostics to ensure fault-free operation and enables diagnostic capabilities for the various building systems by providing a distributed platform that is powerful and flexible enough to perform fault detection and diagnostics (FDD). Hyvärinen and Kärki (1996) and Dexter and Pakanen (2001) document a number of FDD tools that are emerging from research. Most of these tools are equipment-specific, meaning they are meant to detect faults in a chiller, air-handling unit (AHU), etc. A number of studies to field-test equipment-specific FDD tools shows the need for another tool to act as an interface between equipment-specific FDD tools and the building operator in order to resolve conflicting fault reports from the various equipment-specific FDD tools and to present an integrated view of the HVAC system’s fault status to the operator. House et al. (2001) document an AHU fault that was actually caused by the unavailability of the chilled water plant. Schein and House (2003) describe several cases of terminal unit faults caused by problems with the supply air temperature and pressure provided by the associated AHU, as well as numerous terminal unit and AHU faults, which were traced to scheduling inconsistencies between terminal units, AHUs, and the chilled water plant. The common thread in the previous examples is the set of hierarchical relationships between the different pieces of equipment composing the HVAC system. Each AHU delivers supply air to the terminal units it serves, the chilled water plant supplies chilled water to the AHUs, and the boiler plant provides hot water to the AHUs and some terminal units. These relationships are each characterized by a single “source” supplying multiple “loads.” In each case, there is an air Jeffrey Schein is a mechanical engineer and Steven T. Bushby is group leader, Mechanical Systems and Controls Group, National Institute of Standards and Technology, Gaithersburg, Md.
111
112
HVAC&R RESEARCH
or water fluid interface between the source and the loads. The temperature and pressure of the fluid are maintained at setpoint values by the source equipment in order to enable the load equipment to operate as intended. Normally, each AHU and the terminal units it serves form a separate, distinct hierarchy. However, the output of each of the chillers is aggregated to form a single chilled water plant, which then supplies chilled water to all the loads in the system. Similarly, the output of the boilers is aggregated to form a single boiler plant supplying all the hot water loads in the system. In order to present an integrated view of an HVAC system’s fault status to the operator, the system-level FDD method developed in this project uses these hierarchical relationships to act as a filter, resolving conflicting fault reports from equipment-specific FDD tools. Knowledge of these relationships, combined with access to some selected raw data, also allows the method to perform FDD at the system level. The method is intended to function as an overall framework to process fault reports and raw data, providing a single system-wide fault status report to the operator.
METHODOLOGY A number of different approaches to solve the problem of FDD integration and conflict resolution were considered. Bonarini and Sassaroli (1997) describe one possible approach in which a high-level structural model is used as a topological basis to link together models of each of the components of the mechanical system. Any of a number of different types of models could be used for the individual components of the system. One drawback of the model-based approach is the need for fault-free training data to tune the model. House et al. (2001) point out that it may be difficult to provide training data over the broad range of operating conditions for an HVAC system, which would make it difficult to develop a robust FDD method. Another drawback is the computational demand of a model-based solution, which requires that it run on a general-purpose computer. The embedded devices that make up the balance of the building automation system have limited available processor and memory capacity for model-based FDD analysis. In addition, the real-time operating systems that are used in embedded devices are not designed for the same flexibility of application as the general-purpose operating systems that are used in general-purpose computers. A model-based system-level FDD tool would require a computer connected to the building automation network, either an existing one that functions as an operator workstation or a computer/server dedicated to FDD. Another alternative under consideration was a case-based solution to conflict resolution similar to the one described by Ross et al. (2002). Briefly, a template is defined containing sufficient fields to describe the state of the HVAC system. Current data are entered into the template, and a database of historical cases is searched for the closest match to the current state. Several different algorithms can be used to determine which historical case is the best match. This approach, while less computationally demanding than the model-based approach, is essentially a database application and, as with the model-based solution, requires the processor, memory, and operating system of a general-purpose computer. This approach would require a large initial effort to develop a database containing examples of many different fault occurrences with different system types and operating and weather conditions. It would also be difficult to select an efficient set of search variables to ensure that the search accurately describes the current operational state and returns the correct historical case. Tzafestas (1989) explains that a rule-based approach has a number of advantages, including the transparency, flexibility, and adaptability obtained by expressing the knowledge base as a set of rules, explicitly separated from the decision-making framework. Visier et al. (1999) also refers to the adaptability of rule-based approaches, which can be modified by changing the rules to match the current system. Han et al. (1999) and Visier et al. (1999) both consider the transparency to the building operator as a major advantage of rule-based FDD. The rule-based approach was selected
VOLUME 12, NUMBER 1, JANUARY 2006
113
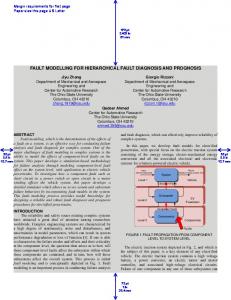
for these reasons, as well as its suitability for embedment in a supervisory controller. The most desirable platform for system-level FDD is a supervisory controller, not the operator workstation, so that the FDD algorithm can run in real-time and detect faults as they occur rather than processing logged data offline. This approach would also allow the FDD algorithm to be written in the manufacturer’s application programming language and executed as a component of the supervisory control logic. The results could then be reported to the building operator using the building automation system’s alarm/event-handling capability. Furthermore, there are many smaller building automation systems that do not have a local operator workstation but do have a supervisory controller. A supervisory controller has a faster, more powerful processor and more memory than a local equipment controller; however, it still has a real-time operating system and it must share its computing resources among scheduling, setpoint reset, alarm handling, trendlogging, and communication management/buffering applications as well as FDD. Only a rule-based system-level FDD method is consistent with embedment in a supervisory controller. The proposed system-level FDD tool consists of two components: a hierarchical decision-making framework and a set of rules. The decision-making framework collects fault reports and raw data from the local equipment controllers and sends them to the rule set for evaluation. The rules are used to determine whether to pass any fault reports on to a human operator. Figure 1 is a schematic illustration of the framework. The fundamental methodology consists of four general principles for integrating equipment-specific fault reports and resolving conflicts given the source-load hierarchical relationships between the different pieces of equipment and subsystems in an HVAC system: 1. Fault reports from a load are suppressed if there are any fault reports from a source serving that load.
Figure 1. The hierarchical decision-making framework.
114
HVAC&R RESEARCH
2. A scheduling conflict between a source and any of the loads it serves is considered a fault associated with the source. Any fault reports from any of the loads served by the faulty source are suppressed. 3. A fault in the air or water fluid interface between a source and the loads it serves is considered a fault associated with the source. Any fault reports from any of the loads served by the faulty source are suppressed. 4. Multiple fault reports from the loads served by a source are considered a fault associated with the source. Any fault reports from any of the loads served by the faulty source are suppressed. In some cases, there may be unrelated faults in both source and load equipment; however, the methodology presented in this paper will cause any faults in the load equipment to be suppressed even if they are independent of the fault in the source equipment. Although this outcome is technically incorrect, in practice building maintenance staff have limited resources and will generally choose to focus their resources first on equipment at a higher level in the hierarchy. For example, given unrelated faults in an AHU and a terminal unit served by the AHU, the terminal unit fault will be suppressed. Since the AHU fault would be repaired first even if both faults were reported to the operator, the methodology effectively prioritizes unrelated fault reports from equipment at different levels in the hierarchy. The rule set was generated by applying these general principles to the hierarchical subsystems in an HVAC system (see Table 1). A software implementation combining the hierarchical decision-making framework and the rule set was developed using the algorithm illustrated in Figure 2. To ensure quasi-steady-state conditions, the rule set is not evaluated during the first two hours after system start-up. The rule set is applicable to systems consisting of a boiler plant, a chiller plant, one or more AHUs that receive hot water from the boiler plant and chilled water from the chiller plant, and terminal units that all receive supply air from the AHUs and some of which may receive hot water from the boiler plant. The rule set could easily be modified for systems that employ staged heating or cooling directly at the AHU rather than a central boiler or chiller plant by eliminating the rules referring to the boiler or chiller plant, respectively. To adapt the rule set for single-zone AHUs, the rules referring to terminal units should be eliminated. A fault threshold expresses the severity of a fault required to trigger an alarm and is necessary because of uncertainty in the data and operating conditions. If a threshold is too low, normal variation in the data and operating conditions may trigger false alarms, which may, in turn, cause the suppression of real fault reports from other equipment in the hierarchy. If a threshold is too high, only the most severe faults will be detected. Less severe faults affecting equipment lower in the hierarchy may result in fault reports from the affected equipment that should be suppressed. Effective values for the thresholds used in Rules 8 through 17 of Table 1 were determined through trial and error.
RESULTS AND DISCUSSION A dynamic simulation model of a three-story office building and its HVAC system was developed using the HVACSIM+ simulation tool (Park et al. 1985) and the Weather Year for Energy Calculations Version 2 data for Sterling, Virginia, from ASHRAE (1997). The simulation consists of nine zones, three air-handling units, a chiller, a cooling tower, and a boiler. The terminal units are pressure-independent variable-air-volume (VAV) boxes with hydronic reheat. Each of the three single-duct VAV AHUs serves the terminal units for three zones. The building shell and air-handling systems are represented by aggregating HVACSIM+ component models, which were developed by Haves and Norford (1997). The chiller and cooling tower models developed
VOLUME 12, NUMBER 1, JANUARY 2006
115
Table 1. Rule Set for Integrating Multiple Fault Reports Principle
Fault reports from a load are suppressed if there are any fault reports from a source serving that load.
Subsystem
Rule
Chiller plant
If there are any equipment-level chiller plant faults, pass them on to the operator, and suppress any AHU or terminal unit faults.
Boiler plant
If there are any equipment-level boiler plant faults, pass them on to the operator, and suppress any AHU or terminal unit faults.
AHU
If there are no chiller plant or boiler plant faults and there are any equipment-level AHU faults, pass them on to the operator, and suppress any fault reports from the terminal units served by the faulty AHU.
Terminal unit
If there are no chiller plant or boiler plant faults and there are no faults in the associated AHU, pass any equipment-level terminal unit faults on to the operator.
Chiller plant
If the chiller plant is off and any AHU is on and requires chilled water, report a chiller plant scheduling fault to the operator, and suppress any AHU or terminal unit faults.
A scheduling conflict between a source and any of the loads it Boiler plant serves is considered a fault associated with the source. Any fault reports from any of the loads served by the faulty source are suppressed. AHU
If the boiler plant is off and any AHU or terminal unit is on and requires hot water, report a boiler plant scheduling fault to the operator, and suppress any AHU or terminal unit faults. If there are no chiller plant or boiler plant faults and any AHU is off while any of the terminal units it serves is in occupied mode, report an AHU scheduling fault to the operator, and suppress any fault reports from the terminal units served by the faulty AHU.
Chiller plant
If the chilled water supply temperature is greater than its setpoint (subject to the given threshold), report a chiller plant supply temperature fault to the operator, and suppress any AHU or terminal unit faults.
Chiller plant
If the chilled water supply pressure is less than its setpoint (subject to the given threshold), report a chiller plant supply pressure fault to the operator, and suppress any AHU or terminal unit faults.
A fault in the interface Boiler plant between a source and the loads it serves is considered a fault associated with the source. Any fault reports from any of Boiler plant the loads served by the faulty source are suppressed.
If the hot water supply temperature is less than its setpoint (subject to the given threshold), report a boiler plant supply temperature fault to the operator, and suppress any AHU or terminal unit faults. If the hot water supply pressure is less than its setpoint (subject to the given threshold), report a boiler plant supply pressure fault to the operator, and suppress any AHU or terminal unit faults.
AHU
If there are no chiller plant or boiler plant faults and the AHU supply air temperature is greater than its setpoint (subject to the given threshold), report an AHU supply air temperature fault to the operator, and suppress any fault reports from the terminal units served by the faulty AHU.
AHU
If there are no chiller plant or boiler plant faults and the AHU supply air pressure is less than its setpoint (subject to the given threshold), report an AHU supply air pressure fault to the operator, and suppress any fault reports from the terminal units served by the faulty AHU.
Chiller plant
If the number of AHUs reporting faults possibly related to the chiller plant is greater than the threshold and the chiller plant is on, report a possible chiller plant fault to the operator, and suppress any AHU or terminal unit faults.
Multiple fault reports from the Boiler plant loads served by a source are considered a fault associated with the source. Any fault reports from any of the loads Boiler plant served by the faulty source are suppressed. AHU
If the number of AHUs reporting faults possibly related to the boiler plant is greater than the threshold and the boiler plant is on, report a possible boiler plant fault to the operator, and suppress any AHU or terminal unit faults. If the number of terminal units with heating coils reporting faults possibly related to the boiler plant is greater than the threshold and the boiler plant is on, report a possible boiler plant fault to the operator, and suppress any AHU or terminal unit faults. If there are no chiller plant or boiler plant faults and the set of terminal units served by any particular AHU reports a number of faults greater than the threshold, report a possible AHU fault to the operator, and suppress any fault reports from the terminal units served by the faulty AHU.
116
Figure 2. Flow chart of hierarchical FDD algorithm.
HVAC&R RESEARCH
VOLUME 12, NUMBER 1, JANUARY 2006
117
by Kohonen et al. (1993) as well as the boiler model developed by Wang (1992) were also adapted from previous work. The relatively severe faults selected for this study were chosen to maximize their impact on multiple pieces of equipment in order to have a more meaningful test of the hierarchical FDD tool. The faults, listed in Table 2, were simulated through modifications to the boundary conditions or component models. Table 2. List of HVAC System and Equipment Faults Fault #
Fault Description
Implementation
0
Fault free
Run the simulation without modification.
1
AHU scheduling fault
Schedule zone 1 ON during the unoccupied periods.
2
VAV box reheat coil valve stuck nearly closed
Fix the zone 1 reheat coil valve position to 5% open.
3
VAV box reheat coil valve stuck nearly open
Fix the zone 1 reheat coil valve position to 95% open.
4
VAV box discharge air temperature (DAT) sensor fault
Fix the zone 1 DAT sensor output to −10°C (14°F).
5
Chiller plant scheduling fault
Schedule AHU-1 and its associated VAV boxes (zones 1, 4, and 7) ON during the unoccupied periods.
6
AHU supply air pressure setpoint fault Set the AHU-1 supply air pressure setpoint to 0.01 kPa (0.04 in. w.g.).
7
AHU supply air pressure sensor fault Fix the AHU-1 supply air pressure sensor output to −5.00 kPa (–20.0 in. w.g.).
8
AHU supply fan failure
9
AHU supply air temperature setpoint Change the AHU-1 supply air temperature setpoint to too low 5°C (41°F).
10
AHU supply air temperature sensor drift
Increase the AHU-1 supply air temperature sensor offset calibration parameter by +5°C (+9°F).
11
AHU return air temperature sensor failure
Fix the AHU-1 return air temperature sensor output to −10°C (14°F).
12
AHU mixed air temperature sensor failure
Fix the AHU-1 mixed air temperature sensor output to −10°C (14°F).
13
AHU outdoor air temperature sensor failure
Fix the AHU-1 outdoor air temperature sensor output to −20°C (–4°F).
14
AHU heating coil valve stuck nearly open
Fix the AHU-1 heating coil valve position to 95% open.
15
AHU cooling coil valve stuck nearly open
Fix the AHU-1 cooling coil valve position to 95% open.
16
Chilled water supply temperature setpoint fault
Change the chilled water supply temperature setpoint to 20°C (68°F).
17
Chilled water supply temperature fault Fix the chilled water supply temperature to 20°C (68°F).
18
Hot water supply temperature setpoint Change the hot water supply temperature setpoint to fault 20°C (68°F).
19
Hot water supply temperature fault
Fix the AHU-1 supply fan speed to zero.
Fix the hot water supply temperature to 20°C (68°F).
118
HVAC&R RESEARCH
The simulation study consisted of a one-week simulation run for 20 different fault conditions during each of three seasons: heating season (using February weather data), swing season (using October weather data), and cooling season (using July weather data). The simulation output data files were then used as input data for the software implementation of the hierarchical FDD tool. The software implementation also included equipment-specific AHU and VAV box FDD tools known as AHU Performance Assessment Rules (APAR) and VAV Box Performance Assessment Control Charts (VPACC). APAR, developed by House et al. (2001), classifies the mode of operation based on the positions of the heating coil valve, cooling coil valve, and mixing box damper. APAR then evaluates a set of rules specific to that mode. VPACC (Schein and House 2003) applies cumulative sum charts from statistical process control to a small number of VAV box process errors. The results from simulation testing are summarized in Table 3; for more details see Schein and Bushby (2005). The result of an equipment-specific FDD tool consists of a fault status, either faulty or fault-free, and, if faulty, one or more possible causes. Since the hierarchical FDD Table 3. Results From Simulation1 Correct Source of Fault Identified? Fault #
Fault Description
Cooling Season
Heating Season
Swing Season
0
Fault free
X
X
X
1
AHU scheduling fault
X
X
X
2
VAV box reheat coil valve stuck nearly closed
X
X
X
3
VAV box reheat coil valve stuck nearly open
X
X
X
4
VAV box discharge air temperature sensor fault
X
X
X
5
Chiller plant scheduling fault
X
X
X
6
AHU supply air pressure setpoint fault
X
X
–
7
AHU supply air pressure sensor fault
X
X
X
8
AHU supply fan failure
X
X
X
9
AHU supply air temperature setpoint too low
X
X
X
10
AHU supply air temperature sensor drift
X
X
X
11
AHU return air temperature sensor failure
X
X
X
12
AHU mixed air temperature sensor failure
X
X
X
13
AHU outdoor air temperature sensor failure
X
X
X
14
AHU heating coil valve stuck nearly open
X
X
X
15
AHU cooling coil valve stuck nearly open
X
X
X
16
Chilled water supply temperature setpoint fault
X
–
X
17
Chilled water supply temperature fault
X
X
X
18
Hot water supply temperature setpoint fault
X
–
X
19
Hot water supply temperature fault
X
X
X
1 An “X”
indicates that the actual source of the fault was correctly identified by the hierarchical FDD algorithm. A “−“indicates that the source of the fault was not correctly identified by the hierarchical FDD algorithm.
VOLUME 12, NUMBER 1, JANUARY 2006
119
tool that is the subject of this study processes fault reports and performs FDD analysis on raw data from multiple pieces of equipment, the results take a somewhat different form from those for an equipment-specific FDD tool. The output from the hierarchical FDD tool consists of fault reports for one or more pieces of equipment. No possible causes are listed if the fault report was generated by the hierarchical FDD tool’s analysis of raw data; however, if the fault report was generated by an equipment-specific FDD tool, a list of causes will be passed on, if one is provided by the equipment-specific tool. The fault reports are further classified as primary and secondary diagnoses. The primary diagnosis is defined as the piece of equipment for which the most fault reports are generated for that run. Any other pieces of equipment for which fault reports are generated are secondary diagnoses. Of a total of 60 simulation runs, 49 indicated the actual source of the fault as the primary diagnosis. In addition to three fault-free cases, there were five simulation runs in which the fault had no impact on system operation—in all eight of these cases, the hierarchical FDD tool correctly reported no alarms. In one case, the primary diagnosis was incorrect, but the actual source of the fault was a secondary diagnosis. There were two cases in which the actual source of the fault was neither a primary nor a secondary diagnosis. Combining the 49 correct primary diagnoses with the eight correct nonfault cases, the hierarchical FDD tool provided a correct primary response 95% of the time.
Example 1: AHU Supply Air Temperature Setpoint Too Low The heating season simulation of fault 9 illustrates the principle that fault reports from a load are suppressed if there are any fault reports from a source serving that load. In the fault-free simulation, the supply air temperature setpoint is reset based on the maximum of the zone temperatures of the spaces served by the AHU. In cooling or economizing modes, if the maximum of the zone temperatures is less than or equal to 15°C (59°F), the supply air temperature setpoint is set at 24°C (75°F). As the maximum zone temperature increases, the setpoint decreases linearly until it reaches 10°C (50°F) at a maximum zone temperature of 27°C (81°F). If the maximum zone temperature is greater than or equal to 27°C (75°F), the supply air temperature setpoint is set at 10°C (50°F). The reset schedule is the same in heating mode, except that the minimum of the zone temperatures of the spaces served by the AHU is used instead of the maximum. The fault was implemented by replacing the supply air temperature reset schedule for AHU-1 with a fixed value of 5°C (41°F), which is less than the 10°C (50°F) minimum value in the reset schedule. Figure 3 shows the results from the occupied period of one day of the simulation. On this day, the supply air temperature could only be maintained at the new setpoint by keeping the cooling coil valve fully open for the entire day. This condition was detected as a fault by the equipment-specific AHU FDD, which generated an alarm and sent it to the hierarchical FDD tool. Figure 4 shows the effect of fault 9 on zone 4 (one of the zones served by AHU-1) for the same time period as in Figure 3. Since there was a heating load on the zone, the VAV box damper closed as far as possible given its minimum airflow requirement, while the reheat coil valve opened fully. The air supplied to the VAV box by AHU-1 was so cold that even with the minimum airflow and maximum reheat, the zone temperature remained below the heating setpoint. Due to the low zone temperature, the equipment-specific VAV box FDD generated an alarm and sent it to the hierarchical FDD tool. The hierarchical FDD tool received the fault reports from both AHU-1 and zone 4. Rule 3 states that if there are any equipment-level AHU faults, they are passed on to the operator, and any fault reports from the terminal units served by the faulty AHU are suppressed. In accordance with rule 3, the ahu-1 fault report was correctly passed on to the operator, while the zone 4 fault report was correctly suppressed.
120
HVAC&R RESEARCH
Figure 3. AHU supply air temperature too low (heating season). AHU-1 temperature and control signal data.
Figure 4. AHU supply air temperature too low (heating season). Zone 4 temperature and control signal data.
VOLUME 12, NUMBER 1, JANUARY 2006
121
Figure 5. Chilled water supply temperature (swing season). AHU-3 temperature and control signal data.
Example 2: Chilled Water Supply Temperature Fault Fault 17, the chilled water supply temperature fault, provides an example of the principle that a fault in the air or water interface between a source and the loads it serves is considered a fault associated with the source. The fault was implemented by fixing the chilled water supply temperature in the simulation model to a constant value of 20°C (68°) (the setpoint is 6°C [43°F]). There was no equipment-specific chilled water plant FDD tool in this study, so no fault report was sent to the hierarchical FDD tool. Chilled water is supplied from the central plant to AHU-1, AHU-2, and AHU-3. Figure 5 shows the effect of this fault on AHU-3 from the occupied period of one day of the simulation; the results for AHU-1 and AHU-2 are similar. The AHU control logic modulates the cooling coil control valve to maintain the supply air temperature at its setpoint. Because the chilled water supplied to the AHU cooling coil was too warm, the cooling coil valve saturated at 100% open, while the supply air temperature remained well above its setpoint. The equipment-specific AHU FDD tool detected the presence of a fault and sent a fault report to the hierarchical FDD tool. The cascading effects of the fault can also be seen in the VAV boxes that are supplied with conditioned air from the AHUs. Results for zone 3 are shown in Figure 6 (same time period as Figure 5); the results are typical for six of the nine zones in the simulation. The supply air temperature was too warm to maintain the zone air temperature at the cooling setpoint. The equipment-specific VAV box FDD generated a fault report and sent it to the hierarchical FDD tool. Rule 8 implements the principle that a fault in the air or water interface between a source and the loads it serves is considered a fault associated with the source, specifically for the chiller
122
HVAC&R RESEARCH
Figure 6. Chilled water supply temperature fault (swing season). Zone 3 temperature data.
plant-AHU relationship. The rule states that if the chilled water supply temperature is greater than its setpoint by more than a threshold amount, then a chilled water plant fault is reported and any AHU or terminal unit fault reports are suppressed. In this case, the difference between the chilled water supply temperature and the setpoint was greater than the threshold value (10°C [50°F]), so a chilled water plant fault was correctly reported, while at the same time the AHU and VAV box fault reports were correctly suppressed.
Example 3: AHU Supply Air Pressure Setpoint Too Low Fault 6, the AHU supply air pressure fault, provides an example of the principle that multiple fault reports from the loads served by a source are a fault associated with the source. The fault was implemented in the simulation by changing the AHU-1 supply air pressure setpoint from 0.25 kPa to 0.01 kPa (1.0 to 0.04 in. w.g.). The AHU control logic simply modulates the supply fan speed to maintain the supply air pressure at the setpoint, so no fault was detected by the equipment-specific AHU FDD tool. The effect of this fault on zone 1 (one of the zones served by AHU-1) for the occupied period of one day of the simulation is shown in Figures 7 and 8. The effects on zones 4 and 7 (the other zones served by AHU-1) are similar. When occupancy began, the cooling load, zone temperature, and airflow setpoint all increased. Figure 7 shows that, because the supply air pressure was too low, the actual airflow fell well below the airflow setpoint while the VAV box damper saturated fully open. Figure 8 shows that, as a result, the zone temperature rose above the cooling setpoint. The equipment-specific VAV box FDD tool generated fault reports due to the difference between the zone airflow rate and setpoint as well as the difference between the zone temperature and the cooling setpoint.
VOLUME 12, NUMBER 1, JANUARY 2006
123
Figure 7. AHU supply air pressure setpoint fault (cooling season). Zone 1 airflow and control signal data.
Figure 8. AHU supply air pressure setpoint fault (cooling season). Zone 1 temperature data.
124
HVAC&R RESEARCH
In order for the hierarchical FDD tool to interpret multiple VAV box faults as an AHU fault, the VAV box faults must occur simultaneously. Specifically in the case of this study, at least two of the three zones must report faults simultaneously for an AHU fault report to be generated. In general, the equipment-specific FDD tools for each of the VAV boxes will not report faults at exactly the same time, so some false alarms are to be expected. For example, for the day shown in Figures 7 and 8, the zone 4 VAV box FDD tool reported a fault from 15:10 until 17:00 (the end of occupancy) while zone 4 reported a fault from 15:25 until 17:00 and zone 7 reported a fault from 15:30 until 17:00. From 15:10 until 15:25, there was only one VAV box reporting a fault, so the incorrect VAV box fault report was passed on by the hierarchical FDD tool. From 15:25 until 17:00, there were at least two VAV boxes reporting faults, so the hierarchical FDD tool correctly suppressed the VAV box fault report and generated an AHU fault report. Since this was, by far, the larger time period, the primary diagnosis for this day of the simulation was the correct AHU fault.
CONCLUSIONS A system-level hierarchical FDD tool was developed and a simulation study to test and evaluate the tool was conducted. In general, the results were positive: the tool’s primary diagnosis was correct for 57 of 60 simulation runs (95%). The hierarchical FDD tool was shown to effectively filter equipment-level fault reports and detect and diagnose system-level faults. The tool shows promise as an overall framework to process fault reports and raw data and present a single integrated system-wide fault status report to the operator. The results from the simulation study, while promising, suggest some refinements to the hierarchical FDD tool, particularly the ability to infer a higher-level fault from multiple lower-level fault reports that occur close to the same time but are not simultaneous. Also, the tool should be evaluated and improved, using faults that are less severe than those considered in this study but that still impact multiple pieces of equipment. Robust threshold values should be determined using data from several field sites, to enable the detection of less severe faults without generating or passing on incorrect fault reports. Another enhancement might be the ability to handle multiple, unrelated faults that may cause the hierarchical FDD tool to suppress real fault reports from lower levels in the hierarchy while correctly reporting higher level faults.
ACKNOWLEDGMENT Thanks are due to Cheol Park of the National Institute of Standards and Technology for his assistance in developing and conducting the simulation.
REFERENCES ASHRAE. 1997. WYEC2 Data and Toolkit (CD-ROM). Atlanta: American Society of Heating, Refrigerating and Air-Conditioning Engineers, Inc. Bonarini, A., and P. Sassaroli. 1997. Opportunistic multimodel diagnosis with imperfect models. Information Sciences 103(1):161–185. Dexter A., and J. Pakanen, eds. 2001. International Energy Agency: Demonstrating Automated Fault Detection and Diagnosis in Real Buildings. Espoo, Finland: Technical Research Centre of Finland, Laboratory of Heating and Ventilation. Han, C.Y., Y. Xiao, and C.J. Ruther. 1999. Fault detection and diagnosis of HVAC systems. ASHRAE Trans. 105(1):568–578. Haves, P., and L.K. Norford. 1997. A standard simulation testbed for the evaluation of control algorithms and strategies. ASHRAE RP-825 Final Report. Atlanta: American Society of Heating, Refrigerating and Air Conditioning Engineers, Inc. House, J.M., H. Vaezi-Nejad, and J.M. Whitcomb. 2001. An expert rule set for fault detection in air-handling units. ASHRAE Trans. 107(1):858–871.
VOLUME 12, NUMBER 1, JANUARY 2006
125
Hyvärinen, J.S., and S. Kärki, eds. 1996. International Energy Agency Building Optimisation and Fault Diagnosis Source Book. Espoo, Finland: Technical Research Centre of Finland, Laboratory of Heating and Ventilation. Kohonen, R., S. Kärki, and J.S. Hyvärinen. 1993. Development of emulation methods. IEA Annex 17 Synthesis Report. Espoo, Finland: Technical Research Centre of Finland, Laboratory of Heating and Ventilation. Park, C., D.R. Clark, and G.E. Kelly. 1985. An overview of HVACSIM+, A dynamic building/HVAC/control systems simulation program. Proceedings of the 1st Annual Building Energy Simulation Conference, Seattle, WA, August 21–22. Ross, S., L. Fang, and K.W. Hipel. 2002. A case-based reasoning system for conflict resolution: Design and implementation. Engineering Applications of Artificial Intelligence 15(3):369–383. Schein, J., and J.M. House. 2003. Application of control charts for detecting faults in variable-air-volume boxes. ASHRAE Trans. 109(2):671–682. Schein, J., and S.T. Bushby. 2005. NISTIR 7216, A simulation study of a hierarchical, rule-based method for system-level fault detection and diagnostics in HVAC systems. National Institute of Standards and Technology, Gaithersburg, Md. Tzafestas, S.G. 1989. System fault diagnosis using the knowledge-based methodology. Fault Diagnosis in Dynamic Systems Theory and Applications, pp. 514–543. New York: Prentice Hall. Visier, J.C., H. Vaezi-Nejad, and P. Corrales. 1999. A fault detection tool for school buildings. ASHRAE Trans. 105(1):543–554. Wang, S. 1992. Emulation and simulation of building HVAC systems for evaluating the building energy management system. PhD dissertation, University of Liège, Belgium.