second line of defense to protect the network from security problem [27]. Machine ... hybrid machine learning paradigms to maximize detection accuracy and minimize ... algorithm to build an efficient anomaly based network intrusion detection ...
International Journal of Computer Applications (0975 – 8887) Volume 49– No.10, July 2012
A Hybrid Data Mining based Intrusion Detection System for Wireless Local Area Networks M.Moorthy
S.Sathiyabama
Professor, Department of MCA Muthayammal Engineering College, Rasipuram
PhD, Professor, Department of Computer Science Tiruvalluvar Govt. Arts College, Rasipuram ,
ABSTRACT The exponential growth in wireless network faults, vulnerabilities, and attacks make the WLAN security management a challenging research area [29]. Data mining applied to intrusion detection is an active area of research. The main reason for using data mining techniques for intrusion detection systems is due to the enormous volume of existing and newly appearing network data that require processing. Data mining follows anomaly based intrusion detection. The drawback of the anomaly based intrusion detection in a wireless network is the high rate of false positive. This can be solved by a designing a hybrid intrusion detection system by connecting a misuse detection module to the anomaly detection module. In this paper, we propose to develop a hybrid intrusion detection system for wireless local area networks, based on Fuzzy logic. In this Hybrid Intrusion Detection system, anomaly detection is performed using the Bayesian network technique and misuse detection is performed using the Support Vector Machine (SVM) technique. The overall decision of system is performed by the fuzzy logic. For anomaly detection using Bayesian network, each node has a monitoring agent and a classifier within it for its detection and a mobile agent for information collection. The anomaly is measured based on the naïve Bayesian technique. For misuse detection using SVM, all the data that lie within the hyper plane are considered to be normal whereas the data that lie outside the hyper plane are considered to be intrusive. The outputs of both anomaly detection and misuse detection modules are applied by the fuzzy decision rules to perform the final decision making. Hybrid detection system improves the detection performance by combining the advantages of the misuse and anomaly detection [33].
Keywords Intrusion Detection system (IDS), Wireless Local Area Network (WLAN), Support Vector Machine (SVM), Bayesian network, Monitoring agent.
1. INTRODUCTION 1.1 Wireless LAN A Wireless Local Area Network (WLAN) uses some wireless distribution method typically spread spectrum or OFDM for linking two or more devices and in the wider internet provides connection through access point. Due to this, along with the connection to the network, the users also obtain mobility to move around within a local coverage area. In wireless LAN or WLAN, also referred as LAWN for local area wireless network, mobile users use wireless (radio) connection to get connected to local area network, LAN (http://en.wikipedia.org/wiki/Wireless_LAN).
1.2 Intrusion Detection System Intrusion Detection is defined as the method of monitoring the proceedings taking place in a computer system or a network that are diverse from the usual activities of the system and hence detect it. An Intrusion Detection system (IDS) is a program that considers the happenings in the system during an execution and based on some unusual indications finds out if the system is misused. An IDS does not affect the use of the preventive mechanism in the system but in turn acts as the last defensive means in the system security [2]. In network security research, Intrusion Detection is a critical issue. The two basic approaches of intrusion detection are misuse detection and anomaly detection. Intrusion Detection System accumulates and inspects the data to be aware of the intrusions and mishandlings in the computer system and network. An intrusion detection system (IDS) is a security mechanism that can monitor and detect intrusions to the computer systems in real time [21]. Intrusion detection system (IDS) is the process of detecting and identifying unauthorized or unusual activity on the system [22, 23]. In recent years, intrusion detection has emerged as an important technique for network security. Data mining techniques have been applied as a new approach for intrusion detection [25]. Intrusion detection in fact is a classification task that classifies network traffics into normal usage category or attack category [26]. Intrusion Detection Systems (IDSs) is needed to be the second line of defense to protect the network from security problem [27]. Machine learning is regarded as an effective tool utilized by intrusion detection system (IDS) to detect abnormal activities from network traffic. In particular, neural networks, support vector machines (SVM) and decision trees are three significant and popular schemes borrowed from the machine learning community into intrusion detection in recent academic research [32]. The potential threats and attacks that can be caused by intrusions have been increased rapidly due to the dependence on network and internet connectivity [36].
1.3 Anomaly Based Intrusion Detection System Anomaly is any happening or entity that is eccentric, abnormal or special. It can also indicate an inconsistency or divergence from the preset rule or tendency. A normal behavior is modeled for anomaly detection. Any proceedings which contravene this model will be marked as suspicious. For example, a normal passive public web can be considered to give rise to worm infection if it tries to open connections to a large number of addresses [3].
19
International Journal of Computer Applications (0975 – 8887) Volume 49– No.10, July 2012 An Anomaly Based Intrusion Detection System is a system for finding the intrusions and misuse in the computer by monitoring the system activity and classifies the activities as normal or anomalous. This system will detect any type of misuse that falls out of the normal system operation since the classification is completely based on rules or heuristics, rather than patterns or signatures (http://en.wikipedia.org/wiki/Wireless_LAN). Anomaly-based detection methods have received an increasing interest by scientific community in the last years [24]. Anomaly based detection system seeks deviations from the learned model of normal behavior [28]. An anomaly based IDS analyze the ongoing traffic, activity, transactions or behaviors for detecting anomalies in the system or the network which may be indicative of any attack. In recent years, data mining - based intrusion detection systems (IDSs) have demonstrated high accuracy, good generalization to novel types of intrusion, and robust behavior in a changing environment [34]. An Intrusion Detection System (IDS) is a program that analyzes what happens or has happened during an execution and tries to find indications that the computer has been misused [40]. The development of anomaly detection techniques suitable for Wireless Sensor Networks (WSN) is regarded as an essential research area, which will enable WSNs to be much more secured and reliable [42].
1.4 Wireless Intrusion Detection System Monitoring and inspecting the activities of the user and system, identifying the patterns of the already known attacks, recognizing abnormal activities of the network and detecting any policy violations for WLANs, are the main objective of the wireless IDS. Wireless IDSs accumulate all information about all the local wireless transmissions and produce alerts based on the predefined signatures or anomalies in the traffic. Wireless Intrusion Detection Systems are constructed mainly to recognize attacks targeted on a 802.11 networks. [5].
1.5 Anomaly Based IDS on WLAN To assist in the defense and detection of the potential threats, WLAN employs solutions for security including anomaly based intrusion detection system by collecting and inspecting information related to the system for recognizing the wireless network intrusions [6]. A WLAN IDS should monitor for both network based attacks and wireless specific attacks. In case of WLANs, the sensors used in the wireless networks can be of the standalone device type to monitor the wireless traffic without forwarding the traffic. The type of anomalies detected by the WLAN are unauthorized WLANs and wireless devices, poorly secured WLAN devices, unusual usage patterns, wireless scanners war driving tools, DoS attacks, and man in the middle (MITM) attacks. The hybrid intrusion detection model combines the individual base classifiers and other hybrid machine learning paradigms to maximize detection accuracy and minimize computational complexity [41].
2. RELATED WORK Neveen I Ghali [2] used a new hybrid algorithm RSNNA (Rough Set Neural Network Algorithm) to significantly reduce a number of computer resources, both memory and CPU time, required to detect an attack. The algorithm uses Rough Set theory in order to select out feature reducts and a trained artificial neural network to identify any kind of new attaches. R. Nakkeeran et al [7] incorporated agents and data mining techniques to prevent anomaly intrusion in mobile adhoc
networks. Home agents present in each system collects the data from its own system and using data mining techniques to observed the local anomalies. The Mobile agents monitoring the neighboring nodes and collect the information from neighboring home agents to determine the correlation among the observed anomalous patterns before it will send the data. This system was able to stop all of the successful attacks in an adhoc networks and reduce the false alarm positives. Mrutyunjaya Panda et al [8] proposed a novel classification via sequential information bottleneck (sIB) clustering algorithm to build an efficient anomaly based network intrusion detection model. The proposed approach provides better detection accuracy with comparatively low false positive rate in comparison to other existing unsupervised clustering algorithms. This makes the approach suitable for building an efficient anomaly based network intrusion detection model. The drawback of this approach is that only limited data mining techniques are used, detection accuracy is not close tom100% and has high false positive rate. The future research will be to investigate other data mining techniques with a view to enhance the detection accuracy as close as possible to 100% while maintaining a low false positive rate. Qinglei Zhang et al [9] proposed a framework for a new approach in intrusion detection by combining two existing machine learning methods (i.e. SVM and CSOACN). The IDS based on the new algorithm can be applied as pure SVM, pure CSOACN or their combination by constructing the detection classifier under three different training modes respectively. The drawback is that the algorithm is not completely enhanced; training and testing speed is low. The future work is the enhancement of the algorithm in some aspects. For example, the training and testing speeds may be improved by applying the dimension reduction on the input data. More experiments on performance evaluation are also expected. M. Mehdi et al [10] proposed a new approach of an anomaly Intrusion detection system (IDS). It consists of building a reference behaviour model and the use of a Bayesian classification procedure associated to unsupervised learning algorithm to evaluate the deviation between current and reference behaviour. Continuous re-estimation of model parameters allows for real time operation. The use of recursive Log-likelihood and entropy estimation as a measure for monitoring model degradation related with behavior changes and the associated model update show that the accuracy of the event classification process is significantly improved using their proposed approach for reducing the missing alarm. These algorithms have some limitations such as that the kernel distributions are used to model numerical data with continuous and unbounded nature, the Gaussian parametrical model may not be suitable for complex data and that the use of mixed models assumes statistical independence between trials, which can be restrictive in some cases.
3. ANOMALY DETECTION BASED ON BAYESIAN NETWORK A new approach to detect and prevent the attacks in computer networks can be represented by the Bayesian Networks. The depiction of the causal dependencies between random variables in Bayesian Networks is given in graphical form. By specifying just a small set of probabilities concerning only to the neighbor nodes, the joint probability distribution of the random variables can be calculated. This set will have the information about the prior probabilities of all root nodes and conditional probabilities of all non root nodes provided with all possible combination of their direct predecessors. Bayesian Networks are the directed acyclic graph, (DAG) which contains arcs for representing the causal dependence between
20
International Journal of Computer Applications (0975 – 8887) Volume 49– No.10, July 2012 the parent and child allows the accumulation of the proofs when the values are known about some variables and if the proof is known then it provides a computational structure for finding the conditional values of the remaining random variables. Naives Bayes Classifier should be considered in detecting network
intrusions
due to its comparable
performance with multiple Bayesian classifiers approach. Moreover, time spent for building a NBC was less compared to others [30]. The advantages provided by the Bayesian Network are very significant and cannot be implemented by other technique. Event relations are not based on the expert knowledge but represent the mutual relations between events in the specified domain. In this technique, unnecessary communication and processing overload are prevented since the events used to estimate the probability of the attacks are inspected at the location of the network where it occurred. Hence, the problem of various control record mismatch does not arise. When calculating the influence of the newly produced events on the others, the advantage of the Bayesian Network is unique compared to other technique. Also, the data and rules from other systems can be converted into IDS based on Bayesian networks. In Bayesian networks, the platform used for execution does not affect the compatibility of the corresponding software products. Hence, the development and application of the standalone and distributed IDS can be speed up. Bayesian network can be considered as an important and central part of the system since, it provides us with the estimate of the probability that an attack is going on when the network is fed with the needed data [10]. For behavior modeling and Bayesian based detection, an anomaly IDS design with a parametric mixture can be used. Model parameter re-estimation should be performed to ensure continuous system update. For real time operations, algorithms for detection and update phases are designed. Hence, Bayesian technique can be used to perform anomaly intrusion detection. Our approach is entirely based on anomaly based method, which has been used to address security problems related to attacks in a wireless networks. It provides the three different techniques to provide suffice security solution to current node, Neighboring Node and Global networks. The following section outlines each module’s work in detail.
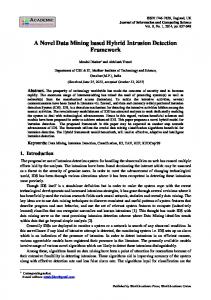
3.1. Monitoring agent Monitoring agent is a must in every system and its function is to collect information from application layer to the routing layer in its system. Our proposed system provides solution using three techniques. It monitors both, its own system as well as its environment local anomaly can be detected using a classifier construction.
Fig. 2: System Architecture When the node has to transfer information from node G to B, it will initiate by broadcasting a message to F and A. Prior sending the message, node G collects information about the neighboring nodes F and B using the mobile agent. It uses the classifier rule to detect the attacks using the test train data. The same type of solution is provided throughout the global networks. It has been explained in the following sections 1) Current node – Monitoring Agent present in the system, continuously monitors its own system. Current node calls the classifier construction to detect attacks whenever an attacker sends packet to collect information or broadcast through this system. In case of attacks, the respective system will be filtered out from the global networks. 2) Neighboring node – In the network, any system in order to transfer information to other system, broadcasts the information through intermediate system. Prior transferring the message, current node sends the mobile agent to the neighboring agent to collect all the information. After gathering the information, it returns back to the system and calls the classifier rules to detect the attacks. If no suspicious activity is detected, then the message will be forwarded to the neighboring node. 3) Data collection – Data collection module is used in every anomaly subsystem to gather feature values for corresponding layer in a system. The data collected during the normal scenario is saved as a profile. During the attack scenario, the attack data is collected. 4) Data preprocess – The audit data collected is stored in a file and smoothed so that it becomes suitable for anomaly detection. In Data preprocess, the information is processed with the test train data. For the entire layer anomaly detection systems, the above mentioned preprocessing technique is used [11].
3.2. Cross Feature Analysis for Classifier Sub Model Construction D {t1,, tn} where ti {ti1,, tih} and the training data D contains the following attributes { A1, A2,, An} and each attribute Ai 1)
Given
contains
Fig. 1: Outline of the System Architecture
a
training
the
data
following
attribute
values
{Ai1, Ai2,, Aih} . Also the training data D contains a set of classes C {C1, C 2,, Cm } . The probability P is
21
International Journal of Computer Applications (0975 – 8887) Volume 49– No.10, July 2012 calculated using the training data set using Naïve Bayesian classification algorithm. Naive Bayesian Algorithm used: Input: Training Data, D Output: Adaptive Intrusion Detection Model, AIDM
datasets Dij . Then again calculate the probabilities for each
Procedure: Step 1: Search the multiple copies of same example in D , if found then keeps only one unique example in D . Step 2: For each continuous attributes in D find the each adjacent pair of continuous attribute values that are not classified into the same class value for that continuous attribute. Step 3: Calculate the prior probabilities P(Cj ) and conditional probabilities P( Aij | Cj ) in D . Step 4: Classify all the training examples using these prior and conditional probabilities,
P(ei | c j )
P(c j )
k 1
p
P( Aij | C j )
(1) Step 5: Update the class value for each example in D with Maximum Likelihood (ML) of Posterior probability,
P(c j | ei);c j
c
P (c | e ) ML
i
j
i
(2) Step 6: Recalculate the prior
P( Aij | Cj )
P(Cj )
and conditional
D.
probabilities using updated class values in
Step 7: Again classify all training examples in D using updated probability values. Step 8: If any training examples in D is misclassified then calculate the information gain for each attributes Ai { A1, A2,, An} in D using equation Information Gain Where
( Ai) m
Info( D)
Info( D) Info(T )
freq(c j , D) |D|
j 1
log [
freq(c j , D)
2
|D|
] (3)
n
Info(T ) i 1
|T
i
|
|T |
inf (Ti)
(4) Step 9: Choose the best attribute Ai from D with the maximum information gain value. Step 10: Split dataset D into sub-datasets {D1, D2,, Dn} depending on the attribute values of
Ai .
Step 11: Calculate the prior
P( Aij | Cj )
P(Cj )
and conditional
probabilities of each sub-dataset Di .
Step 12: Classify the examples of each sub-dataset their respective prior and conditional probabilities. Step 13: If any example of any sub-dataset misclassified then again calculate the
information gain of attributes for that sub-dataset Di , and choose one of the best attribute Ai with maximum information gain, then split the sub-dataset Di into sub-sub-
Di
with
Di
is
sub-sub-dataset Dij . Also classify the examples in sub-sub datasets using their respective probabilities. Step 14: Continue this process until all the examples are correctly classified. Step 15: Preserved all the prior and conditional probabilities for each dataset for future classification of unseen examples [12]. 2) Compute the average probability for each data D , and save in a probability distribution matrix M . A decision threshold 0 is learned from the training data set. Normal profile is created using the threshold value. If the probability is greater than threshold value it is labeled as normal, otherwise it is labeled as abnormal. Anomaly detection Input: Preprocessed train data, preprocessed test data Output: Percentage of anomaly 1) Read processed data set file 2) Call Bayesian classifier program for training the classifier for anomaly detection 3) Read the test data file 4) Test the classifier model with the test data file 5) Print the confusion matrix to show the actual class vs predicted class 6) Percentage of anomaly is calculated as follows
P
n( PA) * 100 n(TT ) (5)
Where P : Percentage n(PA) : Number of predicted anomalies
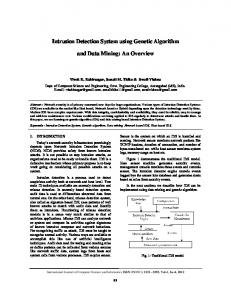
n(TT ) : Total number of traces 4. MISUSE DETECTION BASED ON SUPPORT VECTOR MACHINE The concept of misuse detection is to create a pattern or a signature form so that the attack is detected when repeated. Hence, the main limitation of the misuse detection is that, it cannot detect new types of attacks. The IDS maintains a pattern database consisting of the signature of the possible attacks. Misuse detection usually provides a low false positive rate [13]. SVM has been widely used for intrusion detection as a classical pattern recognition tool. Network Intrusion Detection using SVM is better than artificial neural network [31]. Support vector machine (SVM) is used for classification in IDS due to its good generalization ability and non linear classification using different kernel functions and performs well as compared to other classifiers [35]. There are three phases in the construction of the SVM intrusion detection systems. The first phase is the preprocessing phase, which processes the randomly selected raw TCP/IP dump data using automated parsers and converts it into machine readable form. The second phase is the training phase in which the SVMs are trained on different types of attacks and normal data. The data has a total of 41 input features and can be classified into two categories:
22
International Journal of Computer Applications (0975 – 8887) Volume 49– No.10, July 2012 normal (+1) and attack (-1). The SVM will be trained with both the type of data: normal as well as intrusive data. The final phase is the testing phase. This training phase involves measuring the performance of the data being tested. Theoretically, the SVMs are the learning machines which plot all the training vectors in high dimensional feature space and all the vectors are labeled according to their class. In SVMs the data is classified based on the support vectors that are the members of the training input set outlining a hyper plane in the feature space. The process of classifying the data into 2 classes involves dividing the data into normal and attack. The attack class in turn consists of 22 different types of attacks which can be grouped into four classes: DoS attack, unauthorized access from a remote machine, unauthorized access to a local super user privileges, or surveillance and other probing. The main objective of the SVMs is to separate the normal (1) and intrusive (-1) data. So, the SVMs are trained with both normal and intrusive patterns. Binary classification and regression are the primary advantages of SVMs which means the low expected probability of generalization errors along with other advantages. Speed is another important advantage in SVM since real time performance is very important. SVMs are highly scalable and are insensitive to number of data points. In SVM the classification complexity is independent of the dimensionality of the feature space. The final advantage is due to the dynamic nature of the attack patterns which allows the dynamic update of the training patterns by the SVMs [14]. Four measures adapted from information retrieval are used to evaluate the performance of an SVM model: Precision = A/ A B , = A/ A
Recall
C,
i
Where
n
R
( xi , y ),...,( xn , y ) are i
m
, y { 1, 1}
a training data, n is the
n
numbers of samples, m is the inputs vector, and y belongs to category of +1 or -1 respectively. On the problem of linear, a hyper plan can divided into the two categories. The hyper plan formula is:
(w. x) b
0
The category formula is:
if yi
1
( w.x) b if yi
1
Fig. 3: Hyper plane Of SVM [16] This process will involve a quadratic programming problem. Consider a hyper-plane defined by (w, b), where w is a weight vector and b is a bias. The classification of a new object x is done with N
f ( x) sign( w.x b) sign(
i i
y ( x .x ) i
i
b) (6)
The training vectors
False negative rate = C / A C , And False positive rate = B / B D . A, B, C, and D represent the number of detected intrusions, not intrusions but detected as intrusions, not detected intrusions, and not detected non-intrusions respectively. A false negative occurs when an intrusion action has occurred but the system considers it as a non-intrusive behavior. A false positive occurs when the system classifies an action as an intrusion while it is a legitimate action. Binary classification problems can be solved using SVM [4]. An SVM maps linear algorithms into non-linear space. It uses a feature called, kernel function, for this mapping. Kernel functions like polynomial, radial basis function are used to divide the feature space by constructing a hyper plane. The kernel functions can be used at the time of training of the classifiers which selects support vectors along the surface of this function. SVM classify data by using these support vectors that outline the hyper plane in the feature space [15]. A basic input data format and output data domains are listed as follows.
( xi , y ),....,( xn , y ), x
( w.x) b
xi occur only in the form of a
dot product. For each training point, there is a Lagrangian multiplier i . The Lagrangian multiplier values αi reflect the importance of each data point. When the maximal margin hyper-plane is found, only points that lie closest to the hyperplane will have
i
0
and these points are called support
vectors. All other points will have i 0 . That means only those points that lie closest to the hyper-plane, give the representation of the hypothesis/classifier. These data points serve as support vectors. Their values can be used to give an independent boundary with regard to the reliability of the hypothesis/classifier. Our proposed system, prepares for five types of labeled data. This data include four types of attacks and normal data. We use KDD CUP’99 intrusion detection data set (TCP dump data), which is most commonly used for evaluation. The data has 41 attributes for each connection record plus one class label. The data set contains 24 attack types, which are categorized into four types as follows: 1. Denial of Service (DOS): In this type of attack legitimate user is denied to access a machine by making some computing resources or memory full. For example TCP SYN, Back, etc. 2. Remote to User (R2L): In this type of attack remote user tries to gain local access as the user of the machine. For example FTP_write, Guest etc. 3. User to Root (U2R): In this type of attack the attacker tries to gain root access to the system. For example Eject, Fdformat etc. 4. Probing: In this type of attack attacker tries to scan a network of computer to fine known vulnerabilities or to gather information. For example Ipsweep, Mscan [14].
23
International Journal of Computer Applications (0975 – 8887) Volume 49– No.10, July 2012 We propose the algorithm for our IDS, as it gives better performance results for multiclass classification. The structure of the resulting SVM is determined by distance between two class patterns and the number of each class patterns. Let ni denote the number of ith class patterns xi , where i 1, 2,, k . The center point of class patterns is calculated using following equation:
ni
c
x n
i th
i m
m 1 i
i
(7) The Euclidian distance between ith class and jth class patterns is calculated as follows:
Ed
|| ci
ij
c
j
||
(8) The separability or the distribution of two class patterns is given by a distance equation as follows:
d
Ed
ij
ij i
j
(9) Where,
ni || m 1 i
i
x c || n m
i
i
Obviously
(i , j )
dij
(10) equals to dij . Find a pair
by calculating the distances of all pair wise classes,
xj is extreme. The five classes are denoted by a set { A, B, C , D, E} . The distance between Class A and E , dAE is biggest. In the pair ( A, H ) , let A be Class 1 and E be Class −1. Next, separate the rest three class patterns {B, C , D} into two classes (Class 1 or −1). Compare the distances dBA with dBE . The distance dBA dBE , so Class B is put into Class 1. Similarly, calculate the distances for C and D , where dCA dCE, dDA dDE . At last, compare the where the distance between
xi
and
number of patterns in Class 1and −1. At the end the five class patterns are divided into two subsets: { A, B, C} and {D, E} . Thus now the result will contain 2 classes; intrusive and normal.
5. DECISION MAKING BASED ON FUZZY LOGIC The two important reasons for the selection of fuzzy logic in solving the intrusion detection problem: first, involvement of many quantitative features in intrusive detection. SRI’s Nextgeneration Intrusion Detection Expert System (NIDES) divides the statistical measurement related to security into four kinds: ordinal, categorical, binary categorical and linear categorical. The measurements in the ordinal and linear categorical are quantitative features that can be viewed as fuzzy variables. The CPU usage time and the connection
duration are the two examples of the ordinal measurements. The number of the different TCP/UDP services initiated by the same source host is the example linear categorical measurement. The second reason for the use of fuzzy logic in solving the intrusion detection problem is because of the fuzziness in the security. An interval can be used to denote a normal value whenever the quantitative measurement is given and all the values falling outside the interval will be regarded to be anomalous irrespective of its distance to the interval. All the values within the interval will be considered as normal irrespective of its distance. The use of fuzziness smoothen the abrupt separation of normality and abnormality while representing the quantitative features. The measure of degree of normality and abnormality can also be provided by the use of fuzziness [17]. Our choice for using Fuzzy Logic was based on two main reasons: (1) No clear boundaries exist between normal and abnormal events, (2) fuzzy logic rules help in smoothing the abrupt separation of normality and abnormality (anomaly). A fuzzy set may be represented by a mathematical formulation known as a membership function. The normal and abnormal behaviors in networked computers are hard to predict, as the boundaries cannot be well defined [37]. Fuzzy logic has been originally proposed by Zadeh as a tool for dealing with linguistic uncertainty and vagueness ubiquitous in the imprecise meaning of words [38]. Fuzzy systems have demonstrated their ability to solve different kinds of problems in various applications domains [39]. A fuzzy-based inference mechanism is used to infer a soft boundary between anomalous and normal behaviour, which is otherwise very difficult to determine when they overlap or are very close [43]. Rule Definition: A fuzzy set A in X is characterized by a membership function which is easily implemented by fuzzy conditional statements. In the case of fuzzy statement if the antecedent is true to some degree of membership then the consequent is also true to that same degree. The rule structure: If antecedent then consequent. The rule: If variable1 is low and variable2 is high then output is benign else output is malignant. In a fuzzy classification system, a case or an object can be classified by applying a set of fuzzy rules based on the linguistic values of its attributes. Every rule has a weight, which is a number between 0 and 1 and this is applied to the number given by the antecedent. It involves 2 distinct parts. First the antecedent is evaluated, which involves fuzzifying the input and applying any necessary fuzzy operators and second applying that result to the consequent known as inference. To build a fuzzy classification system, the most difficult task is to find a set of fuzzy rules pertaining to the specific classification problem.. We explored three fuzzy rule generation methods for intrusion detection systems. 1. Rule generation based on the histogram of attribute values (FR1) 2. Rule generation based on partition of overlapping areas (FR2) 3. Neural learning of fuzzy rules (FR3) . When an attack is correctly classified, the grade of certainty is increased and when an attack is misclassified the grade of certainty is decreased. The fuzzy Logic in decision making uses the following technique: Let the two constraints to be considered be the output of anomaly detection, AD and misuse detection, MD. The possibilities of the two constraints are completely abnormal CA, slightly abnormal SA and completely normal CN.
24
International Journal of Computer Applications (0975 – 8887) Volume 49– No.10, July 2012 The first constraint, Anomaly detection can be represented in fuzzy set as AnomalyDetection = FuzzySet
[{CA, x},{SA, y},{CN , z}] Where x is the membership grade for Completely Abnormal output in Anomaly Detection
y
is the membership grade for Slightly Abnormal output in Anomaly Detection z is the membership grade for Completely Normal output in Anomaly Detection MisuseDetection= FuzzySet
[{CA, a},{SA, b},{CN , c}] Where a is the membership grade for Completely Abnormal output in Misuse Detection
b
is the membership grade for Slightly Abnormal output in Misuse Detection c is the membership grade for Completely Normal output in Misuse Detection The final decision is based on the output of the intersection of the corresponding members of the fuzzy sets of the two constraints; anomaly detection and misuse detection. The output with the highest membership grade will be considered as the result of the system. In our system, fuzzy logic is used for decision making based on input from Bayesian classifier system and Support Vector Machine. There are 3 output possibilities in our fuzzy system; normal, slightly abnormal and completely abnormal. Table.1 shows the conditions for decision making in fuzzy logic for inputs from Bayesian network and Support Vector Machine. The Figure.3 shows the block representation of the decision making in our fuzzy system. Table 1: Conditions for Decision Making in Fuzzy Logic Decision Bayesian Support Vector Making Network Machine based on the Output Output Fuzzy Logic Normal Normal Normal Normal
Abnormal
Abnormal
Normal
Abnormal
Abnormal
Slightly Abnormal Slightly Abnormal Completely Abnormal
The condition for making the decision follows an if-then rule where if the output of both the modules are normal without any attack or problem causing component, then the decision is made as normal output, if the output of one module is normal and the other module is abnormal then the decision made is slightly abnormal, if the output of both the modules is abnormal then the decision made is completely abnormal.
Fig 4: Decision Making Architecture The architecture for decision making shows the input data to be tested applied separately into anomaly detection module and misuse detection module. The anomaly detection is based on the Bayesian networks and the misuse detection is based on the Support Vector Machine technique. The output of both the module is then fuzzified and then applied to the decision making module. Here the decision is based on the conditions of fuzzy logic. The output from the decision making module is then defuzzified and provided as result. Let us consider an example with sets given AnomalyDetection = FuzzySet
[{CA, .5}, {SA, .7},{CN , .3}] We can see that possibility for SA has the highest membership function meaning that possibility SA is the most highly detected of the two possibilities. Possibility for CN on the other hand is the least detected, since it has a membership grade of only 0.3. The second constraint, Misuse detection can be represented in fuzzy set as MisuseDetection= FuzzySet
[{CA, .2}, {SA, .6},{CN , .7}] We can see that possibility for CN has the highest membership function meaning that the possibility CN is the most highly detected of the two possibilities. Possibility for CA on the other hand is the leas\t detected, since it has a membership grade of 0.2. (http://www.wolfram.com/products/applications /fuzzylogic/examples/job.html) Decision = MisuseDetection]
Intersection
[AnomalyDetection,
[{CA, .2}, {SA, .6},{CN , .3}]
FuzzySet We can plot the decision fuzzy set to see the results graphically, Fuzzyplot [Decision]
25
International Journal of Computer Applications (0975 – 8887) Volume 49– No.10, July 2012
6.2 Performance Metrics In our experiments, we measure the following metrics Received Bandwidth Packet Loss Misdetection False Positive Packet Delivery Ratio The simulation results are described in the next section. Fig. 5: Fuzzy Plot Fuzzyplot [Decision, Plotjoined
True]
6.3 Results A. Effect of Varying Rates We vary the attack traffic rate as 50,100,150,200 and 250kb.
Delivery ratio
Rate vs Delivery ratio 0.99 0.985 0.98 0.975 0.97 0.965
HIDS HF-IDS
50
100
150
200
250
Rate
Fig. 6: Continuous Fuzzy Plot Fig. 7: Rate Vs Delivery Ratio Rate vs Misdetect
Misdetect
Defuzzification of the fuzzified values can be performed by various ways like centroid average method, max centre method, mean of maxima, smallest of maximum and largest of maximum. In our case, we defuzzify using the maximum method (http://www.cse.msstate.edu/~bridges/ai/ Lecture12/sld034.htm). The result obtained in our case is SA, since it has the maximum membership grade. Hence, we find that Slightly Abnormal appears to be the best decision for the given constraint.
0.05 0.04 0.03 0.02 0.01 0
HIDS HF-IDS
50
100
6. SIMULATION RESULTS
Table 2: Simulation Parameters 100 1000 X 1000 802.11 250m 60 sec CBR,TCP 50 to 250kb/s 512 B 2,4,6,8 and 10
250
Rate vs Falsepositive 0.0008 0.0006
HIDS
0.0004
HF-IDS
0.0002 0 50
No. of Nodes Area Mac Radio Range Simulation Time Traffic Source Rate Packet Size Attackers
200
Fig. 8: Rate Vs Misdetect
Falsepositive
This section deals with the experimental performance evaluation of our algorithm through simulations. In order to test our protocol, the NS2 simulator [20] is used. We compare our proposed HF-IDS technique with the HIDS [9] technique. 6.1 Simulation Setup In the simulation, the number of nodes is kept as 100. The nodes are arranged in a 1000 meter x 1000 meter square region for 60 seconds of simulation time. All nodes have the same transmission range of 250 meters. The simulated traffic is TCP and Constant Bit Rate (CBR). The simulation settings and parameters are summarized in table 2.
150 Rate
100
150 200
250
Rate
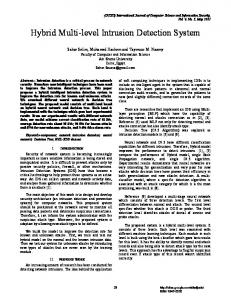
Fig. 9: Rate Vs False Positive Fig. 7 shows the delivery ratio of our HF-IDS technique and HIDS. From the figure, we can see that packet delivery ratio is more in HF-IDS scheme when compared with HIDS scheme. Fig. 8 shows the misdetection ratio of HF-IDS technique and HIDS. From the figure, we can see that the misdetection ratio is significantly less in our HF-IDS scheme when compared with HIDS scheme, since it accurately detects the intrusion.
26
International Journal of Computer Applications (0975 – 8887) Volume 49– No.10, July 2012 Fig. 9 shows the false positive rate of our HF-IDS technique and HIDS. From the figure, we can observe that our HF-IDS scheme attains low false positive rate, when compared with HIDS scheme, since it accurately detects the intrusion. B. Effect of Varying Attackers In our second experiment, we vary the number of attackers as 2, 4, 6 and 8 in order to calculate the received bandwidth and packet loss of legitimate users.
8. REFERENCES
Attackers Vs Bandwidth received
Bandwidth (Mb/s)
interpretation and the security of the system is represented in the fuzzy form since the degree of security is also fuzzy in nature. This hybrid technique is very scalable and accurate since incorrect interpretation is not possible due double check in this technique. Hence, hybrid technique of intrusion detection is very efficient to maintain security in the system. The future research will be to investigate other data mining techniques with a view to enhance detection rate as close as possible to 100%, with less false positive rate.
[1]
2.5 2 1.5
HF-IDS
1
HIDS
0.5
http://en.wikipedia.org/wiki/Wireless_LAN
[2] Neveen I. Ghali, “Feature Selection for Effective Anomaly-Based Intrusion Detection”, IJCSNS International Journal of Computer Science and Network Security, VOL.9 No.3, March 2009.
0 2
4
6
8
Attackers
Fig. 10: Attackers Vs Bandwidth
[3] Jatinder Singh, Dr. Lakhwinder Kaur and Dr. Savita Gupta, “Analysis of Intrusion Detection Tools for Wireless Local Area Networks” , IJCSNS International Journal of Computer Science and Network S 168 ecurity, Vol.9 No.7, July 2009. [4] http://www.windowsecurity.com/articles/What_You_Ne ed_to_Know_About_Intrusion_Detection_Systems.html [5] http://www.networkintrusion.co.uk/index.php/products/i ds-and-ips/wireless-ids.html [6] Shu Yun Lim and Andy Jones, “An Anomaly-based Intrusion Detection Architecture to Secure Wireless Networks”. [7] Qinglei Zhang and Wenying Feng, “Network Intrusion Detection by Support Vectors and Ant Colony” , ISBN 978-952-5726-06-0, Proceedings of the 2009 International Workshop on Information Security and Application (IWISA 2009), Qingdao, China, November 21-22, 2009.
Fig. 11: Attackers Vs Loss Fig. 10 gives the received bandwidth for normal legitimate users when varying the number of attackers. It shows that the bandwidth received for normal users is more in the case of HF-IDS when compared with HIDS. Fig. 11 illustrates that the packet loss due to attack is more in HIDS when compared with HF-IDS, when varying the number of attackers.
7. CONCLUSION In this paper, we have developed an efficient hybrid intrusion detection system using data mining algorithms to ensure security in the system from the attacks possible. In our hybrid intrusion detection system, a misuse detection module is connected to the anomaly detection module. The anomalous detection system is based on Bayesian technique and misuse detection system is based on SVM. The decision making system is based on fuzzy logic. This methodology of finding the intrusion in the system is suitable since both anomaly and misuse detection are separately performed and the overall system status is cross checked by the decision making module processed by the fuzzy technique. It prevents any erroneous
[8] Mrutyunjaya Panda and Manas Ranjan Patra, “A Novel Classification via Clustering Method for Anomaly Based Network Intrusion Detection System”, International Journal of Recent Trends in Engineering, Vol 2, No. 1, November 2009. [9] K.Q. Yan, S.C. Wang, C.W. Liu, “A Hybrid Intrusion Detection System of Cluster-based Wireless Sensor Networks” , Proceedings of the International MultiConference of Engineers and Computer Scientists 2009 Vol I, IMECS 2009, March 18 - 20, 2009, Hong Kong. [10] M. Mehdi, S. Zair, A. Anou and M. Bensebti, “A Bayesian Networks in Intrusion Detection Systems”, Journal of Computer Science 3 (5): 259-265, 2007, ISSN 1549-3636, © 2007 Science Publications. [11] R. Nakkeeran, T. Aruldoss Albert and R.Ezumalai, “Agent Based Efficient Anomaly Intrusion Detection System in Adhoc networks”, IACSIT International Journal of Engineering and Technology Vol. 2, No.1, February, 2010 ISSN: 1793-8236. [12] Dewan Md. Farid, Nouria Harbi, and Mohammad Zahidur Rahman, “Combining Naive Bayes And Decision Tree For Adaptive Intrusion Detection” ,
27
International Journal of Computer Applications (0975 – 8887) Volume 49– No.10, July 2012 International Journal of Network Security & Its Applications (IJNSA), Volume 2, Number 2, April 2010. [13] Rung-Ching Chen and Su-Ping Chen, “Intrusion Detection Using A Hybrid Support Vector Machine Based On Entropy And Tf-Idf”, International Journal of Innovative Computing, Information and Control, Volume 4, Number 2, February 2008, ICIC International °c 2008 ISSN 1349-4198. [14] Harley Kozushko, “Intrusion Detection: Host-Based and Network-Based Intrusion Detection Systems”, September 11, 2003 Independent Study [15] Snehal A. Mulay, P.R. Devale and G.V. Garje, “Intrusion Detection System Using Support Vector Machine and Decision Tree” , International Journal of Computer Applications (0975 – 8887) Volume 3 – No.3, June 2010. [16] Rung-Ching Chen, Kai-Fan Cheng and Chia-Fen Hsieh, “Using Rough Set and Support Vector Machine for Network Intrusion Detection”, International Journal of Network Security & Its Applications (IJNSA), Vol 1, No 1, April 2009. [17] Susan M. Bridges and Rayford B. Vaughn, “Intrusion Detection Via Fuzzy Data Mining”, Accepted for Presentation at The Twelfth Annual Canadian Information Technology Security Symposium June 1923, 2000, The Ottawa Congress Centre. [18]http://www.wolfram.com/products/applications/fuzzylogi c/examples/job.html [19]http://www.cse.msstate.edu/~bridges/ai/Lecture12/sld034. htm [20] Network Simulator, http://www.isi.edu/nsnam/ns [21] Jaydip Sen “An Agent-Based Intrusion Detection System for Local Area Networks.” in International Journal of Communication Networks and Information Security (IJCNIS) Vol. 2, No. 2, 2010 [22] Guanlin Chen, Hui Yao, Zebing Wang “An Intelligent WLAN Intrusion Prevention System Based on Signature Detection and Plan Recognition”, 2010 Second International Conference on Future Networks, pp. 168172, 2010. [23] Yujia Zhang, Guanlin Chen, Wenyong weng, Zebing Wang “ An Overview of Wireless Intrusion Prevention Systems”, 2010 Second International Conference on Communication System, Network and Applications, pp. 147-150, ICCSNA, 2010. [24] Torres.L.M at el.,”An anomaly-based intrusion detection system for IEEE 802.11 networks”, 2010, pages: 1-6 [25] Amudha. P et al., “Performance Analysis of Data Mining Approaches in Intrusion Detection”, PACC, (2011), page: 1-6 [26] P.Srinivasu et al., “Implementation of Fuzzy C-Means and Dempster-Shafer Theory for Anomaly Intrusion Detection”, IJCSNS (2011), Vol. 11 No. 9 pp. 39-46
[28] R. Sommer, V. Paxson, “Outside the Closed World: On Using Machine Learning For Network Intrusion Detection,” in Proc. of IEEE Symp. On Security and Privacy, Oakland, California, pp. 305-316, 2010 [29] Haddadi.F, Sarram M.A, 'Wireless intrusion detection system using lightweight agent', ICCNT (2010), pp. 8487 [30] Kok Chin Khor et al.,”Comparing Single and Multiple Bayesian Classifiers Approaches for Network Intrusion Detection”, ICCEA (2010), pages: 325-329 [31] Guan Xiao Qing et al., “Network intrusion detection method based on Agent and SVM”, ICIME (2010), china, pp. 399-402. [32] Yu-Xin Meng et al., “The practice on using machine learning for network anomaly intrusion detection”, ICMLC (2011), Volume-2, pp. 576-581 [33] Jiong Zhang et al., “Random-Forests-Based Network Intrusion Detection Systems “, IEEE SMC (2008) 38(5), pp. 649-659 [34] Chetan.R et al., “Data mining based network intrusion detection system: A database centric approach”, ICCCI (2012), pp. 1-6 [35] Noreen Kausar et al., “Communications in Computer and Information Science”, 253(1) pp. 24-34 [36] Reyadh Shaker Naoum et al., “An Enhanced Resilient Back propagation Artificial Neural Network for Intrusion Detection System”, IJCSNS (2012), Vol. 12 No. 3, pp. 11-16 [37] Jing zhong et al., “Intrusion detection using evolving fuzzy classifiers”, ITAIC (2011), pp. 119-122 [38] L. A. Zadeh, “Fuzzy Sets,” in Information and Control, vol. 8, pp. 338- 353, 1965. [39] Abadeh, M.S., Habibi, J., Lucas, C.,” Intrusion detection using a fuzzy genetics-based learning algorithm”, IJNA (2007), Volume 30, Issue 1, January 2007, Pages 414428 [40] Abraham, A., Jain, R., Thomas, J., Han, S.Y.,” D-SCIDS: Distributed soft computing intrusion detection system”, IJNA (2007), Volume 30, Issue 1, January 2007, Pages: 81-98 [41] Peddabachigari, S., Abraham, A., Grosan, C., Thomas, J.,” Modeling intrusion detection system using hybrid intelligent systems”, IJNA (2007), Volume 30, Issue 1, January 2007, Pages 114-132 [42] Miao Xie, Song Han, Biming Tian, Sazia Parvin, “Anomaly detection in wireless sensor networks: A survey”, IJNA (2011), Volume 34, Issue 4, July 2011, Pages 1302–1325 [43] Hoang, X.D., Hu, J., Bertok, P. ,” A program-based anomaly intrusion detection scheme using multiple detection engines and fuzzy inference”, IJNA (2009), Volume 32, Issue 6, November 2009, Pages 1219-1228
[27] S.Tamilarasan, Aramudan,” A Performance and Analysis of Misbehaving node in MANET using Intrusion Detection System”, IJCSNS (2011), Vol. 11 No. 5 pp. 258-264
28