Jun 2, 2015 - ... and Innovative Research (JETIR) www.jetir.org. 1869. Effective Intrusion Detection System using Data Mining Technique. Jaina Patel. 1.
June 2015, Volume 2, Issue 6
JETIR (ISSN-2349-5162)
Effective Intrusion Detection System using Data Mining Technique Jaina Patel1, Mr. Krunal Panchal2 1
P.G. Student, 2Assistant Professor, 1,2Computer Engineering Department, 1,2 L. J. Institute of Engineering and Technology, Ahmedabad, Gujarat, India Abstract— Network Security has become the key foundation with the tremendous increase in usage of network-based services and information sharing on networks. Intrusion poses a serious risk to the network security and compromise integrity, confidentiality & availability of the computer and network resources. Human classification of network audit data is expensive, time consuming and a tedious job. Intrusion Detection System (IDS) is one of the looms to detect attacks and anomalies in the network. Data mining technique has been widely applied in the network intrusion detection system by extracting useful knowledge from large number of network data. In this paper a hybrid model is proposed that integrates Anomaly based Intrusion detection technique with Signature based Intrusion detection technique is divided into two stages. In first stage, the signature based IDS SNORT is used to generate alerts for anomaly data. In second stage, data mining techniques “k-means + CART” is used to cascade k-means clustering and CART (Classification and Regression Trees) for classifying normal and abnormal activities. The hybrid IDS model is evaluated using KDD Cup Dataset. The proposed assemblage is introduced to maximize the effectiveness in identifying attacks and achieve high accuracy rate as well as low false alarm rate. Keywords- Anomaly Detection, Intrusion detection, data mining, k-means, CART, SNORT
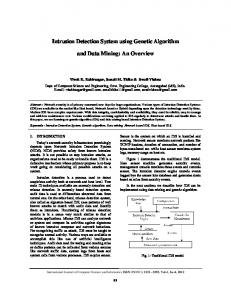
I. INTRODUCTION In recent years, with the tremendous growth in networked computer resources, a variety of network-based applications have been developed to provide services in different areas such as ecommerce services, social media services, banking services, government services, etc. The increase in the number of networked machines has lead to an increase in unauthorized activity, not only from external attacks, but also from internal attacks, such as people gaining unprivileged access for personal gain [4]. Intrusion detection system (IDS) detects unauthorized intrusions into computer systems and networks. Incidents may be malware attacks (such as worms, virus), attackers gaining unauthorized access to system through Internet or user of the system gaining unprivileged root access of the system for which they are not authorized. An IDS monitors network traffic of a computer system like a network sniffer and collects network log data. The collected network data is analyzed by intrusion detection model or technique for rule violations. When any rule violation is detected the IDS alerts the network administrator by raising alarm. Fig. 1.1 illustrates the overall architecture of Intrusion detection system.
Fig. 1: Overall architecture of Intrusion detection system 1.1 IDS Detection Methods 1.1.1 Signature-Based Detection Signature-based detection is the process of comparing signatures/patterns of known attack with the observed events to identify possible incidents. The most common form of signature based IDS used commercially specifies each pattern of events that corresponds to an attack as a separate signature. Advantages: Signature based detectors are very effective in detecting known attacks or threats that are predefined in the database of IDS. Disadvantages: Signature based IDS are unable to detect unknown attacks or variants of known attacks. Database of signature based IDS has to be manually revised for each new type of attack that is discovered.
JETIR1506034
Journal of Emerging Technologies and Innovative Research (JETIR) www.jetir.org
1869
June 2015, Volume 2, Issue 6
JETIR (ISSN-2349-5162)
(a) SNORT Snort is an open source IDS. It is a signature based technique because it detects the attack based on the set of rules that are predefined within the Snort. If any attack data is found then it automatically drops the packet otherwise the particular record is considered as a normal data. Snort is rule based technique that defines new rules. Snort consists of the following four components [2]; (1) Packet capture/decode engine: It uses the libpcap packet-capturing library written in Lawrence Berkeley National Laboratories. Captured packets are then processed by decoding engine and decoded packets. (2) Preprocessor plug-ins: Packets are passed through a number of preprocessors for investigation and process packets before they are passed to detection engine. (3) Detection engine: It tests the data packets for a number of attributes stated in Snort rules definition file. (4) Output plug-ins: It accept alarms generated from preprocessors, detection engine, or decoding engine. 1.1.2 Anomaly-Based Detection Anomaly-Based detection compares definitions of what activity is considered normal against observed events to identify significant deviations [16]. Anomaly based IDS uses profiles that represent the normal behaviour of system, applications or network traffic that are developed by analyzing the characteristics of typical activity over period of time [16]. Advantages: Anomaly based IDS are able to detect new or unknown attacks or abnormal behaviour. Anomaly detection has the advantage that no rules need to be written and it can detect novel or new attacks. Disadvantages: Profiles can sometimes be inaccurate which results into generation of false alarms considering normal data as an attack. Profiles should be updated constantly. 1.1.3 Data Mining in Intrusion Detection System Data Mining refers to the process of extracting effective, updated, latent, useful, and the understandable pattern from a large incomplete, noise, non-stable and random data. In intrusion detection system, the information deals from multiple sources such as network traffic or logs, system logs, application logs, alarm messages, etc. Due to varied data source and format, the complexity increased in auditing and analysis of data. Data Mining has huge advantage in data extraction from large volumes of data that are noisy and dynamic, thus it is of great importance in intrusion detection system. (a) k-Means K-means is a partitioning method in clustering technique of data mining. K-Means clustering method is used to partition the training data into k clusters with the help of Euclidean distance similarity [4]. It is an algorithm to group or to classify the objects based on attributes/features into k number of clusters. Euclidean Distance equation to find distance between two objects is: D(a,b)= D(b,a)= |a-b|= Basic steps for clustering the data by k-means are: Select a number (k) of cluster centers - centroids (random) Assign every object to its nearest cluster center (e.g. using Euclidean distance) Move each cluster center to the mean of its assigned objects Repeat steps 2,3 until convergence (change in cluster assignments less than a threshold) Advantage: Relatively efficient in grouping normal or abnormal data. Disadvantage: Unable to handle noisy data.
JETIR1506034
Journal of Emerging Technologies and Innovative Research (JETIR) www.jetir.org
1870
June 2015, Volume 2, Issue 6
JETIR (ISSN-2349-5162)
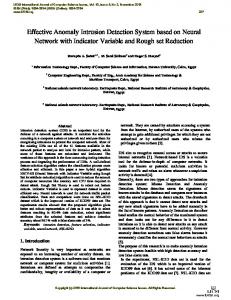
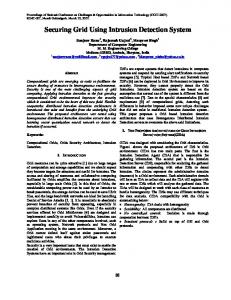
(b) CART (Classification and Regression Trees) Classification tree analysis is used to identify the “class” to which the data belongs. Regression tree analysis is where the data is continuous and tree is used to predict its value. The term Classification and Regression Tree (CART) analysis is used to refer to both of the above procedures. Classification and regression trees are machine-learning methods for constructing prediction models from data. The Classification and Regression Trees (CART) methodology is technically called as binary recursive partitioning [21]. The process is binary because parent nodes are always split into exactly two child nodes and recursive because the process is repeated by treating each child node as a parent. The key elements of CART analysis are a set of rules for splitting each node in a tree; deciding when tree is complete and assigning a class outcome to each terminal node. The main steps of CART are: 1. Rules for splitting data at a node based on value of a variable 2. Stopping when a branch becomes a leaf/terminal node and cannot be split further 3. Finally a prediction for target variable in each leaf/terminal node. Advantages: CART does not rely on data belonging to a particular type of distribution. It is not significantly impacted by outliers in input data. II. LITERATURE REVIEW 1. EDADT algorithm, SNORT + ALAD +LERAD [1] The EDADT algorithm is formed by using two algorithms Hybrid PSO + C4.5. The Hybrid IDS model is formed by using SNORT IDS and two pre-processors ALAD and LERAD. SNORT detects only profile based attacks and the anomaly based approaches such as Application Layer Anomaly Detector (ALAD) and Learning Rules for Anomaly Detection (LERAD) is used to perform better prediction. Semi-Supervised Approach, the labeled data can be labelled using the unlabeled data. The labeled training data are applied to the SVM classifier. In Varying HOPERAA algorithm, a variable clock drift method is proposed to avoid the client waiting time for server and at the same time message loss is avoided greatly. The proposed algorithm has been tested using KDD Cup dataset. KDD Cup 99 data set contains 23 attack types. The framework of proposed methodology is shown in Fig. 2.1. The accuracy, sensitivity and specificity values for Improved EDADT algorithm are 98.12%, 96.86% and 92.36%. SNORT+ALAD+LERAD have detected 149 attacks out of 180 attacks. Semi-Supervised Approach shows 98.88% in terms of accuracy compared to the existing algorithms like Reduced Support Vector Machine, Semi-Supervised clustering algorithm (PCKCM) and Fuzzy Connectedness based Clustering also shows 0.5% false alarm rate respectively in compared to methods such as RSVM, one step Markov, order 10 Markov, Markov chain+ drift, PCKCM and FCC.
Fig. 2: Framework of methodology in Intrusion Detection System [1]
JETIR1506034
Journal of Emerging Technologies and Innovative Research (JETIR) www.jetir.org
1871
June 2015, Volume 2, Issue 6
JETIR (ISSN-2349-5162)
The proposed varying HOPERAA algorithm has been compared with the existing HOPERAA using throughput and packet size metrics. With the help of varying clock drift, the message loss is greatly reduced and the client can easily communicate with the server with minimum contact initiation trails and the improved maximum delivery latency has been achieved. 2. SNORT+PHAD+NETAD [2] The hybrid IDS is obtained by combining (PHAD) packet header anomaly detection and (NETAD) network traffic anomaly detection which are anomaly-based IDSs with the misuse-based IDS. A. SNORT Snort is a rule-based network intrusion detection system. Every rule consists of two logical parts: the rule header and rule options. The rule header has five sections; rule actions (the action to be taken when an intrusion is detected), the end-to end source and destination information (source IP addresses, destination IP addresses and port numbers depending on the protocol), and protocol type (TCP, UDP, or ICMP). The rule options consist of different conditions that help deciding whether the mentioned misuse operation has occurred or not. B. PHAD Packet header anomaly detector (PHAD) is the first anomaly based approach added to Snort as a preprocessor in this study. PHAD is different from other network-based anomaly detection systems by two reasons. Firstly, it models protocols rather than the user behavior because the majority of the attacks exploit protocol implementation bugs and can only be understood by detecting unusual input and output. Secondly, it uses a time-based model, assuming a quick change in a short time in the network statistics. PHAD reduces false alarm rate by flagging only the first anomaly as an alarm. C. Network traffic anomaly detector (NETAD) Network traffic anomaly detector (NETAD) is second anomaly based approach added to Snort as a preprocessor in this study. The NETAD also models packets as PHAD. NETAD operates in two phases: First is the filtering of incoming client sessions to distinguish beginning of sessions. Second is the modeling phase. Filtering phase eliminates the traffic up to 98–99%. Elimination simplifies the traffic for the modeling phase. Thus only the traffic data which evidence of attacks are included in is passed to the modeling phase. 2.1 Combining PHAD and NETAD to signature-based IDS Snort Snort’s preprocessor architecture has been used to combine PHAD and NETAD with Snort. Snort has detected 27 attacks out of 201 attacks available in IDEVAL data. Snort + PHAD have detected 51 attacks and Snort + PHAD + NETAD detected 146 attacks. It is clear NETAD is added as a pre-processor Snort becomes a more powerful IDS. 3. Entropy based IDS, SVM based Anomaly Detection [3] A. Entropy based IDS The entropy of network features is the measurement of uncertainty or randomness which if deviates from a predefined range, indicates the randomness or abnormality in the network traffic that is anomaly in the network traffic. Value of network entropy tends towards 1 when there is high level of uncertainty in the traffic
JETIR1506034
Journal of Emerging Technologies and Innovative Research (JETIR) www.jetir.org
1872
June 2015, Volume 2, Issue 6
JETIR (ISSN-2349-5162)
1. Input Network traffic 2. Output Normalized entropy for each network feature 3. loop: each time interval //till the traffic comes 3.1 Extract features from packet header (for example: source IP). 3.2 loop: for each packet in the time interval 3.2.1 Calculate frequency of all distinct source IP end 3.3 Loop: for each distinct IP 3.3.1 Calculate probability for each distinct source IP address Pi = mi/T Here, mi = frequency of ith source IP T= total number of packets in that time interval 3.3.2 Calculate entropy for each distinct IP address hi= - pi log pi end 3.4 Normalize the entropy, in the time interval by H = hi/log(F) // F is total number of distinct source IP address. END
Algorithm for calculating normalized entropy B. SVM based Anomaly Detection SVM model is the classification technique that models different network features for classifying the normal and attack traffic. A hybrid technique which is a combination of both entropy of network features and support vector machine is compared to the individual methods. Normalized entropy of network features are calculated and sent to SVM model for learning the behaviour of the network which classifies the network traffic in normal or attack traffic. The DARPA Intrusion Detection Evaluation dataset is used to evaluate the methods. The experimental results of Entropy based system are 85.71% correctly classified and 14.29% misclassified and that of SVM based system is 77.71% correctly classified and 22.29% misclassified.. The results of hybrid technique are 97.25% correctly classified and 2.75% misclassified. In addition, hybrid approach yields more accuracy than entropy and SVM based techniques. 4. K-means Clustering + C4.5 Decision Tree method [4] A. Anomaly Detection with k-Means Clustering The k-Means algorithm groups n data points into k disjoint clusters, where k is a predefined parameter. Steps in the k-Means clustering-based anomaly detection method are as follows: Step 1: Select k random instances from the training data subset as the centroids of the clusters C1; C2; ...Ck. Step 2: For each training instance X: a. Compute the Euclidean distance D(Ci,X),i = 1...k b. Find cluster Cq that is closest to X. c. Assign X to Cq. Update the centroid of Cq. (The centroid of a cluster is the arithmetic mean of the instances in the cluster.) Step 3: Repeat Step 2 until the centroids of clusters C1; C2; ...Ck stabilize in terms of mean-squared error criterion. Step 4: For each test instance Z: a. Compute the Euclidean distance D(Ci,Z),i = 1...k. Find cluster Cr that is closest to Z. b. Classify Z as an anomaly or a normal instance using the Decision tree.
B. Anomaly Detection with C4.5 Decision Trees Given a set S of cases, C4.5 first grows an initial tree using the divide-and-conquer algorithm as follows: 1. If all the cases in S belong to the same class or S is small, then the tree is a leaf labeled with the most frequent class in S.
JETIR1506034
Journal of Emerging Technologies and Innovative Research (JETIR) www.jetir.org
1873
June 2015, Volume 2, Issue 6
JETIR (ISSN-2349-5162)
2. Else, choose a test based on a single attribute with two or more outcomes. Make this test the root of the tree with one branch for each outcome of the test, partition S into corresponding subsets S1, S2, S3,... according to the outcome for each case, and apply the same procedure recursively to each subset. The performance of k-Means, ID3 decision tree, Naïve Bayes algorithm, K-Nearest Neighbors (K-NN), SVM algorithm, TCM–KNN (Transductive Confidence Machines for K-Nearest Neighbors) and the proposed cascading algorithm of K–Means and C4.5 algorithms is measured and the accuracy of the proposed (K–Means + C4.5) method is higher than other methods. 5. CART, Bayesian Model, Artificial Neural Network [5] In this paper we are using CART, Naïve Bayesian, and Artificial Neural Network Model data mining classification methods. Classification and regression trees (CART) is a non-parametric technique that produces either classification or regression trees, depending on whether the dependent variable is categorical or numeric, respectively. An artificial neural network is a system based on the operation of biological neural networks, in other words, is an emulation of biological neural system. These methods have proved to be useful for gathering different knowledge for Intrusion Detection. Classification and regression trees (CART) are a non-parametric technique that produces either classification or regression trees depending on whether the dependent variable is numeric or categorical respectively. Trees are formed by a collection of rules based on values of certain variables in the modeling data set. The rules are selected based on how well splits based on variables values can differentiate observations based on the dependent variable. Once a rule is selected and splits a node into two, the same logic is applied to each “child” node. It is a recursive procedure. Splitting of node stops when CART detects no further gain can be made, or some pre-set stopping rules are met. Each branch of the tree ends in a terminal node. Each observation falls into one and exactly one terminal node. Each terminal node is uniquely defined by a set of rules.We used machine learning tool, Weka3.6 for analyzing the results. Weka3.6 does not support large databases; hence we have not used some of the attributes. The result shows that the performance of the Induction tree method and ANN methods are better than the NB classifier. Comparison Table Table 1: Comparison of Literature Survey Sr. Description Approach Pros Cons No. 1 Effective approach Hybrid PSO + High Cannot be toward Intrusion C4.5, SNORT + accuracy rate applied to Detection System ALAD + real traffic, using data mining LERAD, SVM, Increase techniques varying complexity HOPERAA 2 A hybrid intrusion detection SNORT + PHAD Detect more Cannot system design for computer + NETAD attacks than detect network security SNORT behavioural attacks Hybrid Approach for 3 Entropy + SVM Define Cannot Detection of Anomaly classifier network process Network Traffic using Data properties large data Mining Techniques
JETIR1506034
Journal of Emerging Technologies and Innovative Research (JETIR) www.jetir.org
1874
June 2015, Volume 2, Issue 6
4
5
JETIR (ISSN-2349-5162)
Network Anomaly Detection by Cascading K-Means Clustering and C4.5 Decision Tree algorithm Classifying the Network Intrusion Attacks using Data Mining Classification Methods and their Performance Comparison
K-Means, C4.5, K-Means + C4.5
High accuracy rate
Cannot process large dataset
CART, Bayesian Model, Artificial Neural Network Model
Accuracy of CART is more
Do not support large database
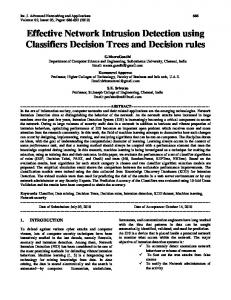
III. PROPOSED WORK This section describes proposed methodology along with flowchart for processing steps, algorithmic steps, benefits of it and expected outcome. 1. Flowchart for processing steps:
Fig. 3: Framework of proposed IDS model Steps: 1. The KDD Cup 99 Dataset is selected for Intrusion detection process. 2. The tcpreplay is used to pass pcap files into SNORT from KDDCup99 dataset. 3. If any attack is detected then it will drop packet else data is passed to Data mining engine where data mining algorithm process the data. 4. If any attack is detected then it will raise alarm and drop packet. 2. Flowchart for (1) Signature based detector - processing steps:
Fig. 4: Framework of Signature based detector Steps:
JETIR1506034
Journal of Emerging Technologies and Innovative Research (JETIR) www.jetir.org
1875
June 2015, Volume 2, Issue 6
JETIR (ISSN-2349-5162)
1. The packets from KDDCup99 dataset is send to Snort for processing. 3. In Snort IDS, a data packet is checks whether a packet match a predefined rule for abnormality, if yes then processor plugin is used to check whether it contains a misuse or not. 4. It raise alarm if it founds any misuse action and if not then considers it as a normal data and it is sends further to dat a mining engine. 3. Flowchart for (2) Data mining engine- processing steps:
Fig. 5: Framework of Data mining engine Algorithmic Steps: 1. The data considered as normal by Snort processor is send to data mining engine for anomaly classification. 2. The dataset is passed for clustering by k-means clustering method. The algorithm for the k-means clustering is as follows: Input: Reduced dataset, Output: Clusters of data 2.1 Select k random instances from the new dataset such that k= number of clusters (C 1, C2, C3, … Ck). 2.2 For each instance X of dataset; 2.2.1 Compute the Euclidean distance D(Ci,X) i = 1,2,3, ...k D(a,b)= D(b,a)= |a-b|= 2.3 Find cluster Cq that is closest to X. 2.4 Assign X to Cq. Update the centroid of Cq. (The centroid of a cluster is the arithmetic mean of the instances in the cluster.) 2.5 Repeat step 2.2 until centroids of the clusters C1, C2, C3, … Ck stabilize in terms of mean-squared error criterion. 2.6 Classify X as an anomaly or normal instance using CART decision tree. 3. The clusters formed by k-means clustering are classified with the help of CART (Classification and Regression Trees) decision tree. The algorithm for the CART is as follows: Input: Clusters of data, Output: Decision tree- classified data 3.1 Create a node N 3.2 If tuples in clusters (C) are of same class M then return N as leaf node labeled with class M. 3.3 Otherwise, apply Attribute selection method (Gini Index) to find the best splitting criterion. 3.4 Label node N with the splitting criterion j. 3.5 If splitting attribute is dicrete-valued and multiway splits allowed then attribute list = attribute list - splitting attribute. 3.6 Let Cj be the set of data of cluster that satisfy outcome of j. If Cj is empty then attach leaf labelled with majority class of C to node N Else repeat step 3.1 to 3.5. //Partiton tuples and grow decision tree for each partition. 3.7 Return N. 4. Classify the instance as normal or anomaly.
IV. IMPLEMENTATION This section describes about result analysis of the proposed scheme for intrusion detection. The parameters accuracy, time to build model, precision and recall are analysed. 1. Results of k-means + C4.5 Algorithm: Table 2: Results of k-means + C4.5 algorithm Total Number of Instances 14957 Correctly Classified Instances 14424 96.4365 %
JETIR1506034
Journal of Emerging Technologies and Innovative Research (JETIR) www.jetir.org
1876
June 2015, Volume 2, Issue 6
JETIR (ISSN-2349-5162)
Incorrectly Classified Instances
533
3.5635 %
Table 3: Confusion Matrix A 7885 461
B 72 6539
Classified as Normal Abnormal
Table 4: Detailed Accuracy by Class TP Rate 0.964
FP Rate 0.039
Precision 0.966
Recall 0.964
2. Results of k-means + CART Algorithm: Table 5: Results of k-means + CART algorithm Total Number of Instances 14957 Correctly Classified Instances 14870 99.4183 % Incorrectly Classified Instances 87 0.5817 % Table 6: Confusion Matrix A 7904 34
B 53 6966
Classified as Normal Abnormal
Table 7: Detailed Accuracy by Class TP Rate 0.994
FP Rate 0.006
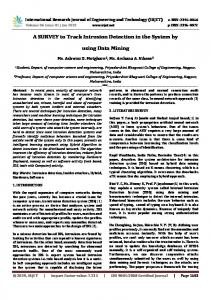
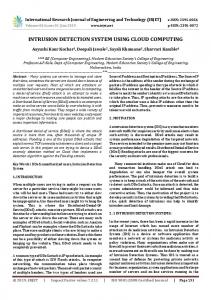
3. Comparison of C4.5 and CART algorithm: Fig. 6: Comparison of number of correctly classified data
Precision 0.994
Fig. 7: Comparison of time taken to generate decision tree
Correctly Classified Instances 14900
Recall 0.994
Time taken to generate decision tree 4
14800 3
14700 Correctly Classified Instances
14600 14500 14400
Time taken to build model
2 1
14300 14200
0 C4.5
CART
C4.5
CART
V. CONCLUSION
JETIR1506034
Journal of Emerging Technologies and Innovative Research (JETIR) www.jetir.org
1877
June 2015, Volume 2, Issue 6
JETIR (ISSN-2349-5162)
KDD Cup 99 Dataset is analyzed primarily by Snort which is signature based IDS. Here the profile (behavior) based detection is not performed. Further anomaly detection is performed with the help of data mining model which use k-means for clustering the packets and CART for classification into decision tree so that more number of attacks are detected than current IDS system. Metrics of CART algorithm is compared with C4.5 algorithm where accuracy of CART algorithm is 99.41% and C4.5 is 96.43% which is less than CART algorithm. CART takes less time to build decision tree than C4.5 which is 1.3 sec for CART and 3.8 sec for C4.5. CART works better than C4.5 for intrusion detection. Future Work: New rules for detection can be created from the decision tree generated and added to snort for the abnormal data under data mining system.
VI. REFERENCES [1] G.V. Nadiammai, M. Hemalatha, “Effective approach toward Intrusion Detection System using data mining techniques”, Elsevier Publication, 2013, DOI: 10.1016/j.eij.2013.10.003. [2] M. Ali Aydın, A. Halim Zaim, K. Gokhan Ceylan, “A hybrid intrusion detection system design for computer network security”, Computers and Electrical Engineering, Elsevier Publication, 2009, DOI: 10.1016/j.compeleceng.2008.12.005. [3] Basant Agarwal, Namita Mittal, “Hybrid Approach for Detection of Anomaly Network Traffic using Data Mining Techniques”, 2nd International Conference on Communication, Computing & Security, Procedia technology, ScienceDirect, Elsevier Publication, 2012, DOI: 10.1016/j.protcy.2012.10.121. [4] Saurabh Mukherjee, Neelam Sharma, “Intrusion Detection using Naive Bayes Classifier with Feature Reduction”, Procedia technology, ScienceDirect, Elsevier Publication, 2012, DOI: 10.1016/j.protcy.2012.05.017. [5] Amuthan Prabakar Muniyandi, R. Rajeswari, R. Rajaram, “Network Anomaly Detection by Cascading K-Means Clustering and C4.5 Decision Tree algorithm.”, International Conference on Communication Technology and System Design, Procedia Engineering, ScienceDirect, Elsevier Publication, 2011, DOI: 10.1016/j.proeng.2012.01.849. [6] P Srinivasulu, D Nagaraju, P Ramesh Kumar, and K Nageswara Rao, ”Classifying the Network Intrusion Attacks using Data Mining Classification Methods and their Performance Comparison”, IJCSNS International Journal of Computer science and Network Security, Vol.9 No.6, 2009. [7] Chakchai So, Nutakarn Mongkonchai, Phet Aimtongkham, Kasidit Wijitsopon and Kanokmon Rujirakul, “An Evaluation of Data Mining Classification Models for Network Intrusion Detection”, IEEE Publication, 2014, ISBN: 978-1-4799-3724-0/14 [8] http://en.wikipedia.org/wiki/Decision_tree_learning d: 25-11-2014, t: 5:00 pm [9] http://en.wikipedia.org/wiki/K-means_clustering d: 25-11-2014, t: 5:30 pm [10] http://www.sans.org/security-resources/idfaq/anomaly_detection.php d: 26-11-2014, t: 11:00 am [11] Jiawei Han, Micheline Kamber, “Data Mining: Concepts and Techniques”, Second Edition,Elsevier Publication, ISBN: 978-155860-901-3. [12] Hossein Jadidoleslamy, “A High-Level Architecture for Intrusion Detection on Heterogeneous Wireless Sensor Networks: Hierarchical, Scalable and Dynamic Reconfigurable”, sciRP Journal, 2009, DOI: 10.4236/wsn.2011.37026. [13] Mohd. Junedul Haque, Khalid.W. Magld, Nisar Hundewale, “An Intelligent Approach for Intrusion Detection Based on Data Mining Techniques”, IEEE Publication, 2012, ISBN: 978-1-4673-1518-0. [14] Aleksandar Lazarevic, Vipin Kumar, Jaideep Srivastava, “Intrusion Detection: A Survey”, Computer Science Department, University of Minnesot. [15] “2010/2011 Computer Crime and Security Survey”, http://gatton.uky.edu/FACULTY/PAYNE/ACC324/CSISurvey2010.pdf, d: 24-11-2014, t: 3:30 pm [16] Karen Scarfone, Peter Mell, “Guide to Intrusion Detection and Prevention Systems (IDPS)”, Recommendations of the National Institute of Standards and Technology, Gaithersburg, MD 20899-8930, February 2007. [17] Jian Pei, Shambhu J. Upadhyaya, Faisal Farooq, Venugopal Govindaraju, “Data Mining for Intrusion Detection – Techniques, Applications and Systems” State University of New York at Buffalo. [18] Animesh Patcha, Jung-Min Park, “An overview of anomaly detection techniques: Existing solutions and latest technological trends”, Elsevier Publication, 2007, DOI: 10.1016/j.comnet.2007.02.001. [19] Muamer N. Mohammada, Norrozila Sulaimana, Osama Abdulkarim Muhsinb, “A Novel Intrusion Detection System by using Intelligent Data Mining in Weka Environment”, Elsevier Publication, 2011, DOI: 10.1016/j.procs.2010.12.198. [20] M. Mahoney (2003b), Source code for PHAD, ALAD, LERAD, NETAD, SAD, EVAL3, EVAL4, EVAL and AFIL.PL is available at http://cs.fit.edu/~mmahoney/dist/ [21] Data Mining – Clustering, Institute of Computing Sciences, Poznan University of Technology, Poznan, Poland, Lecture 7, SE Master Course, 2009. [22] http://www.salford-systems.com/products/cart d: 27-11-2014, t: 7:00 pm [23] http://kdd.ics.uci.edu/databases/kddcup99/kddcup99.html - KDD Cup99 Intrusion Detection Dataset d: 2-1-2015 t: 10:30 pm.
JETIR1506034
Journal of Emerging Technologies and Innovative Research (JETIR) www.jetir.org
1878