A Hybrid Unsupervised Approach for Document Clustering Mihai Surdeanu
Jordi Turmo
Alicia Ageno
Technical University of Catalonia Barcelona, Spain
Technical University of Catalonia Barcelona, Spain
Technical University of Catalonia Barcelona, Spain
[email protected]
[email protected]
[email protected]
ABSTRACT We propose a hybrid, unsupervised document clustering approach that combines a hierarchical clustering algorithm with Expectation Maximization. We developed several heuristics to automatically select a subset of the clusters generated by the first algorithm as the initial points of the second one. Furthermore, our initialization algorithm generates not only an initial model for the iterative refinement algorithm but also an estimate of the model dimension, thus eliminating another important element of human supervision. We have evaluated the proposed system on five real-world document collections. The results show that our approach generates clustering solutions of higher quality than both its individual components. Categories and Subject Descriptors: H.3.3: Clustering General Terms: Algorithms Keywords: Unsupervised clustering, EM initialization
1. MOTIVATION AND BACKGROUND The work presented in this paper is motivated by research into text mining and classification from large, real-world document collections. As the amount of available data becomes virtually unlimited, manual or supervised mining approaches become prohibitively expensive due to the limited reading and processing speed of the human experts. For this reason, we concentrate our research only on unsupervised methods. From the larger field of text mining and classification, this paper focuses on document clustering. Clustering, loosely defined as the grouping of similar data items, is the keystone of data classification. Following our creed, we focus on unsupervised clustering techniques that do not require labeled data or human feedback. From the vast array of clustering methods, iterative refinement clustering techniques are extremely popular due to their good performance, relative simplicity, and good theoretical foundations. By and large the most popular iterative refinement clustering algorithm is Expectation Max-
imization (EM) [2]. EM iteratively: (a) assigns membership probabilities for all data items and all clusters, and (b) re-estimates its model parameters based on the new assignments. The EM class of clustering algorithms are not problem free. Like all clustering algorithms, they rely on outside sources to provide the expected number of clusters, k. Having the human domain expert provide this information is not feasible when dealing with large document collections containing new, potentially unknown data. Hence, we focus only on automated, unsupervised methods for the estimation of k. The most popular probabilistic method to determine the dimensions of a given model is the Bayes Information Criterion (BIC) [9]. From all possible model dimensions, BIC chooses the one that maximizes the model log likelihood function. Calinski and Harabasz [1] proposed maximizing the ratio of inter (or between) and intra (or within) cluster distances as a means for estimating k. This last method was empirically shown to be the most efficient [5]. However, unless the data is part of a certain family of distributions, all these methods are not consistent. A second problem that is specific to iterative refinement clustering algorithms is the choice of the initial model parameters. Being part of the hill-climbing family of algorithms, iterative refinement algorithms converge to local maxima, which may be far from the global maximum if the choice of the initial point is poor. De facto solutions in most implementations of iterative refinement clustering algorithms use random or user-chosen starting points [3, 7]. Comparative studies indicate that other, more complex, initialization methods show no improvement over random initialization [4]. The work presented in this paper addresses all previously mentioned issues that plague EM and in general iterative refinement clustering algorithms with the following advantages: 1. It is an integrated method that detects both the number of clusters k and the initialization model for each identified category; and 2. It consistently outperforms its constituents individually: the hierarchical algorithm and EM with random initialization.
Permission to make digital or hard copies of all or part of this work for personal or classroom use is granted without fee provided that copies are not made or distributed for profit or commercial advantage and that copies bear this notice and the full citation on the first page. To copy otherwise, to republish, to post on servers or to redistribute to lists, requires prior specific permission and/or a fee. KDD’05, August 21–24, 2005, Chicago, Illinois, USA. Copyright 2005 ACM 1-59593-135-X/05/0008 ...$5.00.
The paper is organized as follows. Section 2 overviews the proposed method for the selection of the initial model for EM. Section 3 introduces several measures that indicate the quality of the initial points. These measures are the key of the initialization algorithm. In Section 4 we evaluate the performance of the initialization algorithm and the perfor-
Hierarchical Clustering
Generate Initial Model Candidates
Expectation Maximization
Select Best Initial Model
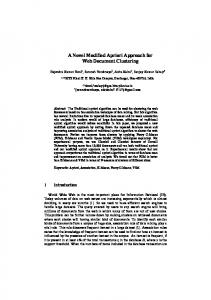
Figure 1: The hybrid clustering procedure mance of a complete clustering solution based on EM. We conclude in Section 5.
2. APPROACH 2.1 Architecture Overview Intuitively, the proposed approach searches through the space of all possible document clusters for the best initial model for an EM algorithm. Obviously, a direct implementation of this idea is computationally intractable. To reduce the computational overhead of the methodology we limit the search to the clusters contained in a hierarchical clustering solution, or dendrogram [10]. Figure 1 overviews the proposed clustering method. First, we use a hierarchical algorithm to generate the collection dendrogram. We detail the hierarchical algorithm used in Section 2.2. From the dendrogram clusters, the next component generates the candidates for the EM initial model as follows: 1. All dendrogram clusters are sorted in descending order of their quality. Intuitively, we define the cluster quality as the likeliness that the cluster contains all and only documents from one domain. So far, an exact implementation of this measure does not exist. Given that the quality measure is the keystone of this paper, we dedicate Section 3 to the introduction of several possible approximations of the above definition. 2. The top clusters that provide a coverage of less or equal than γn documents, where n indicates the number of documents in the collection, are selected. Intuitively, the γ factor indicates the confidence given to the hierarchical clustering algorithm. For example, a γ value of 0.75 indicates that we trust the hierarchical algorithm and the quality measure to provide clusters for up to 75% of the document collection. 3. The clusters selected in the previous step are postprocessed to remove the clusters that are already included in other higher-ranked clusters. The set of postprocessed clusters form one initial model candidate for a given γ factor and a given quality measure. The above approach leaves several important questions unanswered: given that multiple possible quality measures exist, which one yields the best initial model? Furthermore, what is the best collection coverage (γ) to be used in an initial model? Both questions are answered by the next component, which selects the best initial model from all the generated candidates. The initial model candidates are produced for all possible quality measures (see Section 3) and several γ values. The selection algorithm uses a hill-climbing algorithm to select the model that maximizes some global quality function. This algorithm is detailed in Section 2.3.
This initialization approach follows our intuition that the “best” clusters provided by a hierarchical clustering approach crystallize well the categories hidden in a document collection, and the iterative algorithm is capable of both refining potentially incorrect assignments and assigning the missing documents. The remaining of this section details the two clustering algorithms used (hierarchical and EM), and the initial model selection algorithm.
2.2
Hierarchical Clustering
The hybrid clustering method illustrated here can potentially use dendrograms produced by any hierarchical clustering algorithm. Due to space limitations, in this paper we focus only on hierarchical agglomerative clustering (HAC), a simple algorithm previously reported to have good performance on real-world collections [10]. The HAC algorithm uses a bottom-up approach to build the dendrogram: first, it assigns each document to its own cluster, and then it repeatedly merges the two “closest” clusters [10]. The key parameter in HAC is the method used to measure the inter-cluster distance. We have used the UPGMA, or group average, distance, which we previously found to yield the best performance in the HAC context: 1 X X dist(dr , ds ) (1) distU P GM A (ci , cj ) = ni nj dr ∈ci ds ∈cj
where ni indicates the number of documents in cluster ci , nj indicates the number of documents in cluster cj , and dist(dr , ds ) = 1 − cos(dr , ds ), where cos(dr , ds ) is the cosine between the two documents’ tf-idf-weighted term vectors.
2.3
Selection of the Best Initial Model
An important part of the proposed system is the selection of the “best” initial model from the set of candidates. We have opted for an approach similar to the work of Calinski and Harabasz [1]. Intuitively, Calinski and Harabasz choose the model that locally maximizes a normalized ratio of between distances (i.e. distances between different clusters) and within distances (i.e. distances between documents within the same cluster) computed for the complete clustering model. In other words, a good initial model will contain tight clusters that are well separated from each other. Formally, Calinski and Harabasz compute the score C of a given clustering model with dimension k as follows: B(n − k) W (k − 1)
(2)
ni dist(centroidi , meta centroid)2
(3)
C= B=
k X i=1
W =
ni k X X i=1 j=1
dist(dj , centroidi )2
(4)
where n is the size of the model, ni is the size of the ith cluster, centroidi is the composite vector of cluster i, and meta centroid is the composite vector of the whole collection. B and W are the unnormalized between and within distances for the complete clustering model. One issue that is not captured in Equation 2 is that we prefer larger size initial models, in order to avoid trivial cases such as models that contain clusters with few orthogonal documents. Such clusters are likely to be outliers, which are obviously not good initial points for any iterative refinement clustering algorithm. This preference for larger size models is captured by the actual selection algorithm, which searches for the first local maximum of C as the collection coverage γ decreases from 100% to 0%. The algorithm is described below: 1. bestM odel = φ, bestScore = 0. 2. For all quality measures: (a) currentScore = first local maximum of C as γ decreases from 100% to 0%. (b) If currentScore > bestScore i. bestM odel = model given by current quality measure and current γ. ii. bestScore = currentScore. 3. Return bestModel. The best initial model generated from the selected γ and quality measure inherently contains the model dimension k and initial points for each of the identified categories.
2.4 Expectation Maximization The EM algorithm finds maximum likelihood estimates of its parameters using probabilistic models over incomplete data. EM was theoretically proven to converge to a local maximum of the parameters’ log likelihood. The EM algorithm used in this paper estimates its model parameters using the Naive Bayes (NB) assumptions, similar to [6]. The algorithm has the following structure: 1. Initialization: the model parameters are estimated using only documents labeled in the proposed initial model. 2. E step: the NB classifier is used to assign probabilisticallyweighted category labels to all documents, including previously unlabeled documents. ˆ are estimated using 3. M step: new model parameters, θ, all the documents currently labeled. 4. Repeat the E and M steps until convergence to a local ˆ maximum of the log likelihood of θ. In our context, i.e. document clustering, the parameters ˆ include the probability of of the generative NB model, θ, ˆ and the probability of seeing seeing a given category, P (c|θ), ˆ In the initialization and a word given a category, P (w|c; θ). maximization steps, these parameters are estimated using Laplace smoothing: P 1+ n i=1 P (yi = c|di ) ˆ (5) P (c|θ) = q+n ˆ = P (w|c; θ)
v+
Pn T F (w, di )P (yi = c|di ) i=1 Pn j=1 i=1 T F (wj , di )P (yi = c|di )
1+ Pv
(6)
where P (yi = c|di ) is 1 if the label yi of document di is c and 0 otherwise; T F (wj , di ) is the term frequency of word
wj in document di ; q is the number of categories in the collection; n is the number of documents; and v is the collection vocabulary size. Using these parameters and the word independence assumption typical to the Naive Bayes model, the probability of a document d given a category c is estimated as: ˆ = P (|d|)Π|d| P (wi |c; θ) ˆ P (d|c; θ) i=1
(7)
Using Equation 7 and the Bayes rule, in the expectation step the probability that a document d has a given category c is calculated as: ˆ ˆ ˆ = P (c|θ)P (d|c; θ) P (c|d; θ) (8) ˆ P (d|θ) =
Pq
ˆ |d| P (wi |c; θ) ˆ P (c|θ)Π i=1 |d| ˆ ˆ P (cj |θ)Π P (wi |cj ; θ)
j=1
3.
(9)
i=1
CLUSTER QUALITY MEASURES
The key component of our clustering approach is the battery of quality measures used to generate initial model candidates from the dendrogram produced by the hierarchical clustering algorithm. We have developed a set of quality formulas that combine the following observations: Observation 1: On minimizing within distances. The initial points for the iterative refinement algorithm should contain documents from only one category. Since documents in the same category are conceptually closer than documents from different categories, a good initial point will have small pairwise distances between documents within the corresponding cluster. Equation 10 introduces W (ci ), the average of the pairwise distances between documents within a cluster ci : X X 1 W (ci ) = dist(dr , ds ) (10) ni (ni − 1) dr ∈ci ds ∈ci ,s6=r
where dist(dr , ds ) is computed as in Equation 1. Based on the above observation, the quality measure should favor clusters with small W values. Observation 2: On maximizing between distances. The clusters selected to generate the initial parameters for iterative clustering should contain as many documents from one category as possible. Therefore, since a category should be well separated from the other categories in the data, a good initial point will have large distances between its documents and the rest of the collection. We model the distance B(ci ) between the cluster ci and the rest of the collection as the average of the pairwise distances between documents within and outside of cluster ci : X X 1 dist(dr , ds ) (11) B(ci ) = ni (n − ni ) dr ∈ci ds ∈c / i
The quality measure should favor documents with large B values. Observation 3: On maximizing between distances in the neighborhood. Combinations of the W and B measures have been previously used as clustering criterion functions and as a criterion for detecting the best model dimension k. However, when using W and B for a post-clustering filtering function,
Name Formula
W 1/W
WB B /W
WN N /W
GW 1 / (GW )
GWB B / (GW )
GWN N / (GW )
Table 1: Quality measures used by the initialization algorithm
several subtleties arise: (i) most clusters will have large B values because all clustering criteria maximize inter-cluster distances, and (ii) W values will have a large variation because the dendrogram includes clusters of all sizes. In this case, cluster comparison functions based on B and W are decided mainly by the W measure. Nevertheless, a between measure computed in the cluster vicinity indicates the degree of separation between a cluster and only its neighbors, without the “noise” introduced by the collection mass. We approximate the neighborhood between distance of a cluster ci as the UPGMA distance between the cluster and its dendrogram sibling: N (ci ) = distU P GM A (ci , sibling(ci ))
(12)
Observation 4: On minimizing the cluster “growth”. Filtering functions based on the W and B quality measures have two potential drawbacks: (i) they will favor small clusters, which are more compact and better separated from the rest of the collection, and (ii) they will prefer categories represented by denser clusters. In the first case the system will generate many categories with smaller coverage. In the second situation the system will miss the information contained in the ignored categories. Such situations are frequent in real-world document collections, which include clusters with different densities. Given these observations, it becomes imperative to explore other cluster properties that are independent of the cluster density. One such property is the cluster growth, G, defined as the cluster expansion at the last dendrogram join, relative to the internal density of its two children. Formally, G(ci ) is the ratio of the distance between the cluster’s two children ci1 and ci2 and the average of the pairwise distances between documents within the two children: X X w sum(ci ) = dist(dr , ds ) (13) dr ∈ci ds ∈ci ,s6=r
w sum(ci1 ) + w sum(ci2 ) within children(ci ) = ni1 (ni1 − 1) + ni2 (ni2 − 1) distU P GM A (ci1 , ci2 ) G(ci ) = within children(ci )
(14) (15)
where w sum(ci ) is the unnormalized sum of all distances between objects within a cluster ci , and within children(ci ) is the average distance between objects belonging to the same child of cluster ci . Intuitively, a good initial point will have a small growth factor. Large variations of the growth factor indicate that the corresponding cluster is composed of two relatively distant children clusters, which happens when two different categories are joined, close to the top of the dendrogram tree. Using the observations and the distances previously introduced in this section we have derived 6 quality measures, listed in Table 1. The quality measures are generated in a straightforward manner: we multiply the formulas that should be maximized (B or N ) with the inverse of the formulas that should be minimized (W or G).
Collection AP LATIMES REUTERS REUTERS-Top10 SMART
#doc. 5000 5000 3019 2545 5467
#cat. 11 8 93 10 4
#terms 27366 31960 7846 6734 11950
Table 2: Document collections used in the evaluation
4. 4.1
EXPERIMENTAL RESULTS Document Collections
We used five document collections in the evaluation of the proposed hybrid clustering algorithm. The AP collection is the Associated Press (year 1999) subset of the AQUAINT collection. The documents’ category assignment is indicated by a CATEGORY tag. The LATIMES collection is the Los Angeles Times subset of the TREC-5 collection. The categories correspond to the newspaper desk that generated the article [11]. The REUTERS collection is the by now classic Reuters-21578 text categorization collection [8]. Similar to previous work we used the ModApte split [6], but, since our algorithm is unsupervised, we use the test partition directly. The REUTERS-Top10 collection is a subset of the above ModApte test partition that includes only the ten most frequent categories [6]. The SMART collection was previously developed and used for the evaluation of the SMART information retrieval system. Due to memory limitations on our test machines, we reduced the size of the AP and LATIMES collections to the first 5,000 documents (the complete collections contain over 100,000 documents). The collection documents were preprocessed as follows: (i) stop words and numbers were discarded; (ii) all words were converted to lower case; and (iii) terms that appear in a single document were removed [10, 11]. Table 2 lists the collection characteristics after preprocessing. In the two Reuters collections, the assignment of documents to categories is ambiguous: the mean number of categories assigned to a document is 1.2 in the REUTERS collection and 1.1 in the REUTERS-Top10 collection.
4.2
Evaluation Metrics
The quality of the clustering solutions was measured using two evaluation measures, purity and entropy, widely used to evaluate the performance of unsupervised clustering algorithms [11, 10]. The purity measure evaluates the degree to which each cluster contains documents from a single category. The overall purity is the weighted average of all cluster purities: 1 max nji ni j k X ni P urity = P (ci ) n i=1 P (ci ) =
(16) (17)
Collection AP AP AP LATIMES LATIMES LATIMES REUTERS REUTERS REUTERS REUTERS-Top10 REUTERS-Top10 REUTERS-Top10 SMART SMART SMART
Algorithm Hybrid HAC EM5 Hybrid HAC EM5 Hybrid HAC EM5 Hybrid HAC EM5 Hybrid HAC EM5
Purity 0.74 0.47 0.65 0.75 0.32 0.59 0.70 0.50 0.65 0.76 0.53 0.70 0.90 0.71 0.84
Entropy 0.34 0.53 0.40 0.42 0.84 0.53 0.26 0.34 0.30 0.17 0.25 0.19 0.24 0.38 0.27
Hybrid Calinski + HAC Calinski + EM5 q
where nji represents the number of documents from cluster ci assigned to category j. Intuitively, the larger the purity value, the better the clustering solution is. The second evaluation measure used is the entropy measure, which analyzes the distribution of categories in each cluster. The entropy E of a cluster ci is defined as: q nj 1 X nji log i log q j=1 ni ni
(18)
where q represents the total number of categories in the collection [11]. The overall entropy is the weighted average of all cluster entropies: Entropy =
k X ni E(ci ) n i=1
(19)
Because the entropy measures the amount of disorder in a system, the smaller the entropy value, the better the clustering solution is. Lastly, for the unsupervised initialization algorithm we report the estimated number of clusters k. The closer k is to the number of categories in the collection, q, the better the initialization algorithm is. Nevertheless, in the situations when k 6= q, we prefer solutions with larger k, because this increases the number of true categories recovered in the clustering solution.
4.3 Evaluation of the Clustering Algorithm In this section we evaluate the performance of the proposed hybrid clustering system. We compare it against its two constituent algorithms: EM and HAC. For the standalone EM we used random initialization and we have averaged the results across five runs (EM5)1 . Because EM5 and HAC require the number of clusters k as an input parameter, for both of them we have used the number of clusters k detected by the corresponding instance of the hybrid system. Table 3 lists the results for the three algorithms and the five test collections. The hybrid approach clearly outperforms the other two algorithms in all the test collections. 1
LAT 14 4 16 8
REU 11 4 40 93
REU-T10 8 6 20 10
SMART 6 6 24 4
Table 4: Number of clusters estimated by the hybrid approach and the Calinski method
Table 3: Comparison of three clustering algorithms: the hybrid approach (Hybrid), HAC, and EM with random initialization averaged over 5 runs (EM5)
E(ci ) = −
AP 10 12 28 11
The evaluation data is available at:
http://www.lsi.upc.edu/∼surdeanu/papers/kdd05 data.tgz
These results are a strong indication that the quality measures used to generate initial model candidates and the subsequent selection process are successful. The quality of the clustering solutions generated by the hybrid system is more than satisfactory considering that the proposed approach is completely unsupervised, including relative to the model dimension. We analyze the quality of the model dimensions detected by the hybrid system in the next section and we provide a more detailed analysis of the overall system behavior in Section 4.5.
4.4
Estimating the Model Dimension
While the previous section proves that the hybrid approach provides better clustering solutions than both HAC and EM with random initialization, one question remains unanswered: how does our approach compare against other unsupervised methods for the estimation of the model dimension k? To answer this question we have implemented the method proposed by Calinski and Harabasz [1], previously reported to be the best among a number of other unsupervised algorithms [5]. Calinski and Harabasz generate clustering models using a range of model dimensions k and choose the k that locally maximizes Equation 2. To guarantee that the Calinski method is directly comparable with our method we have used the same clustering algorithm, HAC, for both approaches. For a larger experiment we have also evaluated Calinski’s method when its clustering models are generated using EM with random initialization. Similarly with the previous section, for EM we have averaged the C scores (see Equation 2) across five runs. When it uses HAC to generate its clustering models, Calinski’s method is somewhat similar to our approach with a significant difference: Calinski uses clustering models that include all the documents in the collection, whereas we use only documents that are part of what we consider the best clusters, since we discard ambiguous documents that decrease the quality of clustering solution. Table 4 shows the number of clusters k estimated by our hybrid approach for the five evaluation collections, compared with the number of clusters estimated by the Calinski method using the two clustering algorithms, and the actual number of categories q. Table 4 indicates that the results obtained by Calinski’s method using EM with random initialization are fairly unsatisfactory: the model dimension is generally over-estimated and there is no relation between the estimated number, k, and the actual number of categories, q. On the other hand, when using HAC, Calinski’s method has the tendency to underestimate k. This issue is more visible in collections with a larger number of categories, like the two Reuters collections. For the larger REUTERS collection, our approach generates a k equal to 11. Although this value seems relatively far away from the actual number of categories (93), we consider it a good result: the top
Collection AP LATIMES REUTERS REUTERS-Top10 SMART
Quality Measure GW GW GWB GW GWN
Coverage 85% 55% 75% 90% 90%
Table 5: Quality measures and collection coverages detected by the unsupervised initial model selection component
11 categories in REUTERS cover over 94% of the collection documents.
4.5 Discussion Underestimating the model dimension can be a serious drawback for a real-world system because it reduces the number of categories recovered in the clustering solution. Potentially important categories may simply be dispersed among existing clusters instead of getting a cluster of their own, which makes them virtually invisible to the human analyst that browses the generated clustering solution. We believe that Calinski’s approach suffers more from this issue because the clustering models used cover all the collection documents, including ambiguous documents that minimize the distance between distinct (but close) categories. On the other hand, our method works only with documents that are part of the “best” clusters, i.e. dense clusters that are well separated from the rest of the collection. We have shown that this approach is beneficial for both the detection of the model dimension (see Section 4.4) and for the selection of an initial model for EM (see Section 4.3). One question that remains unanswered is: what is the best performance we can expect from such an unsupervised system? To answer this question we inspected the quality of the clustering solutions generated from all the initial model candidates (for all collection coverages γ and for all quality measures). We found that the upper limits for purity ranged from 75% (in LATIMES and REUTERS) to 92% (in SMART), and the upper limits for entropy ranged from 10% (in REUTERS-Top10) to 40% (in LATIMES). These relatively high upper limits on the system performance indicate that the proposed quality measures generate initial clustering models of good quality. Furthermore, the performance of our unsupervised method is, on the average, in the top 14% of all candidate models’ purities and top 21% of all entropies, which is a strong indication of the robustness of our approach. Although these results are certainly encouraging they indicate that the proposed method can be extended at least with a better performing selection component. Lastly, Table 5 lists the quality measures and collection coverages γ selected by the unsupervised system. Table 5 indicates that, if execution time is an important concern, a practical optimization of the proposed method that uses only one quality measure (GW ) would still have acceptable qualitative performance.
5. CONCLUSIONS This paper introduces a hybrid clustering approach that extracts the initial model for an EM algorithm from the dendrogram generated by a hierarchical clustering algorithm. The initial EM model is extracted in a two-step process.
First, a number of candidate models are generated by sorting the dendrogram clusters according to a battery of quality measures and extracting the top-ranked clusters for various collection coverages. Then, the candidate model that locally maximizes a global quality score is chosen as the initial model for the EM algorithm. The first novelty of the proposed method is that only the “best” clusters produced by the hierarchical algorithm are selected as the initial model of the expectation maximization algorithm. The second novelty is that our initialization algorithm generates not only an initial model but also an estimate of the model dimension, thus eliminating another important element of human supervision. An instance of our clustering algorithm has been empirically evaluated on five real-world document collections. The results show that our approach is always superior to both EM with random initialization and the hierarchical agglomerative algorithm. A comparison of our technique for estimating the model dimension with the Calinski and Harabasz method indicate that the latter prefers simpler models, while our approach tends to generate more complex models, which increases the number of categories recovered in the clustering solution.
6.
ACKNOWLEDGMENTS
This work has been partially funded by the European project CHIL (IP-506808) and the Spanish Ministry of Science and Technology project TIN2004-0171-E. Mihai Surdeanu is a research fellow within the Ram´ on y Cajal program of this ministry.
7.
REFERENCES
[1] T. Calinski and J. Harabasz. A dendrite method for cluster analysis. Communications in Statistics, 3:1–27, 1974. [2] A. P. Dempster, N. M. Laird, and D. B. Rubin. Maximum likelihood from incomplete data via the EM algorithm. Journal of the Royal Statistical Society, Series B, 39(1), 1977. [3] R. O. Duda and P. E. Hart. Pattern Classification and Scene Analysis. John Wiley and Sons, New York, 1973. [4] M. Meila and D. Heckerman. An experimental comparison of several clustering and initialization methods. In Microsoft Technical Report MSR-TR-98-06, 1998. [5] G. W. Milligan and M. C. Cooper. An examination of procedures for determining the number of clusters in a data set. Psychometrika, 50, 1985. [6] K. Nigam, A. McCallum, S. Thrun, and T. Mitchell. Text classification from labeled and unlabeled documents using EM. Machine Learning, 39(2/3), 2000. [7] E. Riloff. Automatically generating extraction patterns from untagged text. In Proceedings of the Thirteenth National Conference on Artificial Intelligence (AAAI-96), 1996. [8] T. G. Rose, M. Stevenson, and M. Whitehead. The Reuters corpus volume 1 - from yesterday’s news to tomorrow’s language resources. In Proceedings of the Third International Conference on Language Resources and Evaluation, 2002. [9] G. Schwartz. Estimating the dimension of a model. The Annals of Statistics, 5(2), 1978. [10] Y. Zhao and G. Karypis. Evaluation of hierarchical clustering algorithms for document datasets. In Proceedings of the International Conference on Information and Knowledge Management, 2002. [11] Y. Zhao and G. Karypis. Empirical and theoretical comparisons of selected criterion functions for document clustering. Machine Learning, 55(3), 2004.