School of Electrical and Computer Engineering, Center for Wireless Systems and ... Robert Bosch LLC Research and Technology Center (RTC) - North America.
A Kalman Filter Based Link Quality Estimation Scheme for Wireless Sensor Networks Murat Senel∗ , Krishna Chintalapudi† , Dhananjay Lal† , Abtin Keshavarzian† and Edward J. Coyle∗ ∗ School
of Electrical and Computer Engineering, Center for Wireless Systems and Applications (CWSA) Purdue University, West Lafayette, IN 47907 E-mail: {msenel, coyle}@purdue.edu † Robert
Bosch LLC Research and Technology Center (RTC) - North America 4009 Miranda Avenue, Palo Alto, CA 94304 E-mail: {Krishna.Chintalapudi, Dhananjay.Lal, Abtin.Keshavarzian}@us.bosch.com Abstract—Communication among wireless sensor nodes that employ cheap low-power transceivers is often very sensitive to the variations of the wireless channel. Sensor network routing protocols thus strive to continually adapt to temporal variations in wireless links in order to avoid wasteful transmissions over low-quality links. Such adaptive routing protocols must rely on a scheme that can not only accurately estimate the quality of wireless links in terms of a quantitative measure, such as the packet success rate (PSR), but also quickly adapt to temporal dynamics of the links. Traditionally, the PSR is estimated from the fraction of successful transmissions over a window of testpackets. However, we demonstrate that counting based methods do not react to changes in the wireless channel fast enough and that the only way to address this problem is to estimate the PSR based on the receiver’s characteristics and on the signal to noise ratio (SNR) at the receiver. We thus propose a scheme that uses a pre-calibrated SNR-PSR relationship and instantaneous SNR estimates to calculate the PSR of the link. In our scheme, each receiver continuously tracks the SNR using a Kalman Filter to minimize the estimation error and uses a locally available SNRPSR curve to estimate the PSR. Through extensive experiments we demonstrate that our scheme adapts to variations in the channel faster than counting-based PSR estimators and that it also provides better PSR estimates than these counting-based approaches.
I. I NTRODUCTION The vision that drives sensor network research is the proliferation of low-cost wireless devices that interact with the physical world to enhance the observability and controllability of the environment. Two crucial requirements that often dictate the behavior of these networks are self-organization and efficient power-management due to the low-power characteristic of these simple devices. The first step in designing an energy-efficient wireless sensor network is to ensure that routes exist among sensor nodes that can guarantee multi-hop communication while minimizing the energy expended in wasteful re-transmissions over lowquality wireless links. What makes the design of these routing mechanisms particularly challenging is the fact that sensor nodes typically employ inexpensive, low-power radios that operate at ”low” signal-to-noise ratios (SNRs). This makes
communication among the nodes much more susceptible to spatiotemporal variations in the wireless links ( [1]–[3] ). Thus, significant effort has been devoted to the design of routing mechanisms that adapt to the time-varying nature of wireless links ( [3]–[5] ). The success of any adaptive routing protocol invariably depends on two factors: i) A scheme that accurately measures the quality of a link (”link-quality”), and ii) A routing metric that uses the link-quality information to evaluate the relative efficiency of possible routes. The routing protocol needs to select the best routes based on the routing metric and adapt quickly to changes in the wireless links. Many researchers have focused on the design of routing protocols and related routing metrics for wireless ad-hoc and mesh networks. Expected Transmission Time (ETX) by DeCouto et al. [6], modified Expected Transmission Time (mETX) by Koksal et al. [2], per-hop Round Trip Time (RTT) by Adya et al. [5], Weighted Cumulative Expected Transmission Time (WCETT) by Draves et al. [4], and Required Number of Packets (RNP) by Cerpa et al. [3] are prominent examples of this work. Naturally, the framework and design criteria of these approaches depends on the characteristics of the wireless networks the authors are considering – usually IEEE 802.11a/b/g networks. In this paper we intend to consider wireless sensor networks and to take their more severe limitations into account. More importantly, it has been reported by Draves et al. [7], that routing mechanisms based on RTT and ETX do not react quickly enough in mobile-sender scenarios. We believe that the main limitation of these routing metrics is that they either rely on counting packets to estimate the packet success rate (PSR), such as ETX and ETX-variants, i.e., mETX and WCETT, or they probe the channel with unicast messages to discover high quality links, as is done in RTT. Even RNP, which takes the temporal characteristics of the wireless channel into account, basically counts the number packets sent before the packet is successfully received [3]. We demonstrate that such counting based approaches cannot adapt to changes in the
875 1930-529X/07/$25.00 © 2007 IEEE This full text paper was peer reviewed at the direction of IEEE Communications Society subject matter experts for publication in the IEEE GLOBECOM 2007 proceedings.
II. I LLUSTRATIVE E XAMPLE In this section, we use a simple example to illustrate why we believe that estimating packet success rate (PSR) with counting successfully received packets is not reliable. While a significant effort has been dedicated towards designing appropriate routing metrics, a surprisingly small amount of the literature questions the fidelity of the PSR estimate itself. The prevalent technique for estimating PSR involves counting the number of successful packet transmissions over a window of test-packet transmissions, e.g., if 9 packets out of the last 10 transmissions were successfully received, the link PSR is deemed to be 0.9. However, there is an approximately 26% chance that we received 9 packets successfully out of 10, when the true link PSR was actually 0.8 instead of 0.9, which can be calculated assuming a binomial distribution for the
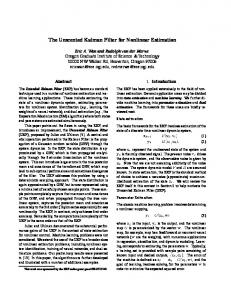
Channel Behavior in terms of RSSI vs. Time −85 RSSI (dBm)
wireless channel fast enough. Hence we propose an adaptive, light-weight channel-quality estimation scheme that should offer many benefits to link quality based routing schemes by feeding them accurate link quality information. Furthermore, our algorithm is especially well-suited for environments in which the wireless channel changes due to effects such as other nodes’ communications that cause interference or objects moving in the environment. Our goal is thus fast estimation of the channel characteristics of wireless links as a function of the signal-to-noise ratio (SNR). To account for the channel’s time variations, a Kalman filter is used to continually track the SNR while providing accurate estimates. The computational demands of the Kalman Filter are modest and fit well within the constraints of lowcomplexity sensor nodes, while preserving the adaptability to the dynamic nature of the wireless links. Kalman filters are very well understood, so our contribution is using them to estimate link quality in sensor networks. However, SNR alone cannot provide enough insight into the quality of the link, since the mapping between the SNR and the channel quality is dependent on the actual sensor hardware itself - and even on outside effects, such as temperature. Hence we map our SNR-estimate into a packet success rate (PSR) estimate via a precalibrated SNR-PSR mapping curve, and express our link quality metric in terms of this PSR-estimate. Through experiments, we observe that our scheme reflects the changes in the channel faster in the PSR estimate and it provides better PSR estimates than counting-based approaches, which we show are overly pessimistic and converge slower. We believe that our low-cost link-quality estimate in terms of PSR can be used by researchers to make their routing schemes adapt rapidly and accurately to changes in the wireless medium. This paper is organized as follows: Section II uses an example to illustrate the unreliability of counting-based linkquality estimation schemes. Section III provides a brief discussion of the behavior of wireless channels and their effect on PSR. Then, we introduce our system model in Section IV, present our link quality estimation scheme in Section V, and provide performance results in Section VI. We conclude with a discussion of future work in Section VII.
−90 −95 −100
1400
1600
1800
Fig. 1.
2000
2200 2400 Time (ms)
2600
2800
3000
3200
Channel Behavior
number of successfully received packets. In other words, there is an approximately 26% chance that our PSR estimate has an error of 10%. Thus, the PSR estimation scheme is prone to estimation error. To make matters worse, wireless links seldom remain constant, being subject to multi-path and interference effects. Inaccuracy in PSR estimates can lead to inefficient routes even though the routing metric may in itself be quite efficient. Another consequence of inaccurate PSR estimates are unnecessarily frequent route changes. A node may receive all 9 out of 10 packets correctly in one window and only 7 packets in the next even though the true PSR of the link never really changed and was 0.8 all the time. The routing scheme will infer this as a drop in the link’s PSR from 90% to 70% and switch to another route. Such switching creates overhead in terms of transmission of routing update messages. One solution to decrease the estimation error is to increase the number of test packets. However, this would result in an increased estimation latency and slow adaptability to channel dynamics. On the other hand, an attempt to decrease estimation latency will result in an increased estimation error. The only way to circumvent these fundamental limitations is to look into the functioning of the receiver that leads to the packet losses, rather than counting the number of successful transmissions. One way to achieve this is by measuring the SNR at the receiver and relating the SNR to the PSR of the link, which is our approach in this paper. III. E XPERIMENTAL O BSERVATIONS AND M OTIVATION In this section, we provide a brief description of the behavior of wireless channels supplemented by some of our observations from experiments conducted in a typical office environment. The experimental data was collected over a time span of 14 hours, while sampling the channel every 2 ms. We used standard sensor motes with IEEE 802.15.4 (ZigBee) compliant CC 2420 transceivers and MSP430 microprocessors and considered two settings: i) The transceiver-receiver pair has line-of-sight communications, and ii) They do not have line-of-sight. The observations in this section helped us design our PSR estimator. Fig.1 depicts typical behavior of the received signal strength (RSS) at the receiver when a transmitter sends packets every 2ms. The RSS is relatively constant but varies significantly, even in extremely short time durations of a few 100 ms. Through copious experiments we found that this variation is much larger for non-line-of-sight transmitter receiver pairs compared to those placed in line-of-sight. In several practical
876 1930-529X/07/$25.00 © 2007 IEEE This full text paper was peer reviewed at the direction of IEEE Communications Society subject matter experts for publication in the IEEE GLOBECOM 2007 proceedings.
PSR vs SNR curve
Packet Success Rate vs. Average SNR w. and w/o Line−of−Sight 1 0.9
0.7
0.8
0.6 0.5
Knee Point
Line−of−Sight 2
3
4
5 6 7 Average SNR (dB)
8
9
PSR
PSR
1
0.8
10
0.4
1 0.9 PSR
0.6
0.2
0.8 0.7
0
0.6 0.5
0
2
4
6
8 10 SNR (dB)
12
14
16
18
no Line−of−Sight 2
3
4
5 6 7 Average SNR (dB)
8
9
10
Fig. 3.
Fig. 2. Experimental Results on Average SNR vs. PSR for Line-of-Sight and Non-Line-of-Sight channels with PSR=89.19% and 86.73% respectively. TABLE I S TATISTICS OF OBSERVED SNR AND PSR VALUES FOR BOTH CHANNELS SN R
σSN R
P SR(%)
Line-of-Sight (Tx Power= -25 dBm)
6.21
0.84
89.19
Non-Line-of-Sight (Tx Power=0 dBm)
8.53
4.94
86.73
Setting
deployments, we have found that RSS variation can often be as large as 15-20 dB within an interval of few tens of seconds for non-line-of-sight wireless links. Fig.2 shows two scatter plots of SNR vs. PSR collected over 14 hours for the same transmitter-receiver pair in line-of-sight and nonline-of-sight settings. Each (PSR,SNR) sample is an average over 100 consecutive packets. As seen from Fig.2 the nonline-of-sight channel shows a much higher variation in SNR than the line-of-sight channel. The overall SNR and PSR averages obtained for the two scenarios are summarized in Table I. As seen in Table I, both channels show similar PSR characteristics, although the mean SNR (SN R) on the nonline-of-sight channel is higher than SN R on the line-of-sight channel – PSR on the high SNR and non-line-of-sight channel is even slightly lower. As stated in previous work by other researchers [2], we also conjecture that such a phenomenon is due to the higher variance of SNR on the non-line-of-sight channel. Therefore any realistic link quality metric should account for the variance of the SNR on top of its mean. In the next section, we will present our system model, and how we developed our metric while taking our experimental observations into consideration. IV. S YSTEM M ODEL The performance of a wireless communication link generally depends on two factors: i) Signal-to-noise ratio (SNR) at the receiver and ii) The hardware characteristics of the receiver. Hence we model the problem in two stages. A. SNR-Behavior at the Receiver Based on our observations on the channel behavior in Section III, we can conclude that neither instantaneous signalto-noise ratio (SNR) nor mean values are sufficient to fully
A Typical SNR-PSR curve
characterize the quality of the channel. Hence, we approached the problem from an estimation point of view, and we conjecture that our framework, which accounts for the mean and variance of the channel, give better insight into the behavior of the wireless link. We consider a static wireless network setting in which the received signal strength (RSS) at the receiver node at time point k can be modeled as follows1 : xk zk
= xk−1 + wk−1 = xk + vk ,
(1) (2)
where xk is the received signal strength (RSS) to be estimated at time k and zk is the RSS measurement obtained when a packet is received. The noise in the process is modeled with the Gaussian random variable wk−1 ∼ N (0, Q) with variance Q, and the measurement noise is captured by vk ∼ N (0, R), where R is its variance. As it can be seen in (1) and (2), we require two models: i) A model for the RSS behavior (1) and ii) A model for measurement errors (2) that can arise from measurement errors in the hardware and can be modeled as a Gaussian random variable. Having an estimate of RSS(dBm), SNR(dB) can be calculated by subtracting the noise floor(dBm) from the RSS estimate. B. Hardware Characteristics of the Receiver – SNR-PSR Map The efficacy of a receiver is often characterized by the SNRPSR curve (Fig.3), whose accuracy itself is subject to minor errors due to differences in hardware, temperature and nature of the interference from other wireless sources. Since we are trying to characterize the channel quality in terms of the packet success rate (PSR), the mapping between the RSS (or SNR) estimates and PSR is necessary. Hence a natural alternative to counting the number of successful packets is to estimate PSR by using this pre-calibrated SNR-PSR curve. We are aware that there are possible sources of error in estimating the PSR using the SNR-PSR curve: i) Variations in the Channel, ii) Error in RSS Measurements, and iii) Error in the SNR-PSR Curve. We believe, that our model of RSS(or SNR) estimation in (1) and (2) and careful pre-calibration efforts can overcome these 1 Note
that parameters in our model are all in dBm.
877 1930-529X/07/$25.00 © 2007 IEEE This full text paper was peer reviewed at the direction of IEEE Communications Society subject matter experts for publication in the IEEE GLOBECOM 2007 proceedings.
SNR Estimation
PSR Estimation
SNR Estimate Filter Measurement
Time Update
RSSI and Noise Samples
PSR Estimate
Fig. 4.
Proposed PSR Estimation Scheme
limitations. Hence we developed our PSR estimation scheme via the SNR-PSR mapping, which we will present in the next section. V. L INK Q UALITY A SSESSMENT BASED ON K ALMAN F ILTER Our system model in Section IV follows a two stage approach to characterize the link and identifies two main factors, i.e., SNR behavior and hardware characteristics. Hence, our proposed scheme accounts for these factors in two different stages (Fig. 4). In our algorithm, in the SNR-estimation stage, the system first applies a Kalman Filter to estimate the received signal strength (RSS) and then calculates the SNR by subtracting from this RSS estimate the noise floor estimate. Then, in the PSR-estimation stage, the SNR estimates from the SNR-estimation stage are mapped to a packet success rate (PSR) estimate. The details of both stages are described as follows: A. Kalman Filter based RSS Estimation For the system defined by (1) and (2), the update equations are as follows: ( [8]–[11]): • Time Update Equations: x ˆ− k
Pk− •
=x ˆk−1 ,
(3)
= Pk−1 + Q ,
(4)
Filter Measurement Equations: Kk x ˆk Pk x ˆ− k
= Pk− (Pk− + R)−1 , x ˆ− k
= + Kk (zk − = (1 − Kk )Pk− ,
(5)
x ˆ− k)
,
(6) (7)
where and x ˆk are the a priori and a posteriori estimates of RSS, respectively, Pk− and Pk are the a priori and a posteriori estimation error variances, and Kk is the Kalman Gain. An important advantage of Kalman Filters, which fits into the framework we are considering, is that that the Kalman Filter takes the variation in the process into account since the a-priori and a-posteriori error variances Pk− and Pk implicitly exist in the filter update equations,i.e., at each time point the
Kalman filter keeps track of Pk− and Pk and updates the estimates according to them. More importantly, the Kalman Filter is an iterative method to minimize the mean square error (MSE) in the process and is optimal in the mean square sense if the noise variables wk−1 and vk are Gaussian. Hence, this approach is especially well suited for our observations on the effect of variance on the channel quality presented in Section III, in particular in Fig. 2 and Table I. Naturally, the system needs the parameters Q and R to start the estimation procedure ((4) and (5)). Q can be estimated at an initialization process before starting the estimation procedure by computing the variance of xk −xk−1 over a set of test transmissions. Since it is possible for Q to change slowly over large periods of time such as several hours, it is reasonable to estimate Q periodically. Nevertheless, an error in the exact value of Q only effects the latency of convergence of the estimate and not its accuracy. In practice, it is also hard to estimate R, hence for our calculations we used the variance in the noise floor as R. Furthermore, for the Kalman Filter to be optimal, Pk− (or Pk ) needs to calculated, which implicitly includes the initial condition P0 [9]. However, due to the fact, that this initial covariance is not known, no Kalman Filter is optimal in practice, unless the signal-generator model is timeinvariant. In this case, it can be shown under certain conditions, that the filter can be asymptotically optimal, no matter what the initial guess on P0 is. A common practise is to use Q as the initial guess P0 [9]. B. SNR-PSR Mapping Upon receiving a packet, the RSS estimate is updated using the Kalman Filter update equations ((5)-(7)). This value, then, is mapped to a PSR value using the SNR-PSR curve. Obtaining this mapping before or at initial stages of deployment of the sensor motes can allow us to characterize the link quality in terms of PSR very fast by estimating the SNR performance of the system. Then the system will be more adaptable compared to the packet counting scheme, which takes some time until the successfully received packets are counted, during which the channel quality can change abruptly. VI. P ERFORMANCE OF THE P ROPOSED S YSTEM A. Experiment Setup We have evaluated the performance of our PSR estimation scheme through experiments conducted in an office environment in the non-commercial 2.4 GHz band with the same home-built sensor nodes in Section III. A typical experiment consisted of two nodes, a transmitter and a receiver that are not within line-of-sight of each other. A test-packet is transmitted by the the transmitter every 2ms consisting of transmitter id, a four byte packet sequence number and 10 bytes of fixed data. Upon receiving each packet, the receiver records the packet sequence number and the RSS (the RSSI measurement provided by CC2420). Furthermore, after receiving each packet the receiver samples the RSS 8 times successively and takes the average to obtain an estimate of the instantaneous noise power. Every 10ms the collected 3-tuples are sent over the UART to a PC for storage. Each experiment lasted 14 hours, and, in order to simulate sudden changes in the link quality, the transmitter abruptly reduces its transmission power by about 16dB, from 20dB to 4dB at pre-determined times. B. Experimental Results For demonstrating our results we have chosen a time-slice of 1000ms of SNR data. The transmission power was abruptly reduced by about 16dB at about 520ms from the start of the time-slice (Fig.5). The Kalman filter continuously tracks the RSS based on every packet it receives using the time and filter update equations, and the SNR is calculated by subtracting current noise floor estimate from the RSS estimate obtained from the Kalman filter. Fig. 5 depicts the functioning of our Kalman filter based SNR tracking at transmission intervals of η = 2, 4, 20 and 200ms (Fig. 5(b-e)) respectively, and it can be concluded that our Kalman filter based scheme tracks the variation in SNR very closely even at η = 200ms. For η = 200ms, the degradation in channel quality was detected only from the reception of a single packet at 600ms. On the other hand, it can also be observed in Fig. 5, that with more frequent updates (with lower update intervals η = 2 and 4ms), the estimates follow the channel behavior more closely (Fig. 5(bc)) and thus are more adaptable to the changes. However, the estimates with less frequent updates, η = 20 and 200ms, are smoother (Fig. 5(d-e)). For comparing the performance of our scheme with counting based PSR estimation schemes, we assume the following scenario: A routing algorithm requires a new link update from an underlying PSR estimator, where the PSR estimation
process involves periodically transmitting test-packets (or data packets), as it is common practise. We consider 2 cases: i) Counting successfully received packets, and ii) Our scheme, where we estimate the SNR upon receiving the test or data packets and feed these SNR estimates into the PSR-SNR map which is a piecewise constant function implemented as a lookup table as depicted in Fig. 6. In the case of counting, the rate of transmission of testpackets is λ packets/time, and this value can be reduced in order to save energy. With rate λ, the transmitter sends a packet every η = 1/λ, and the PSR is estimated based on Tη transmitted packets. We examine the performance of countingbased schemes for different values of η and a fixed value of T . Fig. 7(a) depicts the PSR estimates obtained by PSR estimation based on counting successful packets for η = 4, 10 and 20ms. Although the link quality degrades abruptly at 520ms by 16dB(indicated by the straight line) and the true link PSR drops significantly, estimators at all three window sizes converge at roughly around 950ms - almost 400ms after the link degradation, although the first indications of link degradation are seen around 600ms upon the reception of the first few packets in the degraded link. Due to the degraded channel quality, reception of packets and hence updates in the estimates become very infrequent. Furthermore, for smaller window sizes, higher variance in the link estimates is observed. On the other hand, the PSR estimates obtained by our proposed Kalman Filter based scheme can be seen in Fig. 7(b). One can conclude that our scheme is much quicker to reflect the changes in the link quality, because even a single packet reception can provide significant information with regards to the link PSR. The most striking result is depicted at the transmission interval of η = 200ms, when the link quality has been detected reasonably accurately based on only one packet. This is impossible to achieve based on any counting technique, since one packet can never reveal enough information to estimate PSR or reveal the fact that the link quality might have degraded. Most importantly, our scatter plots for a non-lineof-sight channel in Fig. 2, as well as our precalibrated PSRSNR curve in Fig. 6 show a PSR value between 0.7 − 0.8 for 4dB SNR. Since the SNR at the receiver dropped from 20dB to around 4dB (Fig.5), we expect to observe a drop in PSR from 1 to 0.7 − 0.8. Our scheme behaves consistently with
879 1930-529X/07/$25.00 © 2007 IEEE This full text paper was peer reviewed at the direction of IEEE Communications Society subject matter experts for publication in the IEEE GLOBECOM 2007 proceedings.
X: 520 Y: 1
0.5
Estimates calculated w. 50 packets 0
200
400
600
800
1000
1 0.5 Estimates calculated w. 20 packets 0
0
200
400
600
800
0.5 Estimates calculated w. 10 packets 0
0
200
400
600
800
1000
X: 520 Y: 1
0.5
Estimates calculated every 4 ms 0
200
400
600
800
1000
800
1000
800
1000
1 0.5 Estimates calculated every 20 ms 0
1000
1
1
0
PSRestimate
PSRestimate
PSRestimate
1
0
PSRestimate
PSR Estimates w. Kalman Filter Approach
PSRestimate
PSRestimate
PSR Estimates w. Counting
0
200
400
600
1 0.5 Estimates calculated every 200 ms 0
0
Time (ms)
200
400
600 Time (ms)
(a) PSR estimates based on counting for η = 4, 10 and 20ms, respectively
(b) PSR estimates based on the proposed scheme for η = 4, 20 and 200ms, respectively
Fig. 7. Performance of the proposed scheme vs. counting based PSR estimation schemes under sudden changes in the communication channel. We imposed a SNR drop of 16dB (from 20dB to 4dB at the receiver (Fig.5)) at 520ms, and expect a drop in PSR from 1 to 0.7 − 0.8 based on our experiments (see our scattered plot for non-line of sight channel in Fig. 2). We observe that our scheme alters the PSR much faster in response to changes in the channel than counting-based schemes. Furthermore, the counting-based schemes converge to PSR values that are clearly more pessimistic than they should be.
this expectation (Fig. 7(b)), and the counting-based schemes converge to PSR values that are clearly more pessimistic than they should be (Fig. 7(a)). VII. C ONCLUSION In this paper, we examined the problem of packet success rate (PSR) estimation, which is used in several routing schemes. We argue that schemes that estimate PSR by counting the number of successfully received packets are both slow to respond to abrupt changes in the wireless links and are also wasteful in-terms of the number of transmissions required to accurately estimate the PSR. To overcome these limitations, we proposed a Kalman filter based PSR estimation scheme that tracks the signal-to-noise ratio (SNR) of the link and uses a pre-calibrated SNR-PSR map to estimate the PSR. Our scheme has been validated through experiments and has been shown to require an order of magnitude fewer test-packets to react to changes in the link quality. Our contribution is that we provide a link quality estimate in terms of PSR via an adaptive light-weight scheme that researchers can use for their routing metrics to enable them adapt more appropriately to changes in the wireless medium. We are currently incorporating our scheme into standard routing methods to show the contribution of our framework to these routing mechanisms compared to ETX [6], mETX [2], WCETT [4], RTT [5], and RNP [3]. Furthermore, we are also investigating the possible performance improvement by using more complicated channel models, such as the timevarying, low-pass tapped delay line model for time-varying channel estimation [12]. We also plan to develop our own routing scheme to reflect the effects of channel variation and packet losses in the most efficient way.
R EFERENCES [1] D. Lal, A. Manjeshwar, F. Herrmann, E. Uysal-Biyikoglu, and A. Keshavarzian, “Measurement and Characterization of Link Quality Meterics in Energy Constrained Wireless Sensor Networks,” in Proceedings IEEE Globecom ’03, Dec. 2003. [2] C. E. Koksal and H. Balakrishnan, “Quality Aware Routing in TimeVarying Wireless Networks,” IEEE Journal on Selected Areas of Communication Special Issue on Multi-Hop Wireless Mesh Networks, vol. 24, no. 11, pp. 1984 – 1994, Nov. 2006. [3] A. Cerpa, J. L. Wong, M. Potkonjak, and D. Estrin, “Temporal Properties of Low Power Wireless Links: Modeling and Implications on Multi-Hop Routing,” in MobiHoc ’05: Proceedings of the 6th ACM International Symposium on Mobile Ad-Hoc Networking and Computing. New York, NY, USA: ACM Press, 2005, pp. 414 – 425. [4] R. Draves, J. Padhye, and B. Zill, “Routing in Multi-Radio, Multi-Hop Wireless Mesh Networks,” in MobiCom ’04: Proceedings of the 10th Annual International Conference on Mobile Computing and Networking. New York, NY, USA: ACM Press, 2004, pp. 114–128. [5] A. Adya, P. Bahl, J. Padhye, A. Wolman, and L. Zhou, “A MultiRadio Unification Protocol for IEEE 802.11 Wireless Networks,” in BROADNETS’04: Proceedings of the First International Conference on Broadband Networks. Washington, DC, USA: IEEE Computer Society, 2004, pp. 344–354. [6] D. S. J. D. Couto, D. Aguayo, J. Bicket, and R. Morris, “A HighThroughput Path Metric for Multi-Hop Wireless Routing,” in Proc. ACM Mobicom, San Diego, CA, Sep. 2003. [7] R. Draves, J. Padhye, and B. Zill, “Comparison of Routing Metrics for Static Multi-hop Wireless Networks,” in SIGCOMM ’04: Proceedings of the 2004 Conference on Applications, Technologies, Architectures, and Protocols for Computer Communications. New York, NY, USA: ACM Press, 2004, pp. 133–144. [8] R. E. Kalman, “A New Approach to Linear Filtering and Prediction Problems,” Trans. ASME Ser. D. J. Basic Eng., vol. 82, pp. 35 – 45, 1960. [9] A. V. Balakrishnan, Kalman Filtering Theory. Los Angeles, CA, USA: Optimization Software, Inc., 1987. [10] P. S. Maybeck, Stochastic Models, Estimation, and Control. 111 Fifth Avenue, New York, New York 100003: Academic Press, 1979, vol. 1, ch. 1, pp. 1–16. [11] G. Welch and G. Bishop, “An Introduction to the Kalman Filter,” Department of Computer Science, University of North Carolina at Chapel Hill, Chapel Hill, NC 27599-3175, Tech. Rep. TR 95-041, 1995. [12] S. M. Kay, Fundamentals of Statistical Signal Processing: Estimation Theory. Upper Saddle River, NJ, USA: Prentice-Hall, Inc., 1993.
880 1930-529X/07/$25.00 © 2007 IEEE This full text paper was peer reviewed at the direction of IEEE Communications Society subject matter experts for publication in the IEEE GLOBECOM 2007 proceedings.