19th European Symposium on Computer Aided Process Engineering – ESCAPE19 J. JeĪowski and J. Thullie (Editors) © 2009 Elsevier B.V. All rights reserved.
309
A LabVIEW-based intelligent system for monitoring of bioprocesses Elmer Ccopa Rivera, Félix de Farias Junior, Daniel Ibraim Pires Atala, Rafael Ramos de Andrade, Aline Carvalho da Costa, Rubens Maciel Filho School of Chemical Engineering, State University of Campinas, P.O. Box 6066, 13081970, Campinas, SP, Brazil,
[email protected],
[email protected]
Abstract The application presented in this study illustrates the usefulness of an automated monitoring system carried out in LabVIEW environment. The results obtained have show that it is possible to infer into a real-time basis the key variables in bioethanol fermentation using pH, turbidity, CO2 flow rate and temperature on line measurements and a MLP-based Software Sensor. On-line monitoring system provided accurate online predictions of the concentrations during the fermentation process even when the secondary variables measurements were noisy. This study also will illustrate the usefulness of an automated monitoring system carried out in graphical programming environment. Keywords: Modeling, bioreactor, software sensor, artificial intelligence.
1. Introduction Artificial intelligence, such as Artificial Neural Network (ANN) has been used successfully for solving biotechnological complex problems related to the field of measurements and instrumentation. Probably, the most popular ANN used in engineering applications is the Multilayer Perceptron Neural Network (MLP) due to its easily understandable architecture and a simple mathematical form, which results in an easy tool for modeling and implementation. In addition, it is known from previous works that MLPs can be used to offer adaptive solutions, since the reestimation of their parameters is a straightforward procedure [1]. By exploiting the relationship among the process variables of bioprocesses, MLPs could be used to implement advanced control techniques, such as software sensors, algorithms for on-line estimation of state variables and model parameters that are not measurable in real-time [2, 3]. This is a promising research area with significant impact on biotechnological industry, which requires an efficient monitoring with reliable sensors to control setting of the process. Thus, for a reliable performance prediction through modeling, the MLP-based software sensor should be implemented on a platform able to provide a powerful toolset for process identification and control with interface directly to instruments, sensor and actuators. A programme to fully automate the implementation of software sensors can be developed using a graphical programming environment, called LabVIEW (Laboratory Virtual Instrument Engineering Workbench). The LabVIEW has extensive library of functions and subroutines for most programming task. It also contains an application specific library for data acquisition, serial instrument control, data processing, analysis presentation and storage. Applications created with LabVIEW are referred to as virtual instruments (VIs) [4, 5].
310
E.C. Rivera et al.
In this study, it was used built-in LabVIEW function and library VIs to develop a software sensor based on MLPs for on-line monitoring of bioethanol production process. This program can be adapted to a wide range of instrumentation control and optimization applications. The proposed monitoring system is based on LabVIEW as driver software, the data acquisition system and the sensors for the secondary measurements (pH, turbidity, CO2 flow rate and temperature). The system collects the variables of the fermentation process by means of sensors. The measured values are delivered to the computer program through the data acquisition system for data processing and prediction of state variables (concentrations of biomass, product and substrate) using the MLP-based software sensor.
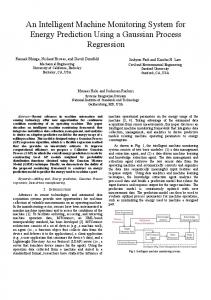
2. Materials and Methods 2.1. Experimental Procedure Eight batch experiments performed in the temperature range of 30- 38oC were used to develop the software sensors. Two other data sets at 36.8 and 31.2oC are then used for the validation and prediction test, respectively. Material and analytical methods for the determination of concentrations of biomass, bioethanol and substrate are described elsewhere [6]. On-line measurements were performed in the bioreactor and stored in the computer through a data acquisition board associated to a management software application implemented in LabVIEW version 6.1 (National Instruments, Austin, TX). The sample time was 3 min for all on-line data. Carbon dioxide flow rate was measured by a digital gas volumetric flow sensor, pH by glass pH-electrode, (both from ColeParmer Instrument, London, England). Production medium turbidity was measured by a turbidity transmitter (FSC 402 Mettler Toledo Ingold Inc., USA) and temperature by thermocouple (N. Brunswick Scientific Co.). 2.2. On-line monitoring system In this study, an intelligent system is developed with primary on-line sensors, which capture large volumes of real-time bioprocesses data and model building software package to use the knowledge content in the stored data. As shown in Fig. 1, the proposed on-line monitoring system comprises three essential elements: (i) An array of sensors of multisensor system, which consists of a bioreactor (Bioflow III System; New Brunswick Scientific Co., Inc., N.J., USA) of 3 L (working volume) where on-line sensors (pH, CO2 flow rate, temperature and turbidity) are placed. Features as relatively simple instrumentation, short measuring time and low prices make the primary on-line sensors to be a right choice for the approach proposed in this study. (ii) A communication module that transfers the measurement data from bioreactor to a monitoring and data acquisition system. That consists of devices to convert the protocol of the output of the primary sensors (serial digital signals from gas volumetric flow sensor, pH-electrode and thermocouple) from RS232C to TCP/IP via a National Instruments ENET-232/4. The received analog signal from Turbidimeter (analog input 0-20 mA) is also transformed to standard TCP/IP using a Field Point network module 1600. TCP/IP protocol (Transmission Control Protocol/Internet Protocol) facilitates the communication across the internet, even to remote access. (iii) The monitoring and data acquisition system, which monitor the bioprocess based on the built-in LabVIEW functions, library VIs and Artificial Neural Networks-based software sensor in a PC with a data acquisition card. This is a general-purpose graphical programming environment. Thus, the sampling and acquiring the measurement inputs from primary sensors (pH, CO2 flow rate, turbidity and temperature) and postprocessing of measured are performed in LabVIEW environment.
A LabVIEW-Based Intelligent System for Monitoring of Bioprocesses
311
Figure 1. Framework of the on-line monitoring system
This study makes use of a well-known intelligent technique such as Multilayer Perceptron Neural Network (MLP) to infer the state variables in bioethanol fermentation during the postprocessing stage. 2.3. MLP-based software sensor In this work, the structure using three neural networks, one for each output (concentration of biomass, X, substrate, S, and bioethanol, P), was chosen. The inputs for the neural networks were five: pH (pH) turbidity (Tb), CO2 flow rate (F), temperature (T) and time (t). By Cybenko's theorem [7] it follows that all continuous functions can be approximated to any desired accuracy with a network of one hidden layer of sigmoidal hidden neurons and a layer of linear output neurons. Such structure is used in this work. MLP-based software sensor can be mathematically written in the form:
· § N y j = f¨ w ji x i + ș j ¸ = ¸ ¨ ¹ © i=1
¦
§ ¨ concentration = G¨ ¨ ©
1 § −((w M1×pH)+ (w M2 ×Tb) + (w M3 ×F) · ¨ +(w ×T) + (w ×t)+ș ¸ M5 M ¹ 1 + exp © M4
· ¸ Wkj y j + ȕ k ¸ , (j = 1,...,M), (k = 1) ¸ j=1 ¹
(1)
M
¦
(2)
where wji is the weight connecting the ith neuron in the input layer and the jth neuron in hidden layer. wj is the bias of the jth neuron in the hidden layer. Wkj is the weight connecting the jth neuron in the hidden layer and the kth neuron in the output layer. Wk is the bias in the kth neuron in the output layer. f(⋅) and G(⋅) are the sigmoidal activation functions of the jth neuron in the hidden layer and of the kth neuron in the output layer, respectively.
E.C. Rivera et al.
312
Small random values are used to initialization of weights and biases. Subsequently, the standard backpropagation learning algorithm, based on a gradient descendent method implemented in FORTRAN is employed to train each network describing the concentrations (Eq. 2). In this study, both input and output data were normalized to the range [0.1, 0.9]. The number neurons in the hidden layer was varied from 10 to 70, and the optimal number chosen by the cross-validation criterion with the number of epochs fixed at 2000 for all the studied architectures. The neural network with sixty hidden nodes for describing biomass concentration, forty hidden nodes for describing substrate concentration, and twenty hidden nodes for describing bioethanol concentration were found to present the lowest mean square error for the validation sample. The learning rate η, and the momentum coefficient α, used in this work were optimized both to be 0.95 in the backpropagation learning. After training, the appropriate network architecture and the parameters set (weights and biases) are saved in a file. This information is used as an input to a program that is written in Phyton to an automatic conversion of the optimal MLP model into a program based LabVIEW formula node that is used to infer the concentrations of biomass, substrate and bioethanol.
3. Results and Discussion
6.0
(m /h)
4.5 3
CO2 flow rate x 10
-6
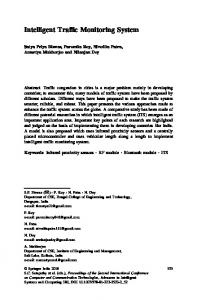
Figure 2 shows the profiles of on-line measurements in the batch fermentation at 31.2oC used for the prediction test.
3.0 1.5 0.0 0
5
Turbidity (%)
15.0
11
16
21
26
21
26
21
26
Time (h)
12.3 9.5 6.8 4.0 0
5
6.5
11
16
Time (h)
pH
5.9 5.3 4.6 4.0 0
5
11
16
Time (h)
Figure 2. On-line primary sensor measurements at 31.2oC.
The prediction test results from the software sensor-based scheme are illustrated in Figure 3 and quantified through of the R.S.D. (Residual Standard Deviation) [2]. As can be seen in the Figure 3, the software sensor has a good agreement with the experiment data and it has not been affected by the noise of any input.
3
Biomass (Kg/m )
A LabVIEW-Based Intelligent System for Monitoring of Bioprocesses 9
R.S.D.(%) = 10.1
7 5 2 0 0
5
11
210 3
TRS (Kg/m )
313
R.S.D.(%) = 25.4
16
22
27
22
27
22
27
Time (h)
158 105 53 0 5
11
R.S.D.(%) = 17.8
3
Ethanol (Kg/m )
0 80
16
Time (h)
60 40 20 0 0
5
11
16
Time (h)
Figure 3. Experimental (cell mass, X (Ŷ); substrate, S (Ÿ) and ethanol, P (Ɣ)) and software sensors (solid lines) results.
4. Concluding Remarks This paper presents results from the implementation and testing of a PC based monitoring system for a bioethanol production process using MLP-based software sensors. The system is based on an array of primary sensor, a communication module and a monitoring and data acquisition subsystem. This integrated framework provides a real-time monitoring solution, which is one of the most important aspects of the decision making in the strategies of optimization and control of bioprocesses. A LabVIEW data acquisition module is implemented to read all influencing variables, which are first used to train the MLPs. The optimal MLPs architecture is placed in a LabVIEW based program formula node that monitors the concentration of biomass, bioethanol and substrate. The LabVIEW-based intelligent system represents thus a robust model-based approach which is expected to contribute for improving the implementation of suitable operating strategies of optimization as well as advanced control to achieve high operational performance.
5. Acknowledgements The authors acknowledge FAPESP (process number 06/51646-4), and CNPq for financial support.
314
E.C. Rivera et al.
References [1] E.C. Rivera, A.C. Costa, R.R. Andrade, D.I.P. Atala, F. Maugeri Filho and R. Maciel Filho, 2007, Development of adaptive modeling techniques to describe the temperature-dependent kinetics of biotechnological processes, Biochem. Eng. J., 36, 157-166. [2] J.C.B. Gonzaga, L.A.C. Meleiro, C. Kiang and R. Maciel Filho, 2009, ANN-based softsensor for real-time process monitoring and control of an industrial polymerization process, Comput. Chem. Eng., 33, 43-49. [3] M. W. Lee, S.H. Hong, H. Choi, J.H. Kim, D.S. Lee and J.M. Park, 2008, Real-time remote monitoring of small-scaled biological wastewater treatment plants by a multivariate statistical process control and neural network-based software sensors, Process Biochem., 43, 1107-1113. [4] G.W. Johnson, LabVIEW graphical programming: Practical applications in instrumentation and control, McGraw-Hill, New York, 1994. [5] J.S. Alford, 2006, Bioprocess control: Advances and challenges, Comput. Chem. Eng., 30, 1464-1475. [6] R.R. Andrade, E.C. Rivera, A.C. Costa, D.I.P. Atala, F. Maugeri Filho, and R. Maciel Filho, 2007, Estimation of temperature dependent parameters of a batch alcoholic fermentation process, Appl. Biochem. Biotech., 136-140, 753-763. [7] G. Cybenko, 1989, Approximation by superpositions of a sigmoidal function, Math. Control Signal 2, 303-314.