University of Texas at Dallas, Richardson, TX 75080, USA. {gang.liu; chi.zhang; john.hansen}@utdallas.edu. Abstract. One of the major challenges of the ...
Odyssey 2012 The Speaker and Language Recognition Workshop 25-28 June 2012, Singapore
A Linguistic Data Acquisition Front-End for Language Recognition Evaluation Gang Liu, Chi Zhang and John H.L. Hansen Center for Robust Speech Systems (CRSS) Erik Jonsson School of Engineering & Computer Science University of Texas at Dallas, Richardson, TX 75080, USA {gang.liu; chi.zhang; john.hansen}@utdallas.edu
Abstract
help us to properly use these data cooperating with the limited CTS data. However, a data purification step, which includes the removal of music and non-target language3 and ensures the speaker diversity, etc., is very crucial before these raw data can be used for any further language identification-oriented pattern recognition application. Several studies have focused on such data acquisition approach. However few of them proposed the systematic approach to address the data purification issue [3][4]. In this study, a systematic acquisition approach is proposed to obtain BNBS data from the broadcast data. The remainder of this paper is organized as follows. First, the characteristic of Voice of America (VOA) data and the objective of this study are introduced in Sec. 2. The proposed data purification front-end is illustrated in Sec. 3. Evaluations of the proposed algorithm are presented in Sec. 4. Finally, conclusions is presented.
One of the major challenges of the language identification (LID) system comes from the sparse training data. Manually collecting the linguistic data through the controlled studio is usually expensive and impractical. But multilingual broadcast programs (Voice of America, for instance) can be collected as a reasonable alternative to the linguistic data acquisition issue. However, unlike studio collected linguistic data, broadcast programs usually contain many contents other than pure linguistic data: musical contents in foreground/background, commercials, noise from practical life. In this study, a systematic processing approach is proposed to extract the linguistic data from the broadcast media. The experimental results obtained on NIST LRE 2009 data show that the proposed method can provide 22.2% relative improvement of segmentation accuracy and 20.5% relative improvement of LID accuracy.
2. VOA Data Description and Objective
1. Introduction
One of the current trend in language recognition is that, the majority of the broadcast data comes from recorded broadcast shows (e.g. voanews.com). Original media data include a great portion of music. We have to deal with this problem and select only clean broadcast speech segments. Another problem we should address is the low speaker variability in the broadcast data, for example news programs, which are reported by the the very limited journalists. So speaker diversity needs to be considered for acquiring the training data for LRE from the VOA broadcast shows. Another serious problem for such broadcast multilingual data is that it often includes non-target languages due to the natural diversity of the broadcast program’s nature. The VOA data has generally two type of speech data: 1) broadcast wide-band speech (usually from anchor speaker), 2) broadcast narrow-band speech (usually from audience). To make sure the selected training data is telephone speech without music corruption and with sufficient speaker variability, the proposed approach in this study focuses on the data of latter type, that is BNBS data. (One explanation of focusing on such telephone speech is that it is more challenging and realistic.) To conduct analysis and performance evaluations of the proposed algorithm, only labeled VOA34 data, which include 16 languages5 are used in this study.
The latest language recognition studies have shown that both acoustic [1][2] and phonotactic approaches have reached a certain mature level in both modeling of target languages and dealing with the influences of different channels. However there is an existing critical problem for language recognition applications: the lack f well-constructed training data. For many target languages, there is very limited amount of training data available. National Institute of Standards and Technology (NIST) has conducted a number of automatic language recognition evaluations (LRE). The goals of these evaluations are: exploring promising new ideas in language recognition; developing advanced technology incorporating these ideas; and measuring the performance of this technology. The latest trend of such evaluations (i.e, LRE2009, LRE2011) involves conversational telephone speech (CTS) and broadcast narrow-band speech (BNBS). The latter generally involves audience telephoning into the broadcast studio or journalists’ reportage. So this study is set in the environment of NIST LRE to facilitate the potential comparison. Furthermore, this study also provide an approach to collect training data easily for other data demanding research, such as speaker recognition. For the challenging task of NIST LRE, multilingual broadcast program is an ideal raw data source for such research pursuit. An effective and efficient data acquisition approach may This project was funded by AFRL under a subcontract to RADC Inc. under 88ABW-2011-5016 and partially by the University of Texas at Dallas from the Distinguished University Chair in Telecommunications Engineering held by J. Hansen. 1 http://www.itl.nist.gov/iad/mig/tests/lre/2009/LRE09 EvalPlan v6.pdf 2 http://www.nist.gov/itl/iad/mig/upload/LRE11 EvalPlan releasev1.pdf
224
3 The non-target language is the language which is different from the interested broadcast language. For example, in a Cantonese broadcast show, Mandarin or any non-Cantonese language exist as non-target languages. 4 LDC2009E40 NIST LRE 2009 BN Training Data 5 Bosnian, Creole, Croatian, Dari, French, Georgian, Hausa, Hindi, Pashto, Farsi, Russian, Spanish, TTAm (Talk To America), Turkish, Ukrainian, Urdu
VOA broadcast show 1 VOA broadcast show 2
Telephone Speech Detection
Removal of Music Corrupted Telephone Speech
Step 1
Step 2
VOA broadcast show N
Seg. 1
Seg. 2
Seg. 1
Seg. M1
Seg. 2
Seg. 1
Seg. M2
Seg. 2
Seg. MN
Segment 1
Removal of Non-target Language
Removal of Repeated Segments
Speaker Diarization
Segment 2
Segment K
Step 3
Step 4
Figure 1: Flow Diagram of the Proposed Data Acquisition Front-End for the nth Target Language
3. Proposed Data Purification Front-End
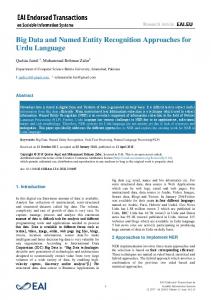
property of telephone speech and wideband speech were analyzed. The spectrogram of a clip of VOA audio having both wideband and telephone speech is shown in Fig. 2. The vertical red line indicates the start point of the broadcast telephone speech, while the vertical green line indicating the end of the segments of broadcast telephone speech. Unlike the wideband speech, the telephone speech has rare energy distributed below 300 Hz. Although there are some frequency component leakage below 300 Hz due to the non-ideal property of the bandpass filter, it is much less than that of wideband speech. This property of lower frequency range is more discriminative than that of higher frequency range proposed in [3]. Based on this observation, a discriminative feature is proposed to detect the boundary between wideband and telephone speech with only 0-4 kHz spectral information is available (this property is still preserved when the sampling frequency is beyond 8 kHz). The energy ratio (Ratioi ) between frequency band (0-200 Hz) and (200-400 Hz) is calculated for ith frame (20 ms with 10 ms update rate). Then, the current feature value (EnRi ) was calculated as the median value of the frame energy ratio(Ratioi ) within 5 sec. range centered on the current frame. This median filter smoothing is necessary for a universal threshold value works across all the broadcast shows. This process can be illustrated by Eq. 1.
Broadcast media has abundant data for linguistic data acquisition. However, due to the huge amount of data (for LRE11, VOA data accounts for 1.7 TB, i.e., 65,000 hours) for acquisition and limitation of prior knowledge of content, the approach is restricted to be computationally efficient and less intensive modeling algorithm. With these restrictions, to fulfill the goal described in Sec. 2, the approach illustrated in Fig. 1 for nth language is proposed in this study. The whole procedure can be divided as the following four steps. Step 1: assuming for the broadcast data of one language, there are N VOA broadcast shows. In each VOA broadcast show, all continuous telephone speech which is longer than 30 sec. will be truncated into exactly 30 sec. segments; Step 2: the selected segments are examined to exclude the music corrupted segments; Step 3: the non-target language segments are removed from the segments obtained from Step 2; Step 4: assuming for nth VOA broadcast show there are Mn segments passed through previous steps, these segments will be compared with segments from other shows in feature value obtained in previous steps to exclude the segments which were re-broadcasted. At last, for segments from each VOA broadcast show, the speaker diarization is performed to remove the redundant speech segments from the same speaker. 3.1. Detection of Telephone Speech
Frequency (kHz)
3
WBS
BNBS
WBS
BNBS
1
0
5
10
15 Time (sec.)
20
25
=
(1)
After detection of telephone speech segments, for each of VOA program records, several segments are selected as potential clean broadcast telephone speech. However, due to the variability of music broadcasted in VOA program, some segments of music or music corrupted telephone speech shares similar EnR as pure broadcast telephone speech does. Therefore, a processing step which exclude the pure music segments and music corrupted segments is necessary. In our study, a feature named variance of spectrum flux (VSF)[5] is deployed to detect the music segments or music corrupted telephone speech. The spectrum flux (SF) [6][7] is the ordinary Euclidean norm of the delta spectrum magnitude, which is calculated as (N −1 ) 12 1 ∑ 2 SFi = ∥Si − Si−1 ∥2 = (Si (k) − Si−1 (k)) N k=0 (2) where Si is the spectrum magnitude vector of frame i, N is the size of the windowed frame. Actually, the SF itself cannot re-
2
0
EnRi
Energyi (0 − 200) ; Energyi (200 − 400) median(i−250)≤j≤(i+250) (Ratioj );
3.2. Detection of Music Corrupted Telephone Speech
Spectrogram of a 30 sec. clip Broadbcast Narrowband Speech (BNBS)
Wideband Speech (WBS)
=
A threshold of EnR is selected to detect the segments of potential telephone speech. In this study, based on the randomly selected and manually labeled 100 broadcast shows, the threshold value is selected as 0.16. The segments which are larger than 30 sec. and having feature of frames less than the threshold, are selected as potential telephone speech segments.
One of the telephone channel’s characteristics is that it acts like a bandpass filter, which passes energy between approximately 300 Hz and 3.4 kHz. On the other hand, regular wideband speech contains significant energy up to around 5 kHz. In [3], the detection of telephone speech was performed by deploying a energy ratio between frequency range of (2350-3475 Hz) and frequency range of (3475-4600 Hz). A threshold was selected to detect the boundary between wideband and telephone speech. However, for LRE11, the provided VOA data were sampled at 8 kHz rate. Thus the spectral content is only distributed within the frequency range of 0-4 kHz . The ratio deployed in [3] is not applicable for the LRE11 data. In this study, the spectral 4
Ratioi
30
Figure 2: Spectrogram of a VOA clip having both wideband and telephone speech
225
language Ln . In case labeled language data available, bootstrap target-language selection is also feasible in the same manner. It is noted that, for the data used in this study, only 15% of raw data is preserved after the first step. Therefore, the less intensive modeling technique, like GMM training and scoring, is tolerable.
flect major differences between speech and music. It is observed Waveform of a 30 sec. clip 1 Speech
Music
Music Corruptated Speech
Amplitude
0.5 0 −0.5
3.4. Speaker Balance
−1 0
5
10
15 Time (sec.)
20
25
30
3.4.1. Removal of Repeated Segments
30
As described in Sec. 2, some VOA programs are rebroadcasted and recorded and then viewed as a new broadcast content in raw data. Therefore, after telephone speech detection and musical segments removal, there are some repetition of telephone speech among the selected segments. For the selected segments, the features of averaged EnR, VSF and SF are obtained during the previous steps. By comparing the features of the obtained segments between the broadcast shows, we can identify the segments with identical feature values, which can be viewed as the repeated segments. Only one copy of the repeated segments and the segments with unique feature values are preserved for the later processing.
Spectrogram of a 30 sec. clip 4 Speech
Frequency (kHz)
Music
Music Corruptated Speech
3 2 1 0
0
5
40
15 Time (sec.)
20
25
Figure 3: Spectrogram of a VOA clip having both wideband and telephone speech that speech alternates between transient and nonperiodic speech to short-time stationary and periodic speech due to the phoneme transitions (e.g., consonant to vowel, and other phone class transitions). On the other hand, music and environmental sounds could be periodic or monotonic and have more constant rates of change versus that seen in speech. A music corrupted segment is shown in Fig. 3, which include the two music corruption cases: music show up in the foreground (only music is played) and background (speech is corrupted by music played in background). This means the VSF of speech should be larger than that of music or most environmental sounds[5]. In this study, the VSF is calculated for each selected 30 sec. segment. If the VSF of a segment is less than a selected threshold, the segment is detected as pure music segment. On the other hand, some 30 sec. segments have both music and telephone speech, even music corrupted telephone speech. In this case the VSF may still be larger than the selected threshold due to the relevant amount of telephone speech existing in the segment. These segments can not be treated as training data due to the partial corruption of music. To cope with this problem, the SFi of a segment is ascending sorted. The first one third of SFi are used to calculate the averaged value, SF 1 . If the SF 1 3 3 is less than a selected threshold, then the segment is viewed as containing music. This approach is deployed together with the VSF threshold method to remove the music corrupted segments.
3.4.2. Speaker Diarization After removal of repeated segments, each selected segment is unique. Therefore, the probability of repetition of speaker between broadcast shows has been reduced. However, within a broadcast show, the conversations between call-in audience and the anchor speaker usually take place in several turns. Therefore, several telephone segments from same call-in speaker may be selected as training data. To further reduce the speaker repetition and keep speaker variability, a speaker diarization is implemented on the platform LIUM [8]. After the speaker diarization, the segments identified with the same speaker will be grouped together and only the segment with the best quality (in terms of feature defined in Step 1 through 3) is reserved.
4. Experimental Performance To evaluate the performance of the proposed approach in acquisition of linguistic data from broadcast media, two experiments were carried out in this study. Both of them were implemented on the same VOA3 data source. Since the “TTAm” (Talk To American) programs contain many non-American English (based on manually audition, 35% of TTAm data are nonAmerican English), only the broadcast data of other 15 language were used in this study. The proposed approach (termed as CRSS) is compared with the label information released by LDC, which is provided in the format of label files for NIST VOA3 data [3].
3.3. Non-target Language Segments Detection For international broadcast programs, non-target language is almost an indispensable flavor. It may come from code switching of the call-in broadcast audience, or from the news interview of non-target language speakers. To make sure the training data is consistent in language, such outlier samples should be detected and removed from training data pool of each target language. For the nth target language Ln , a Gaussian mixture model, GMMn , is trained using the segments of language Ln obtained from the previous steps. Then each of these segments is compared and scored against the GMMn . Since only a small fraction of the training segments of GMMn are non-target language segments and are expected to be scored lower against GMMn , we can only keep the segments which are scored higher against GMMn to make sure the language data purification for
4.1. Experiment I: Segmentation Accuracy Due to the extremely high cost of manually auditing and labeling all broadcast shows, without loss of generality, a random data selection manner is employed here: six broadcast shows are randomly selected for each of the 15 target languages. Each of broadcast shows is manually audited and labeled to provide the ground truth of the content types (wideband speech, music, BNBS, etc.) of broadcast shows. All the labeled target segments contain only broadcast telephone speech, that is without any music, speech from anchor speaker or non-target language. The segmentation accuracy is measured by the equal error rate (EER), which is obtained from false alarm rate and miss detec-
226
tion rate. The calculation of false alarm rate and miss detection rate can be expressed as following: Miss Detection Rate
=
False Alarm Rate
=
Table 1: Segmentation and LID performance Comparison EXP. I: EXP. II: Acquisition Equal Error Rate LID Method (%) Performance (%) LDC Released 4.91 9.27 CRSS Result 3.82 7.37 Relative 22.2 20.5 Improvemnet
Missed Seg.# × 100%(3) Ground Truth Seg.# False Alarm Seg.# × 100% (4) Obtained Seg.#
where Missed Seg. # is the number of segments missed detected in the segmentation results, Ground Truth Seg. # is the total number of desired segments obtained by manual detection, False Alarm Seg. # is the number of segments which are not broadcast telephone speech but false detected as broadcast telephone speech, and Obtained Seg. # is the total number of automatic detected segment. The results in EER are shown in Table 1.
phone speech collection. However, BNBS data, unlike CTS data, is not designed for language identification or other speechrelated research, so a well-structured data acquisition approach is necessary before the broadcast show can be used as a reliable and high quality data source to convey the language traits useful for language model training. This study is trying to overcome this obstacle by a cost-efficient and systematic approach. After the processing of the proposed approach, the redundant and misleading information is removed, which is very critical for the success of any pattern recognition system. The experimental results show the proposed method can offer consistent better performance. Noting that instead of presenting the state of the art performance in LID, this study is trying to provide an approach of data purification for broadcast data which will enhance the recognition performance in the latter tasks, the training data used for LID system in this study is BNBS only, not using CTS data which is more homogeneous in acoustic properties. Furthermore, the speaker diarization was only performed on each entry of recorded broadcast show not between the shows. It can be performed between different shows as well if more computational source is available, which will further purify the training data in speaker balance. Therefore, although the EER results shown in this study is higher than the EER achieved by the state of the art techniques for LRE09 task, the approach proposed in this study still illustrate an effective data purification method which will lead an improved performance in recognition task. As the next step of this study, other media source like movies or TV can be investigated since the latter are more popular media source than broadcast. It is also noticed that speaker/language share some common features, and a proper selection of such feature can make the system completely avoid using blind model training method.
4.2. Experiment II: LRE Performance To further compare the effectiveness of the two approaches in a more comprehensive way, a LRE system was trained using the segments obtained by two approaches respectively to carry out the second experiment. It is assumed that the more purified training data will model the language better and obtain better performance for language identification task. The evaluation data are from the corresponding 15 target languages of NIST LRE09 with nominal 30 sec. duration. For each speech segment, standard MFCC features (including C0) are extracted and followed by the Shifted Delta Cepstral (SDC) coefficients with usual 7-1-3-7 configuration to form the 56-dimension MFCC-SDC feature. All features are then grouped together to train a GMM with 1024 mixtures. Then the 600-dimension iVector features are extracted as described in [1]. After deriving iVector feature, a Gausssian generative model is employed as back-end classifier. To be specific, the Gaussian generative model based classifier is described as: 1 1 lnp(x|l) = − xT Σ−1 x + xT Σ−1 µl − µTl Σ−1 µl + const, 2 2 (5) where x is iVector, corresponding to a test utterance, the model information for language l is learned by the parameter µl (the mean of the iVectors for the training data of language l), Σ(common covariance matrix computed from the iVectors of all the training languages data), const is a constant number which make the equation is satisfied and can be set to zero for the convenience of computation. The system performance is measured by Equal Error Rate (EER). The results are summarized in the right column of Table 1.
6. References [1] N. Dehak, P.A. Torres-Carrasquillo, D. Reynolds, and R. Dehak, “Language recognition via ivectors and dimensionality reduction,” in Interspeech 2011, Aug. 2011, pp. 857 –860.
4.3. Results and Analysis From Table 1, it can be observed that, from the aspect of segmentation accuracy, the proposed CRSS approach has 1.09% absolute EER reduction (22.2% relative improvement) compared with LDC released results. Due to the expensive cost and random nature of the Experiment I, a comprehensive experiment like Experiment II is necessary. A 1.9% absolute improvement (20.5% relative improvement) is observed when compared with LDC released results. In terms of two accuracy metric, the proposed segmentation approach can offer consistent better performance.
[2] Niko Brmmer, Albert Strasheim, Valiantsina Hubeika, Pavel Matejka, Luks Burget, and Ondrej Glembek, “Discriminative acoustic language recognition via channelcompensated gmm statistics.,” in INTERSPEECH’09, 2009, pp. 2187–2190. [3] Oldˇrich Plchot, Valiantsina Hubeika, Luk´asˇ Burget, Petr Schwarz, and Pavel Matˇejka, “Acquisition of telephone data from radio broadcasts with applications to language recognition,” in Proceedings of the 11th international conference on Text, Speech and Dialogue, Berlin, Heidelberg, 2008, TSD ’08, pp. 477–483, Springer-Verlag.
5. Conclusion and Discussion The introduction of BNBS data into linguistic data acquisition is a good alternative to the usual expensive conversation tele-
[4] Luis Javier Rodrłguez-Fuentes, Mikel Peagarikano, Germn
227
Bordel, Amparo Varona, and Mireia Dłez, “Kalaka: A TV broadcast speech database for the evaluation of language recognition systems.,” in LREC’10, 2010, pp. 1895–1898. [5] Rongqing Huang and J.H.L. Hansen, “Advances in unsupervised audio classification and segmentation for the broadcast news and NGSW corpora,” Audio, Speech, and Language Processing, IEEE Transactions on, vol. 14, no. 3, pp. 907 – 919, may 2006. [6] Jr. Gray, A. and J. Markel, “Distance measures for speech processing,” Acoustics, Speech and Signal Processing, IEEE Transactions on, vol. 24, no. 5, pp. 380 –391, oct 1976. [7] G. Tzanetakis and P. Cook, “Multifeature audio segmentation for browsing and annotation,” in Applications of Signal Processing to Audio and Acoustics, 1999 IEEE Workshop on, 1999, pp. 103 –106. [8] S. Meignier and T. Merlin, “LIUM spkdiarization: an open source toolkit for diarization,” in CMU SPUD Workshop, Dallas (Texas, USA), mars 2010.
228