A Mapping Function for Variable-Scale Maps in Small-Display Cartography Lars HARRIE 1, L. Tiina SARJAKOSKI 2 and Lassi LEHTO 2 1
National Land Survey of Sweden, SE-801 82 Gävle, Sweden -
[email protected] 2 Finnish Geodetic Institute, P.O. Box 15, FIN-02431 Masala, Finland
[email protected], -
[email protected]
Abstract: The aim of this paper is to examine the variable-scale method of presenting geodata for personal navigation using small-display mobile devices. Ideally, the user should have a large-scale map of his immediate vicinity for choosing the right direction at an intersection, for example. At the same time, the user requires a small-scale overview map where he can see his destination. A solution that meets these requirements is a variable-scale map, which is constantly updated to keep the user’s position in the large-scale area at the centre of the map. In this paper, a variable-scale mapping function is derived in accordance with some specific properties; then characteristics of the mapping function are visualised. Furthermore, real-time generalisation methods are used to adapt the original cartographic data to the small-scale areas of the variable-scale map. A prototype system of a variable-scale approach was created using the emerging XML-based vector-data standards (GML and SVG), where the generalisation and scale-variations were performed in an XSLT transformation. The prototype implementation of variable maps was tested in a case study. Finally, the potential and the limitations of variable-scale maps for personal navigation using mobile devices are discussed.
1 Introduction In the near future an increasing number of maps will be displayed on portable computers and mobile telephones. These maps are often referred to as mobile maps. A major problem with mobile maps is their small displays, which put high demands on the selection of cartographic data to be shown. This becomes problematic when the user requires a considerable amount of cartographic information. In personal navigation, for example, users often need both a detailed map of the area surrounding the current position as well as an overview map. This means, in cartographic terms, that the user requires both large-scale and small-scale cartographic data. This paper concentrates on a method of giving the user both large-scale and small-scale map information simultaneously on a small portable display. The paper is based on the previous paper by the authors (Harrie, et al., 2002). In principal, there are, three approaches to providing the user with both large-scale and small-scale maps on a single display: 1) The user switches between a small-scale map and a large-scale map. Advantage: Full view of both the small-scale and large-scale maps. Disadvantage: The user does not see the two maps simultaneously; and might therefore have difficulty connecting the information from the two maps. Furthermore, switching between maps is necessary. 2) The large-scale map is shown in the ordinary map window and the small-scale map is shown in a key-map. Advantage: The two maps are visible simultaneously. Disadvantage: Even though the user sees both maps at the same time, identifying common objects in the maps is often problematic. In addition, the key-map hides data in the ordinary map window, and it is often difficult to have sufficient space for both maps at the same time on a small display. Journal of Geospatial Engineering, Vol. 4, No. 2 (December 2002), pp.111-123. Copyright The Hong Kong Institution of Engineering Surveyors
Harrie, L., Sarjakoski, L.T and Lehto, L.
3) Large-scale and small-scale cartographic data are presented in the same map: in the vicinity of the user’s position large-scale data is shown, and far from the user’s position small-scale data is shown. Advantage: The large-scale data and small-scale data are integrated. Disadvantage: The map has a variable scale as well as discrete jumps between different types of representations. This study is devoted to the third approach; that is, the paper concentrates on variable-scale maps. Even though many studies have been performed in this area (see Section 1.2) we believe the subject requires more attention. Technical advances have given the variable-scale approach new potential in at least three respects. First, due to the user’s position being known by cellular network or Global Positioning System (GPS), it is possible today to have a mobile device showing cartographic data where the user will always be in the centre of the map. Second, new methods for real-time data integration and real-time generalisation make it possible to tailor the map to specific user requirements (Lehto and Kilpeläinen, 2000; 2001a; 2001b). Third, the emerging vector-data standards will enhance the transfer of cartographic data to a mobile user. In principle, this means it is possible to create a variable-scale user-tailored map that is updated while the user is moving. The terms large-scale and small-scale cartographic data are used only in a relative sense in this paper; that is, the small-scale data is less detailed than the large-scale data, but is not necessarily what most cartographers would regard as small-scale data in the absolute sense. The body of the paper is organised as follows: It begins with a survey of previous studies of variable-scale maps; and the theoretical background of our approach is presented in the third section. Desirable properties of variable-scale maps are stated and then a mapping function is derived from these criteria. Furthermore, some characteristics of the new mapping function are computed and visualised. The fourth section is devoted to a prototype of variable-scale maps. It begins by describing the technical environment as well as some vector-data standards used. Realtime generalisation methods are then briefly described. These methods are necessary to make the level of detail suitable in all parts of the map. The section ends with a case study, and concludes with Discussion and Conclusions.
2 Previous studies of variable-scale maps Variable-scale maps have two basic purposes. First, a variable-scale map is used when a constantscale map is not sufficient for visualising all the required information. Second, a variable-scale map is used to make the density of a variable uniform; such maps are normally called cartograms (see e.g. Gusein-Zade and Tikunov, 1993). This paper deals with the first aim only. Furthermore, methods exist for showing images in variable scales (see e.g. Idelix, 2002); when these methods are applied to aerial images (in orthogonal projection) they give similar effects as map methods for variable-scale. However, this paper is devoted to maps stored as vector data; the issue of showing aerial images in variable scale is not discussed. 2.1 Background A variable-scale map requires an appropriate mapping function. There are two main categories of these mapping functions. The variable-scale map coordinates (xvs, yvs) can be computed from the geographic coordinates latitude (ϕ) and longitude (λ):
( x vs , y vs ) = f gc (ϕ , λ ) .
(1)
In this case the mapping function (fgc) is a type of map projection. The other category of mapping functions (fmp) computes a variable-scale map from coordinates in a map projection plane (xmp, ymp):
112
A Mapping Function for Variable-Scale Maps
( xvs , y vs ) = f mp ( x mp , y mp ) .
(2)
For the latter category the original coordinates (on the ellipsoid) must have been projected on a plane in advance by a standard map projection. This section contains descriptions of some variable-scale mapping functions from both categories above. Schematic maps are described in the last sub-section; these studies are of interest here, since schematic maps are a special kind of variable-scale map. 2.2 Studies using variable-scale maps computed from geographic coordinates Much research has been devoted to developing map projections that have as little distortion as possible. In order to create a variable-scale map projection the aim is quite the opposite; the scale varies intentionally so that the map can visualise data with uneven distribution or focus on an area of interest. A number of map projections have been designed for this specific purpose. Snyder (1987) derived some azimuthal projections with a magnifying glass effect. These projections produce a map having a circular cap where the radial scale is constant outwards from the centre point (of the azimuthal projection); outside the circular cap the radial scale is smaller. Several examples of applied use of variable-scale maps exist. Hägerstrand (1957) used a logarithmic azimuthal map projection to visualise migration patterns, finding that most people moved only within a region, and a few moved between regions. He realised that to visualise these migration patterns a constant-scale map was insufficient. The city maps by Falk-Verlag, Germany, are commercial examples of variable-scale maps are. 2.3 Studies using variable-scale maps from map projection coordinates Fairbairn and Taylor (1995) proposed variable-scale maps for urban areas. They argued that the density of objects is greater in the city centre where the scale should therefore be larger. In their study they implemented a variable-scale map where the scale decreases linearly from the centre of the map towards the edges (formulas for similar scale variations were also derived by Kadmon, 1975). Furthermore, Lichtner (1979) used a transformation that magnified several parts of urban thematic maps. Similar ideas were recently presented by Guerra and Boutoura (2001). They proposed that a magnifying glass could be moved around a city map and that the area beneath the glass should be presented in another window where the data are magnified non-linearly. 2.4 Schematic maps Special types of variable-scale maps are known as schematic maps (some authors use the term, see e.g. Kadmon, 1982). These maps have great geometrical distortions but are topologically correct; they are used mainly for presenting subway lines and other transportation networks. Recently, research has been devoted to establishing automatic methods of generating and querying schematic maps (Avelar and Müller, 2000; Avelar and Huber, 2001; Cabello and van Kreveld, 2002). Agrawala and Stolte (2001) presented a study for personal navigation maps. They aimed to produce a navigation map resembling a hand-drawn sketch. Agrawala and Stolte argued that people are mainly interested in information about a route’s turning points and not the links between them. It is therefore better to shrink certain road elements (i.e., use a smaller scale locally) so that all required data concerning turning points may be presented. A beta version of their navigation map was made public on the web and received positive response.
3 Variable-scale mapping function This section starts by describing the desired properties of a variable-scale map. Then a mapping function is derived according to these properties, which computes the variable-scale coordinates from coordinates stored in a map projection plane (cf. Equation 2).
113
Harrie, L., Sarjakoski, L.T and Lehto, L.
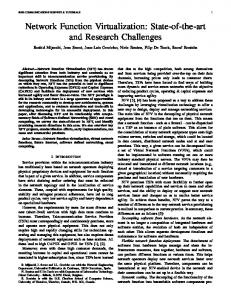
Characteristics of the mapping function are described in sub-sections 3.2 - 3.4. It should be noted that the distortions and scale variations described in these sections only refer to the variable-scale mapping function (fmp). Since the original data is stored in a map projection plane some distortions are inherent in the data, but these are not examined here. The final sub-section provides a comparison between using a circular and quadratic area for uniform scale in a variable-scale map. 3.1 Basic properties The aim of this study is to create a map for personal navigation using a small-display mobile device. The device communicates with a cartographic database by GSM. This implies that the map can be adapted to the current location of the user. A key idea of the variable-scale map, used in this study, is to show large-scale data for the circular cap around the user and smallscale data for areas beyond (see Fig. 1). A variable-scale map requires following properties (cf. Fig. 1):
the
a) The scale should be continuous over the whole map. b) Within a circular cap with radius r0 the map is shown in a uniform scale sl (cf. Figure 1) The scale (in radial direction) should be equal to sl at the radial distance r0 from the user position. The scale (in radial direction) then decreases by a constant factor to equal ss at a radial distance of r1. For distances longer than r1 the scale (in radial direction) should also be equal to ss.
Figure 1. The figure illustrates the circular cap (with radius r0) where large-scale data is shown and the area outside this cap where small-scale data is shown. Inside the small circular cap the scale is uniform (and equal to sl) and beyond radius r1.
3.2 Mapping function In this sub-section we derive a variable-scale mapping function that gives a map having the properties listed in sub-section 3.1. The mapping function assumes that the original coordinates are stored in a map projection plane (cf. Equation 2). Since the mapping is symmetric, it can be constructed by applying the following three functions:
[r , ϕ ] = f I ( x mp , y mp ) rnew = f II (r )
(3)
[ x mp , y mp ] = f III (rnew , ϕ ) where fI and fIII are the ordinary transformation functions between Cartesian and polar coordinates and fII is a radial displacement function where rnew (the new radial distance) is a function of r (the original radial distance) (see Equation 4). The preferred presentation scale of the data set is here assumed to be equal to sl. The given mapping function is actually one that maps the difference from a uniform scale of sl. Considering this, and the desired properties in listed sub-section 3.1, we get the following radial displacement functions:
114
A Mapping Function for Variable-Scale Maps rnew(r) = r , r