WEB MAPPING WITH GOOGLE MAPS MASHUPS: OVERLAYING GEODATA I. O. Bildirici a, *, N.N. Ulugtekin b a
Selcuk University, Faculty of Eng., Dept. of Geomatic Engineering, 42079 Selcuklu Konya, Turkey –
[email protected] b ITU, Civil Engineering Faculty, Dept. of Geomatic Engineering, 34469 Maslak Istanbul, Turkey -
[email protected] Commission IV
KEY WORDS: Web cartography, Google Maps API, map mashups, JavaScript, XML, KML
ABSTRACT: The term mashup is used for incorporating different web resources and information within a web site. Mashups are an integral part of Web2.0, which represents a variety of innovative resources, and ways of interacting with, or combining web content. Mashups are based on Application Programming Interfaces (APIs) that are online libraries of functions. Most of the APIs are available at no cost to web developers. Most common mashup applications involve web mapping or web cartography. There is a variety of API providers for map mashups, including Google, Yahoo and etc. The functionality of their APIs are similar, but the data content. Google provides a huge amount of geodata worldwide. With Google Maps API, web site developers can add dynamic maps to their pages, and can overlay their own point, line and polygon data on to the maps. Such data can be overlaid within the JavaScript code, from external XML or KML files. It is also possible to connect a database and overlay data from the database based on a query. In this study the basics for creating map mashups are introduced, then the ways of overlaying data are discussed and the usage of XML and KML files are focused on. KML overlays are not flexible and there are some limitations. XML overlays are more flexible, but there is no standard XML schema. Web developers can define their own elements and attributes, and develop their Javascript code accordingly. We propose an XML schema, which is full compatible with Google Maps API classes.
1. INTRODUCTION The World Wide Web (WWW) is the most recent innovative medium to present and distribute spatial data. Here, the map plays a key role, and has multiple functions. Maps can play the traditional role of providing insight into geospatial patterns and relations. Under these circumstances maps are used as they would in e.g. an atlas or newspaper to present the structure of a city or the location of any disaster occurred lately. According to Kraak & Brown (2001); “Web cartography can be considered a trend in cartography”. There are also similar terms such as Internet Mapping, Online Mapping etc. This topic catches the attention of cartographic community and books and papers have been published. Some of the recent works are: Cartwright et al (2007), Peterson (2003). Map mashups are one of the efficient tools for online mapping, or web cartography. They are, in general, an integral part of web2.0, which represents a variety of innovative resources, and ways of interacting with, or combining web content. This term is closely related to Tim O'Reilly because of the O'Reilly Media Web 2.0 conference in 2004 (URL1). Mashups are created with online libraries and functions called Application Programming Interfaces (API). Most of the APIs are available to web developers at no cost. There is a variety of mapping API providers including Google, Yahoo, etc. Google Maps API is
the most common one of the APIs because of the rich data content for the whole world. Approximately same vector data and imagery are used for Google Maps and Google Earth. With map mashups, dynamic maps can be added to third party web sites, and third part content can be overlaid on such maps. Such maps are becoming common in many sites involved in location, such as on-line auction and shopping websites, hotel booking sites etc. The most common usage is depicting a certain address on the map with a marker, mostly the upsidedown rain drop. In this example, the map is brought from Google’s servers; the point (the marker) is overlaid by the developer of the web site. This developments increase the spatial awareness of ordinary people. There is a huge amount of spatial data available on the net. The term “neogeography” has emerged to address a set of new geographic concerns with the rise of such enabling technologies as web mapping services and pervasive GPSenabled devices. Liu and Palen (2010) discusses such issues and examines the usage of map mashups in the crises management. In this paper, we fist introduce the Google Maps API Family, and then discuss the overlay possibilities in the third party
* Corresponding author. A special joint symposium of ISPRS Technical Commission IV & AutoCarto in conjunction with ASPRS/CaGIS 2010 Fall Specialty Conference November 15-19, 2010 Orlando, Florida
websites. We examine KML and XML overlays, and propose an XML schema.
certain objects are selected and generalized accordingly. It is noticeable that there is a good text optimization.
2. GOOGLE MAPS API FAMILY
A comprehensive summary about Google Maps and Maps API can be found in URL 3.
Google Maps has a wide array of APIs that let web developers embed the robust functionality and everyday usefulness of Google Maps into their own websites and applications, and overlay their own data on top of them. The Google Maps API family consists of the following (URL 2): Maps JavaScript API: This API was previously known as Google Maps API, with which a Google Map can be embedded in third party web pages using JavaScript. The map can be manipulated and appropriate content can be added through a variety of services. Two versions are available: V2 and V3. V2 is deprecated on May 19th, 2010; V3 is the current one. Since V3 is a rather new development, we use mostly V2 for our discussion in this paper. This member of the family will be mentioned as “Maps API” in the next sections of the paper. Maps API for Flash: This ActionScript API is used to embed a Google Map in a Flash-based web page or applications. Google Earth API: A true 3D digital globe can be embedded into a third party web page. With this API a mashup with the functionality of Google Earth can be provided for the visitors. Static Maps API: A fast and simple Google Maps image in a web page or mobile site without requiring JavaScript or any dynamic page loading can be embedded. Web Services: URL requests to access geocoding, directions, elevation can be realized. Maps Data API: Map data through Google Data API feeds, using a model of features (placemarks, lines & shapes) and collections of features, can be viewed, stored and updated. All these APIs are free services, available for any web site that is free to consumers. For Version 2 a key from Google is necessary, which can be obtained easily. For the current version (V3) no key is needed. Businesses that charge fees for access, track assets or build internal applications must use Google Maps API Premier, which provides enhanced features, technical support and a service-level agreement. The latter is not a free service. Google Maps API Family is programmed with JavaScript, the most popular scripting language for developing dynamic web content. Web developers should also use JavaScript, whose use is free, in their web sites. The datum of the map data is WGS 84. The default map projection is the Mercator projection. Due to increasing distortion towards poles, Polar Regions are not visible, so the world is shown between ~85 N and ~85 S latitudes. In terms of scale there are 18 zoom levels ranging from a map scaled ~1:5000 to a world map scaled ~1:250 million. For each level
In order to use the Maps API, the API library must be declared in the head section of the HTML document. For V2:
For V3 (without key):
In the code above, there are some points to be mentioned. In the viewport declaration the option “user-scalable” enables the user to change the scale of the map. Otherwise zooming will be disabled. An important development in the Maps API V3 is the sensor parameter in the API declaration, with which the built-in GPS receivers can be reached from the API code, if the web browser is compatible. Since the web pages created by using Maps API V3 can be displayed in certain types of the mobile devices, Iphone and devices running Android operating system, the internal GPS receivers can easily be used within the web browsers without installing any software. The functions calling Maps API functions are to be coded also in the head section of the HTML document. The map is displayed within a “div” tag in the body section. V2 code below displays a simple map with a marker on the centre: Google Maps JavaScript API Example function load() { if (GBrowserIsCompatible()) { var map = new GMap2(document.getElementById("map")); map.setCenter(new GLatLng(41.05, 29.05), 11); map.addControl(new GScaleControl()); var customUI = map.getDefaultUI(); map.setUI(customUI); var point=new GLatLng(41.05, 29.05); var marker=new GMarker(point); map.addOverlay(marker); GEvent.addListener(marker,"click", function() { var myHtml = "Center of the map"+point; map.openInfoWindowHtml(point, myHtml); });} }
A special joint symposium of ISPRS Technical Commission IV & AutoCarto in conjunction with ASPRS/CaGIS 2010 Fall Specialty Conference November 15-19, 2010 Orlando, Florida
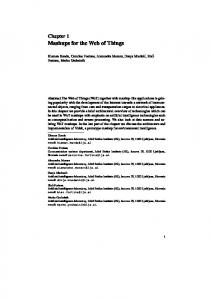
3.1 Overlays within the JavaScript Code In the head section the API library is declared within the first script tag. In the second script tag there is a function named load that will be invoked when page is loading. This is declared in the body tag. In this function: a map object is created from GMap2 instance; the centre and the scale (zoom level) of the map is declared; a bar scale is added; the user interface of the map is declared (the map type buttons and navigation tool); a point is created from the geographical coordinates; at that point a marker is created; and a “click” event for the marker is created causing an info window is displayed. In the body section a div tag is declared, in which the map is displayed. Within the div tag dimensions of the map are determined. The map created with this code is shown in Figure 1. The local language of the client has been recognized automatically, so the buttons up right are in Turkish.
The simplest way of overlaying data is to do this within JavaScript code. In the example in Figure 1, a marker (point) is overlaid on the center point of the map. The most common situation is the following. In a website of a company (or a shop) there is a marker showing the address of the company on the map. Here a marker representing the address is overlaid on the map. After creating a map the code below creates a marker and overlays it. var marker=new GMarker(GLatLng(41.05, 29.05)); map.addOverlay(marker);
The function GLatLng creates a point. The parameters are latitude and longitude in decimal degrees. GMarker delivers a marker attached to this point. addOverlay method performs the overlay. Here a standard Google marker is shown (upside down rain drop). In order to use a symbol an icon is needed. The image format for icons is PNG with transparent background. Google provides a set of basic icon images for mapping purposes. There are also other web sites that publish free icon images. Defining an icon is complex because of the number of different images that make up a single icon in the Maps API. At a minimum, an icon must define the foreground image, the size of type GSize, and an icon offset to position the icon. The simplest icons are based on the G_DEFAULT_ICON type. Creating an icon based on this type enables to change the default icon by modifying only a few properties. In the code below, an icon using the G_DEFAULT_ICON type is defined, and then modified to use a different image.
Figure 1. A simple map with a marker on the centre 3. OVERLAYS Three types of spatial data can be overlaid on Google Maps, point, line, polygon, which are called markers, polylines and polygons in Google Map’s terminology. Image overlays are also possible. To determine the locations geographical coordinates (longitude and latitude) are used. The datum is WGS84. The map on the background consists of frames each downloaded from a different server. The overlays are combined with the background image (map) without downloading any image again. Because of this technique overlay process occurred in the client computer. So overlays are easy to be performed, and costs no extra time and download.
var point=new GLatLng(41.11, 29.02); var myIcon=new GIcon(G_DEFAULT_ICON); myIcon.image="http://atlas.selcuk.edu.tr/maps/icons/uni versity.png"; myIcon.iconSize=new GSize(24,24);; markerOptions = { icon:myIcon }; var marker=new GMarker(point,markerOptions); map.addOverlay(marker);
Similarly polylines (Gpolyline) and polygons (GPolygon) are also created, and overlaid. The code below creates a simple polyline passing through 5 random points around the centre of the map. The result is shown in the figure 2. The second and the third parameters of the GPolyline are the color and the thickness of the polyline. Geodesic polylines are also possible. var points=new Array(); for(var i=0;i