A Markovian Signature-Based Approach to IP Traffic Classification Hamza Dahmouni
Sandrine Vaton
David Rossé
ENST Bretagne Department of computer Science Brest, France
ENST Bretagne Department of computer Science Brest, France
France Telecom Research and Development Belfort, France
[email protected]
[email protected]
[email protected]
rapidly, especially with the release of higher bandwidth services, such as peer-to-peer (P2P), video and VoIP. We can also observe an increasing use of encrypted services. The evolution towards a mobile access of these high bandwidth services naturally induces more congestion phenomena in these networks. Network operators are thus constrained to control and to detect the different types of traffic flowing through their networks in order to enforce a policy of differentiated pricing and to establish schemes for differentiated bandwidth sharing. All these facts lead to the need of automatic classification methods in order to associate a flow of packets to its class of service (CoS). Indeed, data traffic can be associated to an application (ftp, http, Bittorrent, etc…) or to a category of applications (Bulk data transfer, streaming, interactive, etc…). For example, in QoS management, it is inevitable to classify applications by categories in order to dynamically allocate resources taking into account the applications’ constraints and requirements. Another application of service classification is the development of traffic source models. In this case the traffic is classified by applications and then statistical parameters (e.g., the flow size distribution, packet inter-arrival times, etc…) are extracted for each service in order to feed performance models and dimensioning tools. Service classification has received considerable attention in recent years. Existing methods for traffic classification can be sorted into three categories. The first category is based on the correspondence between the port number and the application type as defined by the IANA. The second category is based on the syntactic analysis of the applicative layers. The last category is using supervised learners such as k-Nearest Neighbors (k-NN), Linear (LDA) or Quadratic (QDA) Discriminant Analysis, Support Vector Machines (SVM), which inputs parameters are a multivariate statistical description of the traffic (e.g., packet sizes, combined with packet interarrival-times, etc…). The above mentioned methods have a number of serious limitations as we explain in section 2. The purpose of our study is to produce a new method to service recognition on multi-services networks that bypasses these limitations. In
ABSTRACT In this paper we present a real-time automatic process to traffic classification and to the detection of abnormal behaviors in IP traffic. The proposed method aims to detect anomalies in the traffic associated to a particular service, or to automatically recognize the service associated to a given sequence of packets at the transport layer. Service classification is becoming a central issue because of the emergence of new services (P2P, VoIP, Streaming video, etc…) which raises new challenges in resource reservation, pricing, network monitoring, etc… In order to identify a specific signature to an application, we first of all model the sequence of its packets at the transport layer by means of a first order Markov chain. Then, we decide which service should be associated to any new sequence by means of standard decision techniques (Maximum Likelihood criterion, Neyman-Pearson test). The evaluation of our automatic recognition procedure using live GPRS Orange France traffic traces demonstrates the feasibility and the excellent performance of this approach.
Categories and Subject Descriptors C.2.3 [Computer Communications Networks]: Network Operations -- Network Management, Network Monitoring.
General Terms Reliability, Security, Management.
Keywords Traffic Classification, Service Recognition, Network Monitoring, Markov Chain, Neyman-Pearson, Maximum Likelihood.
1. INTRODUCTION The GPRS mobile systems, their evolution EDGE, and UMTS can act as packet wireless accesses to existing Internet services. However, Internet services are growing Permission to make digital or hard copies of all or part of this work for personal or classroom use is granted without fee provided that copies are not made or distributed for profit or commercial advantage and that copies bear this notice and the full citation on the first page. To copy otherwise, or republish, to post on servers or to redistribute to lists, requires prior specific permission and/or a fee. MineNet’07, June 12, 2007, San Diego, California, USA. Copyright 2007 ACM 978-1-59593-792-6/07/0006...$5.00.
29
fact, contrary to existing methods which are based on syntactic or statistical aspects of the applications or on port numbers, our method takes into consideration the functional aspects of the applications. Indeed, each application differs by the communication procedures and by the protocols stack employed. Basing our study on the functional aspects, we are able to define a specific signature for each service. More precisely, we consider in this paper TCP traffic only since it is the dominant traffic today. The observations consist in a sequence of the first control packets - as combination of TCP flags - for successive flows in the session. A flow is defined in this study as a set of packets with the same 5-tuple {protocol, IP source address, IP destination address, source port, destination port}. The sequence of TCP control packets is statistically significantly different from one application to another. This is captured through the definition of a first order Markov chain model; the parameters of the model (state transition probabilities) are different for each application and make up the "signature" of the application. The state transition diagram of this Markov chain model is obtained for many applications (HTTP, HTTPS, Telnet, Mail, etc...) from the analysis of a large traffic dataset collected on the GPRS Orange France network. Then, any new sequence of packets is associated to a given application by a decision rule which is based on the likelihood criterion and on a Neyman-Pearson test. The potential of this new method to service classification is excellent; this is in particular demonstrated by Receiver Operating Characteristics (ROC) curves which show high detection rates and very low false alarm rates. The rest of the paper is organized as follows. Section 2 proposes a taxonomy of the mostly-known service classification methods and discusses their limitations; we also introduce the main steps of our approach. Section 3 presents a detailed description of our traffic classification method and of its main steps (traffic collection, Markovian signature definition, decision rules to classify a new traffic). The performance of the proposed method is evaluated in section 4. The last section provides a conclusion.
2.1 Port-based classification Traffic classification by port number is the simplest and most traditional method. It consists in identifying the application type from the port number in the transport layer. The correspondence between the port number and the required application is defined by the IANA (Internet Assigned Numbers Authority) [8]. However, this method has several limitations. Firstly, the association of the port number to an application is not always possible for different reasons: the port numbers are not defined by the IANA for all the applications, especially for the new ones, for instance P2P applications. Moreover, several TCP implementations employ client ports in the registered ports range; this could erroneously classify the connection as generated by the application associated with this port. The server ports can also be dynamically assigned; for example, the FTP passive mode allows the dynamic negotiation of the port number used for the data transfer. This number is given during the initial control connection (FTP control using server port 20). Another limitation is that different services can be encapsulated in well-known applications; for example, streaming or chat on HTTP, etc. Finally, various services (real time, interactive, elastic) with different levels of QoS can use the same port number. For all these reasons, there are serious limitations to this approach to service classification.
2.2 Payload-based classification An alternative to port number-based classification is to employ a syntactic analysis of the IP datagram payload. This method consists, more precisely, in seeking deterministic character strings in the applicative layer of the packets. Indeed, this approach requires a precise knowledge of the application-layer data as well as the format of its packets. In practice, it is necessary to seek character strings which identify an application, for example "http/1." corresponds to the application HTTP, 0xe319010000" corresponds to eDonkey services [10][16]. This technique is an online and quasi-deterministic classification method. But it has also many limitations. Firstly, a description of a characters string that would identify an application or a given version of this application is not always available. In the case of secured applications the applicative payload is encrypted and this method becomes inapplicable. The packet format and type are different from an application to another. Therefore, this information is not easy to extract, since it depends on the adjacent protocols employed. Moreover, data services with different constraints and requirements can be encapsulated in traditional applications.
2. A TAXONOMY OF SERVICE CLASSIFICATION METHODS Traffic classification and anomaly detection in IP traffic have gained considerable interest in the past years because of the emergence of new applications (P2P, VoIP, etc…) with specific constraints. This raises new challenges for resource sharing and differentiated pricing since these new services are bandwidth consuming. In this section we propose a taxonomy of the existing methods and we discuss the limitations of each category of methods. We also introduce a new method which makes use of the applications functional aspects and bypasses the limitations of the existing methods.
2.3 Statistical-based classification Various types of statistical classifiers were proposed in order to classify the data traffic in terms of applications. We can mention; for instance, LDA, k-NN and SVM methods. Traditionally, the researches were oriented towards a statistical characterization of the different applications (e.g.,
30
[2], [4], [9]) in order to define input parameters to; for example, dimensioning models or tools. These studies supposed that the different applications were identified unambiguously on the considered multi-services network. The goal was to obtain statistical characteristics by applications. The converse problem is now gaining importance because of the current increase in the number and variety of Internet applications. The problem is now to associate a given flow, characterized by some statistical parameters, to the corresponding service. This classification can be performed by statistical learning methods. Initially, C. Dewes et al. [6] examined the statistical properties of "chat" traffic and then devised a heuristic to isolate "chat" traffic from a large amount of other traffic. M. Roughan et al. [15] extended [6] by proposing a more rigorous classification approach: they represented each application by a statistical signature formed by different traffic descriptors (packet size, connection duration, etc…) and then used two supervised learning techniques (k-NN and LDA) in order to find a correspondence between different CoS and statistical traffic descriptors. R. Kwitt et al. [11] propose a similar study to [15] using different learning methods, in particular Linear (LDA), Quadratic (QDA), Flexible (FDA) and Mixed (MDA) Discriminant Analysis methods. A. Moore et al. [13] used a naïve Bayesian classifier in order to classify Internet traffic into categories. In that case, the characterization was done at the flow level and as much as 248 traffic descriptors were used in order to describe each flow. The obtained classification rate was 65% if a naïve Bayesian method was used, but it reached 95% if two additional improvements were introduced, the Kernel Density Estimation (KDE) and the Fast Correlation-Based Filter (FCBF). The kernel density estimator was used to estimate the probability density of each descriptor whereas the fast correlation-based filter was used to reduce the dimension of the descriptors’ space and to choose the relevant descriptors. In recent work, L. Bernaille et al. [1] based the classification on the sizes of the first few packets of TCP connections. Different classification methods are then compared: k-NN, generalized Mixture model (GMM) and Hidden Markov Models (HMM). Statistical-based classification suffers from a number of limitations. First of all, the performance of the method (classification rate) is generally lower than what can be obtained with other methods. The performance is not stable since it depends mainly on the statistical descriptors chosen (more than on the chosen classifiers) contrary to deterministic approaches such as payload-based methods. Moreover, we believe that it is relatively easy for an adversary to evade classifiers based on the above-mentioned traffic descriptors. It is not difficult to alter such traffic descriptors as packet length (by padding), or packet interarrival times (by delaying some packets...) for example. In that case, even if the number of descriptors is large, the classifier will probably identify the traffic as an outlier in the traffic descriptors space; it will then declare that this traffic
stems from an unknown application but it will probably not be able to identify the prohibited application
2.4 A Markovian signature-based approach The IP traffic can be represented on three entities: the packet level, the flow level which is a concept closer to the application, a flow corresponding to a succession of packets with the same 5-tuple, and the session level which is a succession of flows (activity periods) of the application. During its activity period, an application exchanges a typical sequence of control packets (e.g., SYN, ACK, PSHACK, SYN-ACK, etc...) with a remote host (client or server). This sequence is modeled as a first order Markov chain; the different types of control packets exchanged (usually no more than 10, including a “rare” state) make up the states space of this Markov chain and the transition probabilities between states (transition matrix) identify a different “signature” for each application. Traffic events modeling by Markov chains have been used essentially for the detection of anomalies in network traffic data. D. Denning [5] proposed an early abstract model of an Intrusion Detection System (IDS) based on the statistical characterization of the normal system behavior. N. Ye et al. [17] modeled the Unix events sequence in order to define a signature by machine, used for Cyber-attacks detection in the traffic. In related work, J.M EstevezTopiador et al. [7] proposed a Markovian modeling of TCP segments for detecting anomalies in the usage of protocols in computer networks. In practice, the approach that we propose can be decomposed in a learning step and a decision step. In the learning step the transition probabilities for each application are obtained (by Maximum Likelihood estimation) from a training dataset with a large number of applications and a large number of flows for each application. The applications of the training dataset (in our case, an Orange France GPRS dataset) were identified by port numbers. In the second step, we use decision theory (Maximum Likelihood theory and Neyman-Pearson theory) to decide by which application a new sequence of packets has been produced. A detailed mathematical description of the learning and decision steps of our method is provided in the next section. The question of how easy it would be for an adversary to evade the classifier is very important. One could imagine that the adversary would pepper his packet stream with packets with misleading TCP flags in order to throw off the classifier. He could also deliberately deliver an out-of-order packet stream in order to disguise their Markovian signature. The first attack would require a cooperation of both end hosts which means that the adversary would first of all have to gain control over the other end host (usually the server side). This makes the attack more difficult to engineer than a simple attack based on spoiling such traffic descriptors as interarrivals or sizes (packets, flows, etc...) The second attack is connected to the problem of TCP packet reordering; the classifier should use the TCP sequence number in order to
31
protect the system against this kind of attacks; moreover, outof-order packets delivery will probably result in time-outs which will be interpreted as lost packets and result in a reduction of the TCP window size. This QoS degradation is probably something that could also dissuade the adversary from designing such an attack.
in order to lengthen the size of the observed sequence and to increase the algorithm precision.
3.2 Decision rules The problem of inferring the application from the sequence of TCP control packets is a multi-hypothesis decision problem. Each hypothesis corresponds to the Markovian signature of the corresponding application, where the matrix transition probabilities make up the signature of each application. The number of hypotheses can be large since there are potentially tens or hundreds of applications, this is why this problem is a multihypothesis decision problem. In general there are no optimality results for multihypothesis decision problems. However in the case of two simple hypotheses H0 and H1 the Neyman-Pearson lemma states that the likelihood ratio test is the most powerful test of size α. The likelihood-ratio test rejects H0 in favor of H1 L( y | H 0 ) is lower than when the likelihood ratio Λ ( y ) = L ( y | H1 )
3. METHOD DESCRIPTION In order to reach our objective we have investigated GPRS data traces collected on the live Orange France network. The measurements were collected on two different Gb interfaces (interface between SGSN and PCU entities) during a ten-days period (about 5 hours per day, between 11 a.m and 4 p.m). The frames captured at the Gb interface contain the TCP and UDP/IP header information (packet size, port number, transfer direction, TCP flags, etc…) and a timestamp which indicates the arrival time of packets with an accuracy of millisecond.
3.1 Markovian signature definition In contrast to the study based on TCP connections, our process takes into account successive flows in the session. Thus, the identification of the Markov model associated to the applications can be decomposed into three steps. The first step consists in identifying the states space. This amounts to determining the various types of control packets used by the applications.Moreover, this states space includes a “rare state” to keep the classifier stable in case an unforeseen combination of TCP flags. The cardinality of the states space is very small and it is lower than 10. The second step consists in reconstructing the original order of the packets in a flow; this amounts to reorganizing the flows according to their activation order in the session and the packets according to their emission order in the flow. The last step consists in estimating the Markov Chain parameters (state transition probabilities) for each application. The transition probabilities P(i,j) for each Markov chain model is estimated as the number of transitions from a packet of type i to a packet of type j and dividing this value by the number of packets of type i. During a session, the application activates one or more flows in parallel or in series to complete its transfer. The number of flows depends in particular on the application nature, and more precisely on the version of the application. As the IP data traffic is bursty, it is necessary to reorder the flows and the packets inside a session. This is a key stage of the treatment, since it makes possible the reconstitution of various TCP serial connections. We assume that the order of the packets composing the same flow is not changed between their emission and their reception and we reconstitute the order of the flows by doing so. Furthermore, we consider that the end of a flow and the beginning of the following flow are considered to belong to the same connection. This assumption is taken into account
ζ (α ) , where the threshold ζ (α ) is set so that the false alarm rate (size of the test) is equal to α: Pr(Λ ( y ) ≤ ξ (α ) | H 0 ) = α . In these equations y = ( y1 , y2 ,K , yT ) is the observed data sequence (sequence of TCP control packets) and L( y | H i ), i = 0,1 is the likelihood (probability) of this data sequence under the hypothesis H i , i = 0,1 . The likelihoodratio test is the most powerful test of size α . Most powerful means that for a given level of false alarm α the NeymanPearson test is the test with maximum power (probability of rejecting H0 in favor of H1 when H0 is false). This optimality result holds whatever the length of the observed sequence; it is not an asymptotical result. In the case of Markov chain models with initial probability vector p and transition probability matrix P the likelihood of the observed data sequence y = ( y1 , y2 ,K , yT ) (in our case, TCP control packets) is T
∏ P( y
L( y ) = p( y1 )
t −1 , yt )
(1)
t =2
The Küllback-Leibler divergence between H1 and H0 measures the degree to which the data will reveal that the null hypothesis H0 is false when the alternative hypothesis H1 is in fact true. The highest the Küllback-Leibler divergences D(H0//H1) and D(H0//H1) are the more information we get on average from the data in order to take a reliable decision [14]. In the case of two Markov chain models MC0 and MC1 with transition probability matrix P 0 (respectively P1 ) and steady-state distribution π 0 (respectively π 1 ) the KüllbackLeibler divergence between MC1 and MC0 is given by [3]:
32
D( MC1 // MC0 ) =
⎛ P1 (i, j ) ⎞
∑ π (i) P (i, j) log ⎜⎜⎝ P (i, j) ⎟⎟⎠ 1
1
0
i, j
we take a decision between the two applications with a Neyman-Pearson test.
(2)
4. PERFORMANCE EVALUATION
In addition the entropy of the Markov chain with steadystate distribution π and transition probability matrix P is given by
H ( MC ) = −
∑ π (i) P(i, j) log ( P(i, j) )
The Markovian models calibration is carried out on three types of applications, in the circumstances Telnet, HTTP and HTTPS. This estimation is realized on 9256 sessions containing 5761 HTTP sessions, 2788 Telnet sessions and 1707 HTTPS sessions. The number of the significant states (states space) for these applications is very small (less than 6 states). The parameters of the Markovian models profiling these applications such as transition probabilities, entropy, as well as KL distance are obtained from this training dataset. Table 1 gives entropy and some KL distance values for these traditional applications.
(3)
i, j
The entropy defined by Shannon measures the quantity of information delivered on the average per each symbol when the data is considered as an information source. As we will demonstrate in the next section, the KL distance between two Markov chains models representing two applications is close to 0 if the two applications have similar protocol statcks (e.g., for HTTP and HTTPS). Otherwise, this distance is larger (e.g., HTTP versus Telnet or FTP applications case). The Neyman-Pearson test is the most powerful test in the case of two simple hypotheses. But, as we have already mentioned, we have potentially tens or hundreds of hypotheses H i , i = 1, 2,..., K , corresponding to K different applications on the network. In the case of more than two hypotheses there are in general no optimality results. A classical approach is to base the decision on the Maximum Likelihood criterion, that is to say to decide in favor of the hypothesis under which the data sequence y is the most likely: the decision is H= ArgMax log L( y1,..., yT | H i ) which
Table 1. Entropy and KL distance for different applications Application
Hi
(4)
where the likelihood L(y | Hi) of the data sequence y under each hypothesis is calculated from the equation (1). Our decision rule combines Maximum Likelihood estimation and Neyman-Pearson tests. More precisely, we estimate the likelihood of this sequence for each of the Markov models profiling the applications: • • •
KL Distance
HTTP
0.83
D(http//telnet) = 0.32
HTTPS
0.79
D(http//https) = 0.05
Telnet
0. 69
D(telnet//http) = 0.28
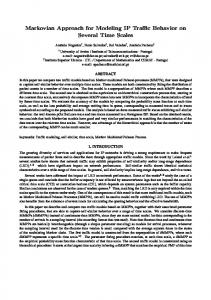
The performance of a decision test (case of two hypotheses H0 and H1) is estimated by the pair (α,β) (false alarm probability, detection probability). In our case each hypothesis (H0 or H1) corresponds to a specific application. The ROC-curve plots β as a function of α (different decision thresholds ξ (α ) correspond to different values of the pair (α, β)). Our goal is to decide how many packets T one should observe in order to be able to take a reliable decision (small false alarm α and high power β) between H0 and H1. We plot these ROC curves for various values of T, and for various pairs of applications. Figure 1 presents ROCcurves for application HTTP (H0 hypothesis) versus Telnet (H1 hypothesis). Figure 2 illustrates ROC-curves for application HTTP (H0 hypothesis) versus HTTPS (H1 hypothesis). The decision is good when the power is close to 1 for a small false alarm rate. From these various curves, we observe that for applications HTTP and Telnet the decision can be made with a strong power and a weak false alarm starting from only a few number of packets (6 or 10 packets). The KL distance between HTTP and Telnet is 0.32 which means that the Markov chain models of these two applications are significantly different and that it is very easy to discriminate between these two applications. On the other hand, for HTTP and HTTPS applications, a good decision with a weak false alarm is not possible if the number of observed packets is small (of the order of 10 for example), but it becomes possible to take a reliable decision if the number of observed packets is larger (say, larger than 50). The KL distance between HTTP and HTTPS is 0.05
means that log L( y1 ,..., yT | H ) ≥ log L( y1 ,..., yT | H i ), ∀H i
Entropy
If the likelihood of the packets sequence is very low for all the applications, we decide that this is probably a “new” application and we eventually raise an alarm. If the likelihood is much higher for one of the Markov models than for the others, we decide that this sequence has been produced by the corresponding application. In some cases, the likelihood value is close for several Markov models. This can happen for example in the case of applications with very similar operation (for example http and https, or different activities using the same protocol). In that case we can group the different applications with a similar functioning in a group of applications and identify the group only; in the case of two “similar” applications (for example http and https)
33
(much smaller than the KL distance between HTTP and Telnet) making the decision more difficult. This obviously stems from the fact that HTTP and HTTPS have very similar protocol stacks.
evaluation of this method on live Orange France traffic traces demonstrates the very good performance of the method.
6. ACKNOWLEDGEMENT The authors would like to thank B. Morin (France Telecom Research and Development) as well as the persons in Orange France who provided the necessary measurements. This method has been developed during Hamza DAHMOUNI PHD thesis work in France Telecom under the supervision of Sandrine Vaton from ENST Bretagne.
7. REFERENCES [1] L. Bernaille, R. Teixeira and K. Salamatian, Early Application Identification, CoNext’06, 2006 [2] J. Charzinski. HTTP/TCP connection and flow characteristics", Performance Evaluation, vol.42, pages 149-162, 2000. [3] T. M. Cover, Joy A. Thomas. Elements of Information Theory. Wiley & Sons, 2006. [4] H. Dahmouni, D. Rossé, B. Morin, S. Vaton. Impact of Data Traffic Composition on GPRS Performance. ITC'19, 2005.
Figure 1. ROC-curves rates for different sequence sizes (T) H0:=HTTP and H1:= Telnet
[5] D.E. Denning, An Intrusion Detection Model, IEEE Tran. on Software Engineering, SE-13(2):222-232, 1987 [6] D. Dewes, A. Wichmann, A. Feldmann. An analysis of Internet chat systems. ACM SIGCOMM IMC, 2003. [7] J.M. Estevez-Tapiador, P. Garcia-Teodoro, J. E. Diaz-Verdejo. Stochastic Protocol Modeling for Anomaly Based Network Intrusion Detection. IWIA’03, 2003. [8] IANA: http://www.iana.org/assignments/port-numbers [9] R. Kalden, T. Varga, B Wouters, B. Sanders. Wireless Service Usage and Traffic Characteristics in GPRS networks. ITC' 18, 2003. [10] T. Karagiannis, A. Broido, N.Brownlee, Kc. Cluffy, M. Faloutsos "Is P2P dying or just hiding. IEEE Globecom, 2004. [11] R. Kwitt, T. Strohmeier, U. Hofmann. Machine Learning for Perceptual QoS. CISTA, 2005.
Figure 2. ROC-curves rates for different sequence sizes (T) H0:=HTTP and H1:= HTTPS
[12] A.W Moore, K. Papagiannaki. Toward the accurate Identification of Network Applications. PAM'05 , 2005. [13] A.W. Moore, D. Zuev, "Internet Traffic Classification Using Bayesian Analysis techniques", ACM SIGMETRICS, 2005.
5. CONCLUSION
[14] K. Nakagawa, F. Kanaya. On the Converse Theorem in Statistical Hypothesis Testing for Markov Chains. IEEE Transactions on Information Theory, 1993.
We proposed, in this paper, a new method of automatic services classification based on a Markov signature of the functional aspects of the applications. We used the NeymanPearson test and the likelihood criterion for defining a decision rule. Large traffic datasets from the Orange France GPRS operational network were used in order to learn the Markov chain signature of each application and to evaluate the performance of the method. The objective of this method is to automate service recognition as well as supervision of a particular service from the online processing of traffic data. This new process will make it possible to mitigate certain limitations of the existing methods such as port-based, statistical-based or syntax-based service recognition. The
[15] M. Roughan, S, Sen. O. Spatscheck, N. Duffield, Class of Service Mapping for QoS: A Statistical Signature Based Approach To IP Traffic Classification. ACM IMC, 2004. [16] S. Sen, O. sparscheck, D. Wang. Accurate, Scalable InNetwork Identification of P2P Traffic Using Application Signatures. 13th international conference on WWW, 2004. [17] N. Ye, Y. Zhang, C.M. Borror. Robustness of the MarkovChain Model for Cyber-Attack Detection. IEEE Transactions on Reliability, Vol. 53, N°1, 2004.
34