email: {fred.deroo,hirche}@tum.de. Abstract ... For this purpose, we present a
MATLAB toolbox for interconnected dy- namical systems ... tems, multi-agent
systems and distributed dynamical systems, which are often mentioned in this
context.
A MATLAB Toolbox for Large-scale Networked Systems Frederik Deroo, Sandra Hirche Institute for Information-Oriented Control (ITR) Technische Universit¨at M¨ unchen, Germany email: {fred.deroo,hirche}@tum.de Abstract R
In this article we present a MATLAB toolbox to analyze networked systems from both a dynamical and a graph theoretical point of view in a user-friendly GUI tool. It is designed to allow easy creation, editing and simulation of models of networked dynamical systems, a large system class of practical interest. The main features of the software are described and several application examples are given.
1
Introduction
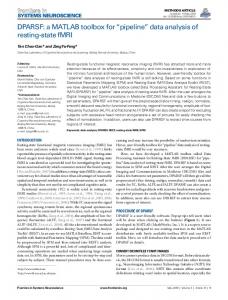
The analysis of networks of dynamical systems is an important area of system and control engineering with many application areas. For this purpose, we present a MATLAB toolbox for interconnected dynamical systems (MTIDS). We consider interconnected systems to be systems that consist of several subsystems which are connected to each other either physically, through communication, or both. This definition includes the notions of large-scale interconnected systems, networked dynamical/control systems, multi-agent systems and distributed dynamical systems, which are often mentioned in this context. An abstract illustration of an interconnected system is shown in Figure 1, where the Σi represent the subsystems and the arrows indicate one of the forms of interaction. In the following we point out several application areas in more detail: Technological and biological systems as well as economical and social networks. The mentioned fields are also summarized in Figure 2. Technological systems are often modeled as networks of comparatively small subsystems. For example, the power system consists of thousands of components including generators, loads and transformers [11]. Traffic and transportation systems can also be modeled as interconnected systems [10]. Possibly the largest artificial interconnected system is the Internet which consists of local dynamics representing signal sources, routers and communication links [17]. On a comparably smaller scale, cooperative multirobot systems or groups of unmanned vehicles are also an example for this system class, e.g. in the context of formation control [4]. The field of biological networks employs system modeling in the form of interconnected subsystems as well, for example in studies on the human brain [3]. Investigations on population biology and ecosystems [13] and on gene interaction [20] also take the perspective of interconnected systems with local
Σ1
Σ3
Σ5
Σ2
Σ4
Figure 1: Interconnected system 1
Technological systems
Biological systems
Interconnected dynamical systems
Social networks
Economical systems
Figure 2: Disciplines treating interconnected system dynamics. Even the climate of the earth can be regarded as an interconnected system [23]. Lastly, an important field is the study of flocking in the behavior of animals such as birds or fish [8]. The study of economical networks is another field that treats interconnected systems, e.g. in logistics, production and distribution, financial networks of banks and investors, informational networks and labor markets [18]. Dynamic network models are also used in the field of social networks. One direction of research is the investigation of opinion formation in communities or social networks [12]. Another direction is the research on the spreading of diseases among humans [2]. In the literature, interconnected dynamical systems are investigated from two different points of view. The first is the application of graph theoretical methods to the interconnection structure of dynamical systems, e.g. [16]. On the other hand, it is often desired to simulate or analyze the dynamical properties of a system, for example in terms of performance in the field of distributed control, e.g. [5, 24]. To the best of the authors’ knowledge, no software tool is available that inherently offers the functionality to do both analysis methods mentioned above – i.e. in terms of graphs and in terms of system dynamics – in a quick and user-friendly fashion. In this article we present MTIDS (MATLAB toolbox for interconnected dynamical systems), a MATLAB/Simulink GUI program to create and simulate interconnected dynamical systems. The main purpose of the program is a simplified construction and subsequent modification of large-scale interconnected systems, in order to simulate them, e.g. to analyze system behavior or evaluate performance. It offers a large degree of freedom in terms of possible system dynamics, in addition to interconnection graph analysis methods. The remainder of this article is organized as follows. In Section 2, we give a short introduction to the main concepts of graph theory. Next, in Section 3 some canonical problems and possible system classes are shown. Afterwards, we explain the usual workflow in MTIDS in Section 4 before presenting some application examples in Section 5. In Sections 6 and 7, we give details on the installation and implementation of MTIDS before concluding with a summary and outlook in Section 8.
2
Introduction to graph theory
For interconnected systems, a graph can be used to model the interconnection structure of the overall system. In this section, we explain and define some of the main basic concepts of graph theory that are referred to in later sections. For an in-depth introduction, we refer the reader to [9]. A graph G is described by a set of vertices V and a set of edges E. An edge is a pair of vertices (also called nodes) of G, usually denoted by (i, j). If (i, j) is an edge, then i and j are adjacent and j is a neighbor of i. In a complete graph, every pair of vertices is adjacent. For directed graphs, the edge (i, j) has an order and signifies that there is an arc from node i to node j. For undirected graphs, the
2
edge (i, j) is considered to be unordered. This signifies that there is an arc (j, i) whenever there is an arc (i, j). An example of a directed graph is given in Figure 1. The adjacency matrix A of a graph is an integer matrix where the (i, j)th entry is equal to the number of arcs from i to j (usually 0 or 1). Because graphs usually do not have loops, the diagonal entries of A are zero. The incidence matrix B of a graph is a binary matrix where the rows and columns are indexed by the vertices and edges of the graph G, respectively, such that the (k, l)th entry of B is one iff the vertex k is in the edge l. In contrast to the adjacency matrix A, B is not quadratic, but has the size n × e, where n is the number of nodes and e the number of edges. The degree of a node i is the number of neighbors of i. The maximum and minimum degree of a graph G is the maximum and minimum value of degrees of any node in G. For directed graphs, we need to distinguish an in-degree and an out-degree. We call D the degree matrix which is a diagonal n × n matrix where the (i, i)th entry is the degree of node i. It can then be shown that BB T = D − A. The matrix BB T = L is also called the Laplacian of the graph. L is always positive semi-definite and the number of times 0 appears as an eigenvalue is the number of connected components in the graph. That means that the whole graph is connected, iff λ2 (L) > 0. A node is called balanced iff its in-degree and out-degree are equal. A graph is balanced iff every node is balanced. Every undirected graph is balanced. A graph is connected if there is a path between any two vertices. A directed graph is strongly connected if there is a directed path connecting any two nodes. A cycle is a connected graph where every node has exactly two neighbors. If V (G1 ) = V (G2 ) but E(G1 ) ⊆ E(G2 ) then G1 is a spanning subgraph of G2 . A spanning subgraph with no cycles is a spanning tree. A graph has a spanning tree iff it is connected.
3
Canonical problems
In this section, we present three typical problems and system classes often considered in the literature on interconnected systems which can be investigated using MTIDS: Interconnected LTI systems, the consensus problem and coupled oscillators.
3.1
Interconnected linear time invariant (LTI) systems
A very common system class when interconnected systems are treated is the class of interconnected LTI systems which are coupled in the state. The dynamics of the individual subsystem i can be written as X x˙ i (t) = Aii xi (t) + Aij xj (t) + Bi ui (t), j∈Ni,in
where xi (t) ∈ Rni is the state of the local subsystem, xj (t) is the state of subsystem j with j ∈ Ni,in and ui (t) is the local input. The set Ni,in is the set of nodes that have an influence on subsystem i. We can define a graph G = (V, E) corresponding to the system dynamics with nodes representing the subsystems and there is an edge (j, i) ∈ E iff Aij 6= 0, i.e. if subsystem j influences subsystem i. Thus, we can formally define Ni,in = {j|(j, i) ∈ E}. This system class is often used as a general system model in distributed control [5], or more specifically, for example, to model power systems [15], for models of vehicle string platoons [1] or for formation control [7, 14]. Stability and performance of controllers with respect to some cost functional is often of interest for interconnected LTI systems. MTIDS allows the easy construction and simulation of this system class and enables the user to process the simulation data for the desired analysis.
3.2
Consensus
Another common point of interest that is investigated thoroughly with regards to distributed systems is consensus. We refer to [22] for a summary of important results. In the consensus literature, it is often
3
assumed that the agent dynamics simple integrators x˙ i = ui . The typical consensus algorithm is Pare N constituted by the input ui (t) = j=1 Aij (xj (t) − xi (t)) such that the agent dynamics become x˙ i (t) = −
N X
Aij (xi (t) − xj (t)), i ∈ 1, ..., N,
(1)
j=1
where N is the number of nodes in the system. Aij is the (i, j)th entry of the adjacency matrix and describes if node i has access to the state information of node j, in addition to a gain for the consensus algorithm. Using the definition of the Laplacian matrix L, the overall system dynamics can be rewritten as x(t) ˙ = −Lx(t). From this equation, we can see that the convergence rate of the consensus algorithm is determined by the second smallest eigenvalue λ2 of L, where λ2 is also a measure for the connectivity of the graph. This means that higher connectivity leads to a faster consensus achievement. Since λ2 = 0 indicates that the graph is not connected, the convergence condition for undirected graphs is then simply that the graph is connected. For directed graphs, the conditions for consensus are slightly more complicated. Here, the consensus converges if the graph contains a rooted directed spanning tree [22]. Average consensus (the final attained state is the average of the initial conditions) is achieved iff the graph is strongly connected and balanced. For some applications (e.g. robot formation control), it is more fitting to use double integrator dynamics x ¨i (t) = ui (t). A possible consensus algorithm [21] is given by ui (t) =
N X
Aij ((xj (t) − xi (t)) + γ(x˙ j (t) − x˙ i (t))) ,
j=1
such that the resulting overall dynamics are x ¨(t) = −γLx(t) ˙ − Lx(t), where γ denotes a scaling or damping factor. This is identical to writing � �� � � � d x(t) 0n×n In x(t) = . −L −γL x(t) ˙ ˙ dt x(t) | {z }
(2)
Γ
It can then be shown that consensus is achieved iff the matrix Γ has exactly two zero eigenvalues and all other eigenvalues have negative real parts. We will show later that it is very easy to verify the convergence conditions using MTIDS.
3.3
Coupled oscillators
So far, we have only considered linear system dynamics. But naturally, some applications require the consideration of nonlinear local dynamics. One typical example that is often considered is the synchronization of coupled oscillators. These are investigated in the various fields of physics, mathematics, biology and engineering, e.g. with respect to power systems [6]. One particular case we want to consider is the so-called Kuramoto model which has the dynamics [19] N KX sin(θj (t) − θi (t)), θ˙i (t) = ωi + N j=1
where θi is the phase of the oscillator, ωi the frequency and N is the number of oscillators in the network. Note that this formula assumes all-to-all coupling of the oscillators. A condition to achieve synchronized frequencies (all θ˙i are identical to a common frequency ωsync ) and cohesive phases (|θi (t) − θj (t)| ≤ γ < π/2 for all i, j) is given by [6] K> max |ωi − ωj |. (3) i,j∈{1,...,N }
4
Template manager: - Add new templates - Edit numerical parameter sets
MTIDS Main Window: Program Start
- Create / edit graph - Edit individual node parameters - Edit plot parametrization
- Load graphs / systems from file
Simulink subsystem templates
- Export interconnected system to Simulink - Simulation in Simulink - Generate Plots
- Save graph / system to file - Export graph to workspace - Save simulation results to file or to workspace
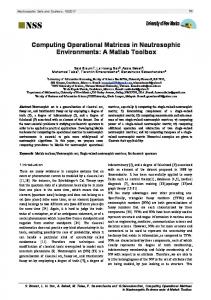
Figure 3: Workflow in MTIDS
3.4
Further system classes
In the previous subsections, we pointed out three system classes or problems that frequently appear in the literature on interconnected systems. But we want to stress the point that since MTIDS is based on Simulink, the variety of system classes that can be treated is far greater because the templates can contain any Simulink block including custom blocks. For example, we can have coupled transfer functions, delays, or nonlinear phenomena like saturation or quantization. If one was interested only in the simulation aspect and not in the graph analysis part, it could even be used to create timevarying graphs by modeling the actual interconnections as subsystems with time-varying throughput. In summary, the possibilities are vast, and cannot all be presented in detail.
4
Workflow
In this section, we want to explain the general steps of working with MTIDS. A visualization can be found in Figure 3. After the program start the main MTIDS window serving as the GUI of the program opens. In Figure 4, the GUI is shown with an already created graph. This window serves as the hub to the functionality of the program, and most importantly this is where the interconnection structure is designed. The workflow usually consists of the following steps.
4.1
Creation of subsystem dynamics
The underlying dynamics of the individual subsystems are specified in so-called templates which the user creates in Simulink. An empty template is provided which can be filled with the desired dynamics. These templates allow very general system dynamics by combining any desired Simulink blocks. After creating the desired subsystem dynamics, the user can import the new template into MTIDS. MTIDS includes a parameter set manager (PSM) which automatically identifies all parameters of the subsystem and asks the user to provide numerical values. Additionally, if the automatic detection of the PSM misses some parameters or blocks, they can be manually added here as well. The manager also checks if the values set by the user are valid and allowed by Simulink. It is possible to add several different parameter sets for each template. New parameter sets can be added, and old ones edited or deleted in the parameter set manager. The templates themselves are saved as Simulink *.mdl files, the corresponding parameter sets in a *.mat file, allowing to share the templates easily with other users. Some standard templates such as LTI systems or Kuramoto oscillators are already included in the software.
5
Figure 4: MTIDS GUI
4.2
Creation of the interconnection graph
When all necessary templates are added, the user can start with actually building the interconnected system by adding a specified number of nodes of a certain template. Afterwards, the user can easily add any connection between nodes as edges in the graph. MTIDS supports both directed and undirected graphs. With every added edge, some graph statistics are immediately updated and shown in a field below the graph. Furthermore, some fixed topologies can be created with dedicated buttons: Ring topology, complete graph and a random graph, where the random graph is implemented as an Erd¨ os-Renyi graph with edge probability 0.5. More specific topologies need to be created by hand. The user can also specify the node color of each template which is useful to distinguish nodes with different dynamics.
4.3
Editing specific settings of the system
We can access settings for a specific node by double-clicking it. Here, we can select if we want to automatically plot the system states or outputs of the node immediately after a simulation is run, and set parameters for the plots (line colors, styles, widths, markers). In addition, these settings include the dynamics template and the system parameters. This is an important advantage of MTIDS over directly using Simulink because it allows to easily change system dynamics while retaining the system interconnection structure. For example, if the user wants to compare the performance of several different local controllers, he can create templates with the respective controllers and then assign these templates to the nodes. The option to set the dynamics of all nodes to a specified template is also useful in this regard.
4.4
Simulation and post-processing
After the graph structure, template selection and parameter settings are finished, the user can either work with the graph representation of the system, or export the interconnected system to Simulink for a simulation. The latter automatically connects all the individual Simulink subsystems according to the templates and graph structure we select in MTIDS and sets all the parameters, thus creating an interconnected Simulink model.
6
Simulink simulation parameters, e.g. the solver, start time and stop time, can also be set in MTIDS. After the simulation is finished, plots of the simulation data can be generated automatically. Additionally, the simulation data can be exported to the base MATLAB workspace for further processing or be saved in a *.mat file. The software also allows to save both the graph and the simulation results in *.mat files. The graphs can be loaded again, thus allowing easy continuation of your work, or exchange of your work with colleagues.
5
Application examples
In this section, we illustrate the workflow with application examples from the canonical problems presented in Section 3. Important features and advantages of MTIDS are introduced as we follow the examples.
5.1
Interconnected linear time invariant (LTI) systems
In order to simulate interconnected LTI systems (Section 3.1), we first create a template for the individual subsystem dynamics. Every template in MTIDS is started with the empty template in Figure 5. The reader will notice the Mux block at the input. This Mux block should not be changed, nor should its input ports be used in the template because it is used to couple the systems to each other. We fill in the LTI dynamics to obtain Figure 6. The input u is set to 0 for now, but it could be replaced by any local controller. For example, this controller could either use only the local state xi (decentralized control), or additionally the state information xj from other subsystems (distributed control). MTIDS thus allows the evaluation of local control schemes through simulations. Next, we use the PSM to import the template into MTIDS and set the parameters. If we want LTI subsystems that are not identical, we can add several different sets of parameters. One important issue is that the matrix size of the gain Aij depends on the number of incoming states xj . For linear model parameters, MTIDS offers the possibility to enter the names of the parameters whose sizes depend on the number of external inputs. Then MTIDS always checks if these parameters have the right sizes before the export of the system to prevent Simulink simulation failures. After a successful parameter test, we can finish the import of the template. The newly added template and parameter set are immediately added in the main window of MTIDS where we can add nodes to the graph, and connect them with each other. For better visibility, they are arranged in a ring but they can be easily moved using the mouse. After adding edges, the parameters Aij of the subsystems do not have the correct sizes anymore. We could either enter them manually for every node, but MTIDS is also able to automatically set these size-dependent parameters with a suitable size by selecting the menu point Input parameter Adaptation, where we have different options to automatically set the parameters for all nodes:
Figure 5: Empty dynamics template
7
Figure 6: LTI template • Fill them with one specific constant value. • Set every entry to 1/n, where n is the number of incoming signals. • Average over the existing values if the parameter was set before. • Fill them with a random matrix. • Preserve the matrix if it was set already but concatenate with ones, or trim to the required size. This functionality of testing and setting the right sizes of parameters make quick simulations very easy when a system is changed which is a big advantage over using Simulink directly. When we are done with all the system parameters and graph connections, we start the export to Simulink and proceed with simulations of the system.
5.2
Consensus
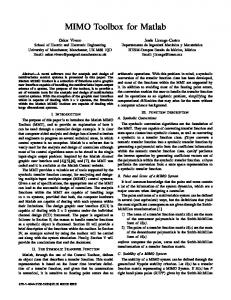
In Section 3.2, conditions for convergence of a consensus algorithm are given. Checking if a given interconnected system of simple integrators converges is very easy with MTIDS. For example, a very simple undirected connected graph is a ring. First, we design a consensus template implementing Eq. (1). Then we create 100 nodes and form the ring topology with the respective button. The statistics at the bottom show us that there is only one independent graph in the system, thus it is connected. We could actually stop here because of the implications of the theoretical results but we can also look at simulation results. Therefore we export the system and run the simulation. For random initial conditions, the consensus is shown in Figure 7. As expected, a consensus is reached and the resulting value is, also as expected, the average of the initial states. Furthermore, we validate the condition for average consensus in directed graphs: The graph must be strongly connected and balanced. To do this, we create two directed graphs with 20 nodes, one satisfying the conditions – a ring structure (1 → 2 → ... → 20 → 1) – and one that does not, namely a ring with an added edge in the opposite direction (e.g. 2 → 1). We can use the same template as before. We run the simulations using random initial conditions, and indeed with the ring structure the consensus converges to the average of the initial condition (1.329), while the unbalanced graph causes an offset (1.441). If we have double integrator dynamics it is also easy to check the convergence condition for a given graph. MTIDS allows the export of the Laplacian matrix to the workspace. Then the matrix Γ from Eq. (2) is easy to construct and be checked for the required properties.
5.3
Coupled Oscillators
In this subsection, we test the synchronization conditions for Kuramoto oscillators given in Eq. (3) in MTIDS. We investigate an interconnected system with 20 subsystems. The frequency ωi of each node is set to be a multiple of 0.1, so that ω1 = 0.1 for the first node and ω20 = 2 for the 20th node. The 8
critical value for the coupling K/N is then 1.9/20 = 0.095. Thus, we run one simulation with a value for K/N which is above this threshold (0.1) and one with K/N below it (0.05). The resulting plots are seen in Figure 8. We see that we have synchronized frequencies and cohesive phases when K/N is large enough in Figure 8(a) while synchronization fails in Figure 8(b) because the coupling is too weak.
6
Installation
MTIDS requires MATLAB/Simulink. It can be downloaded from the website http://code.google.com/p/mtids/ which also provides a handbook for the software.
7
Implementation
MTIDS is a MATLAB GUI that combines graph theory with numerical simulations of dynamical systems. For the graph theory aspect of the software, it builds on the software Matgraph [25]. We use functions from Matgraph mainly as the basis to create, store and draw the graph in the GUI. However, the functionality of the functions has been extended so that we can also treat directed graphs with MTIDS. The numerical simulations of MTIDS are based on Simulink because it offers a large variety of design options to create dynamical systems. The user has to use Simulink directly to create the dynamics of the individual subsystems, but he does not have to use the overall Simulink model of the interconnected system directly. Instead, the whole parametrization and settings of the overall model are done in MTIDS. In addition to the graph structure itself and general settings of the program, we save an associated dynamics template and parameter settings for every node. Only after the system graph and dynamics are finished in MTIDS, the system model is exported to Simulink so that the simulation can be run. During the export to Simulink, MTIDS automatically connects the subsystems according to the graph structure and sets the desired parameters. The simulation is then also run from MTIDS, and thus the user only uses Simulink to create (relatively small) subsystem dynamics. For graph analysis, MTIDS gives several measures for the graph. Naturally, the number of nodes and edges is shown. Additionally, several measures of the degrees are given (minimum, maximum, average). For undirected graphs, the graph density, heterogeneity, algebraic connectivity and number of independent graphs are calculated. For directed graphs, we also get the number of weakly and strongly connected subgraphs, as well as the information if the graph is balanced and if it has cycles. There is also the possibility for the user to export graph matrices (Laplacian matrix, adjacency matrix, edge list) to the MATLAB workspace for further computations.
states xi
5
0
−5 0
20
40
60 time t
Figure 7: Consensus for the undirected graph
9
80
100
states θi
π
0 0
5
10
15
time t
states θi
(a) Kuramoto oscillators with coupling above threshold
π
0 0
5
10
15
time t (b) Kuramoto oscillators with coupling below threshold
Figure 8: Kuramoto oscillators
8
Conclusion
In this article, we present a new MATLAB software called MTIDS which can be used to easily create and simulate large-scale interconnected systems in a graphical user interface. Several application examples are shown to illustrate how the program works and what it can be used for. It should be stressed that the functionality of MTIDS is not restricted to the presented applications. MTIDS is under active development. Many improvements are planned, for example additional graph analysis tools, weighted connections, switching topologies, and GUI optimization. Most importantly the automatic creation of graphs based on statistical measures like small-world or scale-free networks is a planned feature. Since the limitations on the program are given mainly by the possibilities of Simulink and system memory, the authors are also always open to suggestions by users, or even participation by interested programmers.
Acknowledgements The authors would like to thank Francisco Llobet, Jose Rivera and Ferdinand Trommsdorff for their work on MTIDS.
References [1] A. A. Alam, A. Gattami, and K. Johansson. Suboptimal decentralized controller design for chain structures: Applications to vehicle formations. In Proc. 50th IEEE Conf. on Decision and Control and European Control Conf. (CDC-ECC), pages 6894–6900, 2011. [2] R. M. Anderson and R. M. May. Infectious Diseases of Humans: Dynamics and Control. Oxford University Press, 1991. [3] M. A. Arbib, editor. The Handbook Of Brain Theory And Neural Networks. MIT Press, 2nd edition, 1998. [4] Y. Cao, W. Yu, W. Ren, and G. Chen. An overview of recent progress in the study of distributed multi-agent coordination. IEEE Transactions on Industrial Informatics, 9(1):427–438, 2012. [5] F. Deroo, M. Ulbrich, B. D. O. Anderson, and S. Hirche. Accelerated iterative distributed controller synthesis with a barzilai-borwein step size. In Proc. 51st IEEE Conf. on Decision and Control (CDC), pages 4864–4870, 2012. [6] F. D¨orfler, M. Chertkov, and F. Bullo. Synchronization in complex oscillator networks and smart grids. arXiv preprint arXiv:1208.0045, 2012. [7] J. A. Fax and R. M. Murray. Graph laplacians and stabilization of vehicle formations. In Proc. 15th IFAC World Congress, pages 88–98, 2002. [8] S. Garnier, J. Gautrais, and G. Theraulaz. The biological principles of swarm intelligence. Swarm Intelligence, 1(1):3–31, 2007. [9] C. D. Godsil and G. Royle. Algebraic graph theory. Springer New York, 2001. [10] D. Helbing. Traffic and related self-driven many-particle systems. Reviews of modern physics, 73(4):1067, 2001. [11] D. Hill and G. Chen. Power systems as dynamic networks. In Proc. of 2006 IEEE Int. Symposium on Circuits and Systems (ISCAS), pages 722–725, 2006. [12] G. I˜ niguez, J. Kert´esz, K. Kaski, and R. Barrio. Opinion and community formation in coevolving networks. Physical Review E, 80(6):066119, 2009. [13] S. Levin, B. Grenfell, A. Hastings, and A. Perelson. Mathematical and computational challenges in population biology and ecosystems science. Science, 275(5298):334–343, 1997. [14] Z. Lin, M. Broucke, and B. Francis. Local control strategies for groups of mobile autonomous agents. IEEE Transactions on Automatic Control, 49(4):622–629, 2004. [15] J. Liu, A. Gusrialdi, S. Hirche, and A. Monti. Joint controller-communication topology design for distributed wide-area damping control of power systems. In Proc. 18th IFAC World Congress, 2011. [16] Y.-Y. Liu, J.-J. Slotine, and A.-L. Barab´ asi. 473(7346):167–173, 2011.
Controllability of complex networks.
Nature,
[17] S. Low, F. Paganini, and J. Doyle. Internet congestion control. IEEE Control Systems, 22(1):28–43, 2002. [18] A. Nagurney, K. Ke, J. Cruz, K. Hancock, and F. Southworth. Dynamics of supply chains: a multilevel (logistical-informational-financial) network perspective. Environment and Planning B, 29(6):795–818, 2002. [19] R. Olfati-Saber, J. A. Fax, and R. M. Murray. Consensus and cooperation in networked multi-agent systems. Proceedings of the IEEE, 95(1):215–233, 2007. [20] B. Perrin, L. Ralaivola, A. Mazurie, S. Bottani, J. Mallet, and F. d’Alch´e–Buc. Gene networks inference using dynamic bayesian networks. Bioinformatics, 19(Suppl 2):ii138–ii148, 2003. 11
[21] W. Ren and E. Atkins. Distributed multi-vehicle coordinated control via local information exchange. International Journal of Robust and Nonlinear Control, 17(10-11):1002–1033, 2007. [22] W. Ren, R. Beard, and E. Atkins. Information consensus in multivehicle cooperative control. IEEE Control Systems, 27(2):71–82, 2007. [23] D. Rind. The sun’s role in climate variations. Science, 296(5568):673–677, 2002. [24] M. Rotkowitz and S. Lall. A characterization of convex problems in decentralized Control. IEEE Transactions on Automatic Control, 51(2):274–286, 2006. [25] E. R. Scheinerman. Matgraph: A MATLAB toolbox for Graph Theory. Johns Hopkins University, Baltimore, MD, USA, 2008. available at: http://www.ams.jhu.edu/∼ ers/matgraph/.
12