A Measurement Study of Changes in Service-Level Reachability in the Global Internet Michael F. Schwartz, University of Colorado, Boulder (
[email protected]) John S. Quarterman, Matrix Information and Directory Services, Inc. (
[email protected]) University of Colorado Technical Report CU-CS-649-93
May, 1993
Abstract The Internet is currently in a period of exponential growth, as measured by domain registrations and packet counts. Increasingly often, people want to know how fast a particular part of the Internet is growing - to do capacity planning, gauge commercial promise, or simply to understand this important change in our society. Yet, looking only at registrations and packet counts does not uncover the full complexity of the situation. There are a variety of ways that sites can connect to the Internet, each offering different capabilities, costs, and technical problems. Moreover, growing awareness of network security problems is changing the way people think about connecting to the Internet, based on mechanisms such as firewall gateways. In this paper we analyze Internet growth based on measurements of which of a dozen common TCP services could be reached at each of over 13,000 domains worldwide, tested four times over the course of 1992. We analyze this data as a function of country, type of institution, and type of service. We also derive mathematical models that can be used to project growth and disconnection rates for individual countries and the global Internet.
1. Introduction The global TCP/IP Internet is growing at a phenomenal rate. Because it promises potentially sweeping changes to the society, many people have become interested in projecting and understanding Internet growth rates. The commercial sector would like to know what market potential the Internet offers, and when to enter. The research and educational sector is interested both from the pragmatic perspective of when it will offer a true global village of schools, and from the more theoretical perspective of studying an important and rapidly moving force in the society. Governments want to know how to plan for and manage this burgeoning new global infrastructure. Engineers and developers want to know what to expect as they create new applications and network protocols. To date, most studies have measured network growth based on counts of registered sites, naming tables, or network provider-collected traffic statistics. Yet, because of the variety of ways that sites can choose to connect to the Internet and the range of different ways that sites use the Internet, these measures are difficult to interpret. For example, corporate sites often have thousands of hosts registered in the Domain Naming System [Mockapetris 1987], yet they typically erect barriers around their networks that limit network traffic (and hence the realm of potential applications and collaboration tools) in a variety of ways. In the current paper we analyze Internet growth based on direct measurements of what sites could be reached over the course of a year. Our analysis takes into account three different phenomena: the rate at which sites initiate some type of network connectivity (perhaps establishing only a single domain name registration with a network information center and arranging for mail to be forwarded to them through periodic dialup connections); the rate at which such sites become directly connected to the Internet, buying into the richer functionality that provides; and the rate at which sites back away from full Internet connectivity, usually for security reasons. The final category (distancing from the Internet) is what initially motivated us to begin this study. Because one of the authors is involved with research into networked information discovery and retrieval [Bowman, Danzig & Schwartz 1993, Schwartz 1993], he became concerned that security fears raised by well publicized security problems [National Research Council 1991, Spafford 1989, Stoll 1988] could eventually reduce large portions of the Internet to little more than a means of supporting
pre-approved point-to-point data transfers. While network distancing mechanisms are preferable to the damage that could occur from security violations, such diminished functionality could hinder or prevent the deployment of important new types of network services, impeding both research and commercial advancement. At the Fall 1990 Interop conference public session on security, David Clark of MIT referred to this possibility as "The Great Disconnection". To understand the evolution of this situation, we conducted a study to measure changes in Internet service-level reachability over a period of one year. The study considered upper layer services instead of basic network layer connectivity because the former indicates the willingness of organizations to participate in inter-organizational computing, which will be an important component of future wide area distributed applications. Our measurements provide a quantitative basis to discuss this phenomenon, as well as mathematical models of overall network growth. The data indicate growth and distancing rates as a function of geographic location and type of institution (commercial, educational, etc.), as well as the types of services sites are willing to run (and hence the type of networked collaboration they can support). We wish to stress that this is not an analysis of network security. The measurements we made did not attempt to probe the security mechanisms of any machine on the network. The study is concerned solely with the evolution of network connectivity and service reachability. The remainder of this paper is organized as follows. In Section 2 we define some basic terms needed for the analysis. In Section 3 we discuss our experimental methodology. In Section 4 we present measurements of growth in domains connecting to the Internet. In Section 5 we present measurements of domains distancing from the Internet, showing changes by county, type of institution, and service. In Section 6 we project trends, based on the measurements presented in Sections 4 and 5, plus longitudinal measurements of the Domain Naming System. In Section 7 we discuss related work. Finally, in Section 8, we offer our conclusions, and discuss possibilities for future work.
-2-
2. Definitions Styles of Disconnection There are a number of different ways that sites can reduce their closeness of association with the Internet. The most extreme measure is simply to disconnect from the Internet. Because of the tremendous advantages of Internet access, however, many sites prefer less extreme measures. A less extreme (and increasingly popular) measure is the use of a "firewall" gateway, which allows only certain types of traffic (such as electronic mail and news) into the site [Carl-Mitchell & Quarterman 1992], possibly with restrictions about who initiates the traffic. Many variations of this approach are possible. Terms
will not be usable at that site. This time period exceeds the timeout settings of most TCP-based services (such as telnet, WAIS, FTP, etc.) While electronic mail and news have longer timeouts, connectivity that only permits these services essentially reduces to that of periodic news/mail only connections, such as those obtained by using dialup UUCP [Nowitz & Lesk 1978] links. This definition does not include sites that only allow traffic to be initiated locally (i.e., those having only clients of outside Internet services). While such sites are certainly legitimate members of the Internet community, they do not contribute to the global infrastructure. Moreover, measuring such clients would require monitoring traffic to detect their existence.
3. Experimental Methodology
Throughout this paper when we refer to "sites" we mean organizational groupings inferred by the Domain Naming System. For example, the machine "abingdon.eng.sun.com" falls within the domain "eng.sun.com", which is a different domain (and hence site) than "central.sun.com", even though both domains belong to a single corporation (Sun Microsystems, Inc.). When discussing domain names explicitly, we use the term "domain". We use the term "institution" to refer to a collection of sites related to a single organization (Sun in the above example). The purpose of distinguishing between sites and institutions is to permit a more fine-grained analysis of the patterns of Internet disconnection and growth. In particular, a number of institutions allow direct Internet access to some of their sites, while restricting such access to other sites (e.g., allowing Internet access for a research branch of a company, while restricting such access for a product development branch). Our measurements reflect this level of detail.
In this section we discuss our experimental methodology. Readers interested in issues raised by this study concerning network appropriate use, privacy, or network/remote site load, are referred to our study plan [Schwartz 1991b].
As will be discussed in Section 3, we determined Internet connectivity through a series of connection attempts spread over a 1-2 day period (which we term a measurement cycle). Because of this approach, we define Internet connectivity as a site’s being reachable via any of the tested services at some time during the measurement cycle. This definition does not include certain types of Internet connectivity, such as periodic SLIP [Romkey l988] connections, and sites that were unreachable throughout a particular measurement cycle (e.g., because of external gateway problems). Practically speaking, this definition is reasonable: if a site is not reachable for such a long period of time, most network services
We generated the site list from a broad variety of sources. In total, the list contained 90,888 hosts, gathered from USENET news headers, FTP and mail access logs at the University of Colorado, the DDN Network Information Center Internet host table [Feinler et al. 1982], and the output of Lottor’s ZONE program, which recursively descends the
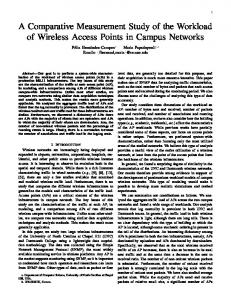
The study consisted of a set of runs of a program over the span of a one to two day measurement cycle, repeated four times over the period of one year. Each program run attempted to connect to 13 different TCP services at each of 13,749 Internet domains worldwide (indicated in Table 1)1, recording the failure/success status of each attempt. The program attempted no data transfers in either direction. If a connection was successful, it was simply be closed and counted.2 The machines on which connections were attempted were selected at random from a large list of machines in the Internet, constrained such that at most 3 machines were contacted in any particular domain. Figure 1 plots the set of reachable domains from January 1992 geographically, to give an intuitive feel for where the measurements reached.
hhhhhhhhhhhhhhhhhh 1 The correspondence between top-level domains and geography is actually not precise. For example, there are Canadian, Swiss, and other nationalities of companies in the com domain. For more information, see [Quarterman 1992]. 2 Note in particular this means that the security mechanism behind individual network services was not tested.
-3iiiiiiiiiiiiiiiiiiiiiiiiiiiiiiiiiiiiiiiiiiiiiiiiiiiiiiiiiiiiiiiiiiiiiiiiiiiiiiiiiiiiiiiiiiiiiiiiiiiiii c Top-Level c c Sub-Domains c c Top-Level c c Sub-Domains c Description Description c Domain Name c c c c c c c Tested Domain Name Tested iiiiiiiiiiiiiiiiiiiiiiiiiiiiiiiiiiiiiiiiiiiiiiiiiiiiiiiiiiiiiiiiiiiiiiiiiiiiiiiiiiiiiiiiiiiiiiiiiiiiii c c c cc c c c 7 3 c ar c Argentina c c c in c India c c c is c Iceland c c c int c International c c 27 1 c arpa c Obsolete Names c c c it c Italy c c 202 120 c c c cc c c c at Austria 94 jp Japan 638 c c c cc c c c 496 27 c au c Australia c c c kr c Korea c c c be c Belgium c 28 c c lk c Sri Lanka c 1 c c br c Brazil c c c mil c U.S. Military c c 16 230 c ca c Canada c c c mx c Mexico c c 561 14 c c c cc c c c 93 6 c ch c Switzerland c c c my c Malaysia c c 5 1 c cl c Chile c c c na c Namibia c c c cn c China c c c net c Network Administrations c c 1 187 c co c Columbia c c c ni c Nicaragua c c 2 1 c c c cc c c c 3,082 231 c com c U.S. Commercial c c c nl c The Netherlands c c 1 171 c cr c Costa Rica c c c no c Norway c c c cs c Former Czechoslovakia c 5 c c nz c New Zealand c 76 c c de c Germany c c c org c Non-profit c c 551 625 c dk c Denmark c c c ph c Phillipines c c 192 2 c c c cc c c c 3,735 1 c edu c U.S. Educational c c c pl c Poland c c 1 3 c ee c Estonia c c c pr c Puerto Rico c c c es c Spain c c c pt c Portugal c c 144 10 c fi c Finland c c c se c Sweden c c 168 531 c c c cc c c c 173 6 c fr c France c c c sg c Singapore c c 642 44 c gb,uk c United Kingdom c c c su c Former Soviet Union c c c gov c U.S. Government c 255 c c th c Thailand c 1 c c gr c Greece c c c tn c Tunisia c c 13 1 c hk c Hong Kong c c c c c c 4 tw Taiwan 6 c c c cc c c c hu Hungary 1 us United States 240 c c c cc c c c 29 2 c ie c Ireland c c c yu c Former Yugoslavia c c il 24 18 cciiiiiiiiiiiiiiiiiiiiiiiiiiiiiiiiiiiiiiiiiiiiiiiiiiiiiiiiiiiiiiiiiiiiiiiiiiiiiiiiiiiiiiiiiiiiiiiiiiiiii cc Israel cc cc cc za cc South Africa cc cc
Table 1: Domains Tested by Measurement Process Domain Naming tree, retrieving information about all domains that allow "zone transfers" [Lottor 1992a]. The breadth of these information sources is important, as it helps ensure that a wide cross-section of sites were tested, without perturbing our results because of limitations of particular site lists. Individual connection attempts were timed-out after 20 seconds. If a domain experienced 3 timeouts on any port (on 3 different machines), the measurement software gave up trying that domain for the duration of the measurement cycle. A measurement cycle consisted of several runs of the program, executed successively until the service reachability counts between two runs differed by no more than 1%. This required between three and six runs, each spanning 4-30 hours (longer in earlier runs, when more sites were tested). Therefore, during each measurement cycle, each domain was given a total of three 20-second timeouts per set of connection attempts, and several sets of attempts over the period of a day or two.
The services to which connections were attempted are indicated in Table 2. This list was chosen to span a representative range of service types, each of which can be expected to be found on any machine in a site (so that probing random machines would be meaningful). The one exception is the Domain Naming System, for which the machines to probe were selected from information obtained from the Domain system itself. Only TCP services were tested, since the TCP connection mechanism allows one to determine if a server is running in an application-independent fashion. It would have been possible to retrieve "Well Known Service" records from the Domain Naming System, as a somewhat less "invasive" measurement approach. However, these records are not required for proper network operation, and often are inaccurate. The only way to collect the data for this study was to measure it using attempted connections. Another experimental design choice we made was to test a fixed set of sites throughout each study
-4-
Figure 1: Reachable Domains
-5-
i iiiiiiiiiiiiiiiiiiiiiiiiiiiiiiiiii ciPort c Number c Service iiiiiiiiiiiiiiiiiiiiiiiiiiiiiiiiii c c c 13 c c daytime c 15 c c netstat c c 21 c FTP c c c telnet c 23 c c SMTP c 25 c c c 53 c c Domain Naming System c 79 c c finger c c 111 c Sun portmap c c c rlogin c 513 c c rsh c 514 c c c 540 c c UUCP c 543 c c klogin c ci iiiiiiiiiiiiiiiiiiiiiiiiiiiiiiiiii 544 c krcmd, kshell c Table 2: Network Services Tested cycle. An alternative approach that we tried during our preliminary study [Schwartz 1991a] was to incorporate newly discovered/registered sites in the site list between each run, in an attempt to measure connectivity of the growing Internet. We opted away from this approach in the current study because it is difficult to distinguish between the effects of the growth of the site list and actual service reachability changes. To differentiate between these two phenomena, one would need to create a complete list of Internet sites for each measurement cycle, so that site unreachability would only reflect disconnections (as opposed to uneven accumulation of sites in the site list). However, given the decentralized nature of the Internet, amassing a complete list would be quite difficult. By using a large, fixed site list for the study, we could measure the rate at which previously existing sites connect or disconnect from the Internet.
4. Growth in Domains Connecting to the Internet In this section we present measurements of growth in reachable Internet domains. We will use these measurements in Section 6 when we try to extrapolate growth and disconnection trends in the Internet. The measurements also demonstrate some surprising characteristics in themselves, which we use as a basis for speculating about the nature of global network connectivity patterns. Figure 2 plots the count of reachable domains over time. Given that the Internet is currently experiencing exponential growth [Merit, Inc. 1992], it was surprising that the curve appears to be leveling off. A likely explanation is that by the final measure-
ment period we had reached nearly all domains in the site list that were going to connect any time soon (e.g., until even very small companies routinely establish continuous Internet 6000 . . .. . . .. . . . .. . . . .. . . .. . . . .. . . . .. . . .. . . . .. . . 5500 . . .. . . .. . . . .. . . . .. . . .. . . . .. . . . .. . . .. . . . .. . . Reachable 5000 . . .. . . .. . . . .. . . . .. . . .. . . . .. . . . .. . . .. . . . .. . . Domains 4500 . . .. . . .. . . . .. . . . .. . . .. . . . .. . . . .. . . .. . . . .. . . 4000 . . .. . . .. . . . .. . . . .. . . .. . . . .. . . . .. . . .. . . . .. . . 3500 . . .. . . .. . . . .. . . . .. . . .. . . . .. . . . .. . . .. . . . .. . . Jan
Apr
Jul
Oct
Measurement Cycle Figure 2: Total Reachable Domains
connections). This hints that on average, the time from a site acquiring a domain name to gaining Internet connectivity is less than one year. In turn this indicates the coming ubiquity of Internet connectivity. In the past a common mode was having a domain name with just a periodic dialup (often UUCP-based) connection. Figure 2 indicates that domains now tend to acquire both a name and Internet connectivity within a small time frame. While UUCP is less expensive, the Internet is more capable, and tends to draw organizations into connectivity. Figure 3 plots the site counts for each top-level domain that showed up as one of the ten with highest count during each of the measurement runs. 2400 . . . .. . . .. . . . .. . . . .. . . .. . . . .. . . . .. . . . .. . . .. . edu 2200 . . . .. . . .. . . . .. . . . .. . . .. . . . .. . . . .. . . . .. . . .. . 2000 . . . .. . . .. . . . .. . . . .. . . .. . . . .. . . . .. . . . .. . . .. . 1800 . . . .. . . .. . . . .. . . . .. . . .. . . . .. . . . .. . . . .. . . .. . com Reachable 600 . . . .. . . .. . . . .. . . . .. . . .. . . . .. . . . .. . . . .. . . .. . Domains 500 . . . .. . . .. . . . .. . . . .. . . .. . . . .. . . . .. . . . .. . . .. . 400 . . . .. . . .. . . . .. . . . .. . . .. . . . .. . . . .. . . . .. . . .. . 300 . . . .. . . .. . . . .. . . . .. . . .. . . . .. . . . .. . . . .. . . .. . 200 . . . .. . . .. . . . .. . . . .. . . .. . . . .. . . . .. . . . .. . . .. . 100 . . . .. . . .. . . . .. . . . .. . . .. . . . .. . . . .. . . . .. . . .. . Jan
Apr
Jul
Measurement Cycle Figure 3: Most Reachable Top-Level Domains
Oct
ca au de jp se
-6-
The fact that connectivity counts decreased a bit in later measurement cycles indicates a combination of service disconnections and network availability problems - both of which count as disconnections, based on our definition of Internet connectivity. Interestingly, the plots do not cross, indicating that growth is fairly consistent across these top-level domains. It is also interesting to note that we saw approximately the same order of the first few top-level domains in other network connectivity data for completely different networks, such as UUCP, FidoNet, and BITNET [Quarterman 1993a]. This hints that network connectivity is a sociological phenomenon, with certain trends that transcend particular networking technologies. For more discussion of this point, see [Quarterman 1993b].
combined, because the Internet originated in the U.S. (as the ARPANET). Yet, Figure 5 shows that several less-populated countries lead the U.S. in connected domains per unit population. It is interesting to note the similar growth patterns in this plot for the more highly networked countries that are culturally and geographically close, such as Norway and Sweden, the U.S. and Canada, and Finland and Denmark. 60 . . .. . . . .. . . . .. . . . .. . . . .. . . . .. . . . .. . . . .. . . .. is 50 . . .. . . . .. . . . .. . . . .. . . . .. . . . .. . . . .. . . . .. . . .. 40 . . .. . . . .. . . . .. . . . .. . . . .. . . . .. . . . .. . . . .. . . .. 30 . . .. . . . .. . . . .. . . . .. . . . .. . . . .. . . . .. . . . .. . . .. 24 . . .. . . .. . . . .. . . . .. . . . .. . . .. . . . .. . . . .. . . . .. . 22 . . .. . . .. . . . .. . . . .. . . . .. . . .. . . . .. . . . .. . . . .. . no
Figure 4 plots reachable domain counts for each country.3 3450 . . . .. . . .. . . . .. . . . .. . . .. . . . .. . . . .. . . .. . . . . us 3150 . . . .. . . .. . . . .. . . . .. . . .. . . . .. . . . .. . . .. . . . . 2850 . . . .. . . .. . . . .. . . . .. . . .. . . . .. . . . .. . . .. . . . . 2550 . . . .. . . .. . . . .. . . . .. . . .. . . . .. . . . .. . . .. . . . . ca 360 . . .. . . . .. . . . .. . . .. . . . .. . . . .. . . .. . . . .. . . . . 330 . . .. . . . .. . . . .. . . .. . . . .. . . . .. . . .. . . . .. . . . .
20 . . .. . . .. . . . .. . . . .. . . . .. . . .. . . . .. . . . .. . . . .. . se Reachable . . .. . . .. . . . .. . . . .. . . . .. . . .. . . . .. . . . .. . . . .. . Domains 18 per 16 . . .. . . .. . . . .. . . . .. . . . .. . . .. . . . .. . . . .. . . . .. . au 1,000,000 People 14 . . .. . . .. . . . .. . . . .. . . . .. . . .. . . . .. . . . .. . . . .. . us,ca 12 . . .. . . .. . . . .. . . . .. . . . .. . . .. . . . .. . . . .. . . . .. . fi dk 10 . . .. . . .. . . . .. . . . .. . . . .. . . .. . . . .. . . . .. . . . .. .
300 . . .. . . . .. . . . .. . . .. . . . .. . . . .. . . .. . . . .. . . . . 270 . . .. . . . .. . . . .. . . .. . . . .. . . . .. . . .. . . . .. . . . . au
8 . . .. . . .. . . . .. . . . .. . . . .. . . .. . . . .. . . . .. . . . .. . nz
240 . . .. . . . .. . . . .. . . .. . . . .. . . . .. . . .. . . . .. . . . . de Reachable . . .. . . . .. . . . .. . . .. . . . .. . . . .. . . .. . . . .. . . . . jp Domains 210 180 . . .. . . . .. . . . .. . . .. . . . .. . . . .. . . .. . . . .. . . . . se,gb,uk 150 . . .. . . . .. . . . .. . . .. . . . .. . . . .. . . .. . . . .. . . . . 120 . . .. . . . .. . . . .. . . .. . . . .. . . . .. . . .. . . . .. . . . . 90 . . .. . . . .. . . . .. . . .. . . . .. . . . .. . . .. . . . .. . . . . no,nl fr 60 . . .. . . . .. . . . .. . . .. . . . .. . . . .. . . .. . . . .. . . . . fi,dk it 30 . . .. . . . .. . . . .. . . .. . . . .. . . . .. . . .. . . . .. . . . . nz,ch,at,es, il,is,za,mx, kr,ie,gr,be, 0 . . .. . . . .. . . . .. . . .. . . . .. . . . .. . . .. . . . .. . . . . br,hk,tw,pt, cl,sg,pr,tn Jan Apr Jul Oct hu,ar,in Measurement Cycle Figure 4: Reachable Domains by Country
The U.S. had more domains than all other countries hhhhhhhhhhhhhhhhhh 3 In this and the following country plot, the U.S. entries included domains in the "com", "edu", "gov", "mil", and "us" domains. In all other plots, "us" refers explicitly to the top-level "us" domain.
6 . . .. . . .. . . . .. . . . .. . . . .. . . .. . . . .. . . . .. . . . .. . nl 4 . . .. . . .. . . . .. . . . .. . . . .. . . .. . . . .. . . . .. . . . .. . ch,il,at de,gb,uk,ie 2 . . .. . . .. . . . .. . . . .. . . . .. . . .. . . . .. . . . .. . . . .. . jp,fr,gr be,it,es,pr, 0 . . .. . . .. . . . .. . . . .. . . . .. . . .. . . . .. . . . .. . . . .. . pt,za,kr,tn, mx,br Jan Apr Jul Oct Measurement Cycle Figure 5: Reachable Domains by Population
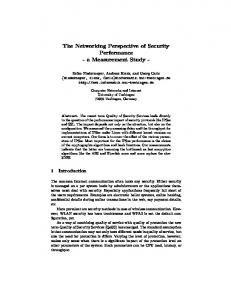
5. Domain Distancing Measurements Figure 6 plots the percentage of top-level domains that were reachable at some earlier time and then became isolated for the remainder of the measurement runs (through October 1992), for each measurement cycle. By isolated we mean that a host in a higher level domain in that site could be reached, but no hosts in the domain in question could be reached. For example, if hosts within the colorado.edu domain
-7-
edu 7 . .. . . . .. . . .. . . . .. . . . .. . . .. . . . .. . . . .. . . . .. mil
edu’s 2800 . .. . . . .. . . . .. . . .. . . . .. . . . .. . . .. . . . .. . . . ..
6 . .. . . . .. . . .. . . . .. . . . .. . . .. . . . .. . . . .. . . . ..
2400 . .. . . . .. . . . .. . . .. . . . .. . . . .. . . .. . . . .. . . . ..
5 . .. . . . .. . . .. . . . .. . . . .. . . .. . . . .. . . . .. . . . .. au % Prev. se Reachable 4 . .. . . . .. . . .. . . . .. . . . .. . . .. . . . .. . . . .. . . . .. gov ca Reachable Domains Domains de Isolated by 3 . .. . . . .. . . .. . . . .. . . . .. . . .. . . . .. . . . .. . . . .. that Date it jp,nl 2 . .. . . . .. . . .. . . . .. . . . .. . . .. . . . .. . . . .. . . . .. fi gb,uk 1 . .. . . . .. . . .. . . . .. . . . .. . . .. . . . .. . . . .. . . . .. com no,net,dk . .. . . . .. . . .. . . . .. . . . .. . . .. . . . .. . . . .. . . . .. 0 Jan
Apr
Jul
Oct
Measurement Cycle
2000 . .. . . . .. . . . .. . . .. . . . .. . . . .. . . .. . . . .. . . . .. 1600 . .. . . . .. . . . .. . . .. . . . .. . . . .. . . .. . . . .. . . . .. 1200 . .. . . . .. . . . .. . . .. . . . .. . . . .. . . .. . . . .. . . . .. other’s 800 . .. . . . .. . . . .. . . .. . . . .. . . . .. . . .. . . . .. . . . .. com’s 400 . .. . . . .. . . . .. . . .. . . . .. . . . .. . . .. . . . .. . . . ..
gov’s mil’s,net’s . .. . . . .. . . . .. . . .. . . . .. . . . .. . . .. . . . .. . . . .. 0 org’s Jan
Apr
Jul
Oct
Measurement Cycle
Figure 6: Domains Becoming Isolated
Figure 7: Reachability Changes by Type of Site
could be reached but none within cs.colorado.edu could be reached, cs.colorado.edu would be an isolated domain. This definition highlights sites that use firewall gateways that only allow mail and news to be exchanged through forwarding.
measurement cycle. Somewhat surprisingly, potentially invasive services like telnet and FTP exhibit very similar curves to SMTP, even though the latter is an "at arms length" service. Apparently, sites do not tend to turn off just the most security sensitive services. Also somewhat surprising was the fact that who, finger, and daytime were reachable nearly as often, even though they support less general-purpose applications and are used less frequently (as indicated by NSFNET network traffic measurements). Based on the plots, there appears to be a trend to turn off these services.
A top-level domain’s being low in Figure 6 indicates either that its subdomains do not significantly distance themselves from the Internet, or that they had already distanced themselves before our first measurement cycle. For example, sites in the "com" domain often connect to the Internet with firewall gateways installed from the outset. Figure 7 plots changes in service reachability as a function of type of institution. For this analysis we divided the top-level domains based on naming conventions where available - such as "com" in the U.S. and "co.kr" in Korea. This figure indicates that reachability does not change much within a type of institution, with the surprising exception of educational sites. We had expected the largest changes proportionately to be in the commercial domains. A likely explanation is that educational domains tend to start off directly connected to the Internet, while other types of institutions typically take a more cautious approach. Figure 8 plots changes in reachability of the tested services. As expected, telnet, FTP, and SMTP remain the most commonly available services, although there was a slight decrease in the final
Sun RPC and UUCP show the most marked drops. We speculate that people are turning UUCP off entirely, because the number of connections refused for UUCP is not decreasing as quickly as for the other services. The only services that seem to continue gaining in reachability are netstat, kshell, and klogin. The fact that refused connections dropped off more precipitously for kshell and klogin in the final measurement run may indicate a move to more authenticated services in the Internet. Possibly netstat shows increases because people are using it to set "tcpd" traps. If so, that would make all three of netstat, kshell, and klogin security features, indicating that people are probably changing them all at once for improved security.
-8-
6000 . .. . . . .. . . . .. . . . .. . . . .. . . . .. . . . .. . . .. . .
telnet FTP 5000 . .. . . . .. . . . .. . . . .. . . . .. . . . .. . . . .. . . .. . . SMTP who finger rsh 4000 . .. . . . .. . . . .. . . . .. . . . .. . . . .. . . . .. . . .. . . daytime sunrpc Count
3000 . .. . . . .. . . . .. . . . .. . . . .. . . . .. . . . .. . . .. . . 2000 . .. . . . .. . . . .. . . . .. . . . .. . . . .. . . . .. . . .. . .
klogin, 6000 . . .. . . .. . . . .. . . . .. . . .. . . . .. . . .. . . . .. . . . kshell netstat 5000 . . .. . . .. . . . .. . . . .. . . .. . . . .. . . .. . . . .. . . . 4000 . . .. . . .. . . . .. . . . .. . . .. . . . .. . . .. . . . .. . . .
uucp
3000 . . .. . . .. . . . .. . . . .. . . .. . . . .. . . .. . . . .. . . . uucp
1000 . .. . . . .. . . . .. . . . .. . . . .. . . . .. . . . .. . . .. . . netstat klogin, 0 . .. . . . .. . . . .. . . . .. . . . .. . . . .. . . . .. . . .. . . kshell Jan Apr Jul Oct
sunrpc daytime finger 2000 . . .. . . .. . . . .. . . . .. . . .. . . . .. . . .. . . . .. . . . rsh who FTP . . .. . . .. . . . .. . . . .. . . .. . . . .. . . .. . . . .. . . . SMTP 1000 telnet 0 . . .. . . .. . . . .. . . . .. . . .. . . . .. . . .. . . . .. . . . Jan
Reachable Services
Apr
Jul
Oct
Unreachable Services
Figure 8: Reachability by Service
6. Putting Together the Trends In this section we estimate overall Internet growth rates, taking into account the rates of creation of new hosts, domains connecting to the Internet, and domains disconnecting from the Internet. To do this, we created regression models for each of the toplevel domains from Lottor’s host count data [Lottor 1992a, Lottor 1992b], and scaled these functions by domain connection probabilities computed from the current study data. For the host creation rate regression models we first dropped measurement values that were obviously the result of network problems. For example, Lottor’s April 1992 run could not measure any hosts in Korea, even though 1,506 and 2,902 were measured in January and July, respectively. Note that these models are imperfect because some domains do not allow "zone transfers", which could mean entire subtrees are excluded from consideration. We tried both linear and curvilinear regression models on each of the top-level domains, and selected the model with the largest coefficient of determination (except in cases where both were quite high, in which case we preferred the exponential function). Where linear models fit better, the explanation was probably that only one year’s worth of data was available that gave breakdowns by top-level domain (in [Lottor 1992b]), and the growth functions had all passed the knees of their presumably exponential growth curves by that time. It is also possible that those growth rates truly
are linear, although that seems less likely. We computed connection probabilities by plotting the domain reachability counts for each measurement cycle, approximating the asymptotes the curves were approaching, and dividing these values by the total domain counts for each. For example, we tested 230 mil domains, and found an approximate asymptote at 160, leading to a .70 connection probability. Table 3 shows the computed regression curves and domain connection probabilities for top-level domains that were measured by both studies, and for which the current study tested at least 10 domains. Looking at the regression models, the "com" domain is clearly the fastest growing: all of the top-level domains that have larger bases have much smaller multiplicative constants. These other models primarily reflect networked populations which, because of their small size, have rapid growth rates that will likely slow in the near future. We also computed overall growth rates (listed as "ALL" in the table). These rates are much more accurate, because 10 years worth of that data was available (in [Lottor 1992a]). Note that while the DNS data shows no leveling off in the domain creation rate, at some point growth must level out. Hence, our models only have predictive value during perhaps the next two to three years, during which time exponential growth will likely continue to occur.
-9i iiiiiiiiiiiiiiiiiiiiiiiiiiiiiiiiiiiiiiiiiiiiiiiiiiiiiiiiiiiiiiiiiiiiiiiiiiiiiiiiiiiiiiiiiiiiiiiiiiii c c Coeff. c Conn. c c Top c c Coeff. c Conn. c Top Regression Regression c Level c c c c c c c c Prob. c Model of Prob. Level Model of c c c c cc c c c c Domain Determ. Domain Determ. ci iiiiiiiiiiiiiiiiiiiiiiiiiiiiiiiiiiiiiiiiiiiiiiiiiiiiiiiiiiiiiiiiiiiiiiiiiiiiiiiiiiiiiiiiiiiiiiiiiiii c c c cc c c c c c aq c Y = 3.45e+04 * 0.93X c c Y = 1.73e-05 * 1.10X c 1.00 c N c c in 0.95 c F c c ar c Y = 2.55e-37 1.93X c c Y = 9.83e-03 1.07X c 0.75 c 0.14 c c int 0.86 c F c * * c c c c cc c c c c X X arpa Y = 3.74e-05 1.10 1.00 0.00 is Y = 2.03e-05 1.14 0.99 0.70 * * c c c c cc c c c c X X 0.97 c N c c it 0.98 c 0.38 c c at c Y = 3.76e-02 * 1.10 c c Y = 2.54e-02 * 1.10 c c au c Y = 2821.50X + 3.21e+05 c 1.00 c 0.55 c c jp c Y = 6.71e-02 * 1.10X c 0.99 c 0.34 c c be c Y = 151.00X + 1.84e+04 c c Y = 1.75e-03 * 1.12X c 0.94 c N c c kr 1.00 c 0.41 c c br c Y = 144.57X + 1.80e+04 c c Y = 3.49e+01 1.01X c 0.88 c N c c lu 0.96 c F c * c c c c cc c c c c X 1.00 c 0.67 c c mil 0.98 c 0.70 c c ca c Y = 1996.83X + 2.23e+05 c c Y = 7.09e-01 * 1.09 c 1.00 c 0.34 c c mx 0.99 c 0.71 c c ch c Y = 1.73e+01 * 1.05X c c Y = 3.31e-07 * 1.18X c c cl c Y = 3.32e-10 * 1.23X c c c net c Y = 6.63e-04 * 1.13X c 1.00 c F 0.93 c 0.72 c c com c Y = 1.04e+02 1.06X c c c c nl c Y = 1104.73X + 1.24e+05 c 0.97 N 0.93 c 0.42 c * c c c c cc c c c c 0.98 c F 0.99 c N c c cs c Y = 98.47X + 1.24e+04 c c c no c Y = 736.87X + 8.18e+04 c 0.97 c 0.45 c c nz 0.96 c 0.39 c c de c Y = 2148.50X + 2.37e+05 c c Y = 97.30X + 1.10e+04 c c dk c Y = 6.25e-03 * 1.11X c 0.94 c 0.31 c c org c Y = 1037.30X + 1.10e+05 c 0.99 c N c c ec c Y = 2.80X + 3.56e+02 c c c pl c Y = 88.53X + 1.09e+04 c 0.60 c F 0.99 c F c c edu c Y = 7.03e+02 1.05X c c Y = 81.20X + 9.32e+03 c 1.00 c 0.66 c c pt 0.98 c N c * c c c c cc c c c c X X 1.00 c F 0.92 c 0.34 c c ee c Y = 6.80e-10 * 1.21 c c c se c Y = 5.23e+02 * 1.03 c 1.00 c N c c sg 0.97 c F c c es c Y = 348.97X + 4.20e+04 c c Y = 72.27X + 8.51e+03 c c fi c Y = 693.13X + 7.46e+04 c c Y = 4.50X + 5.72e+02 c 0.98 c 0.35 c c su 0.60 c F c c fr c Y = 960.17X + 1.07e+05 c c Y = 7.16e-14 1.26X c 1.00 c N c c th 1.00 c F c * c c c c cc c c c c 1.00 c N c c tn Y = -1.60X + 2.20e+02 0.55 N c c gb,uk c Y = 3220.23X + 3.84e+05 c c c c X X 1.00 F c c gov c Y = 1.04e+02 * 1.05 c c 0.64 c c tw c Y = 6.14e-05 * 1.14 c 0.96 c c gr c Y = 36.57X + 4.20e+03 c 0.91 c N c c us c Y = 3.54e-06 * 1.15X c 0.88 c 0.03 c c hk c Y = 267.93X + 3.30e+04 c 0.97 c 1.00 c c ve c Y = 9.92e-02 * 1.03X c 0.75 c F c c hu c Y = 3.14e-11 1.24X c c c c c c c X 0.99 F yu Y = 5.50e-01 * 1.03 1.00 F c * c c c c cc c c c c X ie Y = 1.44e-03 1.10 0.98 N za Y = 209.07X + 2.52e+04 0.99 N * c c c c cc c c c c X N c c ALL ciiliiiiiiiiiiiiiiiiiiiiiiiiiiiiiiiiiiiiiiiiiiiiiiiiiiiiiiiiiiiiiiiiiiiiiiiiiiiiiiiiiiiiiiiiiiiiiiiiiiii c Y = 99.10X + 1.03e+04 c 0.91 c c Y = 9.77e+01 * 1.07 c 0.98 c 0.41 c c
Table 3: Overall Reachable Internet Site Growth Regression Models and Connection Probabilities Incorporates DNS growth rates, rates of connection to the Internet, and rates of distancing from the Internet X = months since August 1981; Y = modelled host count "F" for connection prob. = collected data about fewer than 10 domains "N" for connection prob. = was not approaching an asymptote during measurements Internet connectivity growth functions can be obtain by multiplying each regression function in Table 3 by the corresponding connection probability. Figure 9 plots these functions for each top-level domain (plus all domains combined) whose coefficient of determination exceeded .9, and for which we tested at least 10 subdomains and were also able to compute a domain connection probability. Note that the X-intercept of the various curves represent the modeled time when that domain joined the Internet, based on Lottor’s DNS data. While it would be interesting to project when counts will cross each other, for the sake of legibility we only plotted through January 1994. Moreover, we could not predict the time when growth will level out, which would be a critical aspect of such projections.
7. Related Research A number of researchers and Network Operations Center personnel have measured network characteristics such as packet traffic and protocol usage [Heimlich 1990, Horvath 1990, NSF Network Service Center 1989]. To the best of our knowledge, no research has been conducted concerning the evolution of Internet service reachability. Lottor’s ZONE software recursively traverses the Domain Naming System name tree, using "zone transfers" to retrieve host information [Lottor 1990]. Lottor’s recently published ten year study counted the number of hosts in domains that have IP addresses registered in the DNS [Lottor 1992a]. However, many of the hosts counted by Lottor’s study are hidden behind firewall gateways, or in some other way are not directly connected to the
- 10 -
ALL
For a discussion of the size of the set of computer networks interconnected for at least mail or news service, see [Quarterman 1990]. For a measure of the diameter of the interpersonal communication graph enabled by electronic mail, see [Schwartz & Wood 1992]. Finally, we urge anyone considering performing an Internet measurement study to read [Cerf 1991].
2e+06 . . . .. . . . .. . . . .. . . . .. . . .. . . . .. . . . .. . . .. 1.5e+06 . . . .. . . . .. . . . .. . . . .. . . .. . . . .. . . . .. . . .. 1e+06 . . . .. . . . .. . . . .. . . . .. . . .. . . . .. . . . .. . . .. 500000 . . . .. . . . .. . . . .. . . . .. . . .. . . . .. . . . .. . . ..
ary 1991 list were reachable by our January 1992 measurement cycle.
edu mil
Modeled . . . .. . . . .. . . . .. . . . .. . . .. . . . .. . . . .. . . .. Number 0 Reachable gov Hosts 100000 . . . . .. . . . .. . . . .. . . . .. . . .. . . . .. . . . .. . . .
80000 . . . . .. . . . .. . . . .. . . . .. . . .. . . . .. . . . .. . . . net
8. Conclusions When faced with the question of how fast the Internet is growing and what that growth will mean to commerce, research and education, and the society at large, people typically turn to numbers provided by network registration tables or traffic counts. These measurements are difficult to interpret, because of the range of different ways that sites connect to and use the Internet. In this paper we presented measurements of Internet growth based on tests of what services could be reached at over 13,000 sites, in four different measurement cycles over the course of a year. Our analysis uncovers a number of issues.
First, while some sites are clearly distancing themselves from the Internet, the rate of disconnection is far outstripped by the growth rate of new 60000 . . . . .. . . . .. . . . .. . . . .. . . .. . . . .. . . . .. . . . au domains being created. As growth rates inevitably ca slow, the prevalence of distancing mechanisms will become a bigger issue. The use of distancing mechanisms appears most closely tied to the type of de 40000 . . . . .. . . . .. . . . .. . . . .. . . .. . . . .. . . . .. . . . jp institution, rather than to attitudinal changes developed over time. Therefore, the service-level reachability in the Internet may best be analyzed in terms of the relative growth rates of the various types 20000 . . . . .. . . . .. . . . .. . . . .. . . .. . . . .. . . . .. . . . nl,mx,ch of institutions that comprise the Internet. At present, se,it,kr,fi commercial institutions are the most rapidly growing sector, and these institutions tend to make significant dk use of distancing mechanisms. is 0 . . . . .. . . . .. . . . .. . . . .. . . .. . . . .. . . . .. . . . nz,arpa On average, sites tend to acquire Internet connectivity and settle on a comfortable level of distancing Jan ’91 Jan ’92 Jan ’93 Jan ’94 within a year after connecting to the Internet. While Date the probability that sites directly connect to the Internet varies significantly as a function of geography Figure 9: Modeled Overall Growth Rates and type of institution, on average 41% of the time sites acquire direct Internet connectivity. Based on Internet. Therefore, Lottor’s study really indicates this and similar asymptotic computations, we have the spread of IP and the Domain Naming System at constructed regression models of overall Internet sites connected to the Internet. We believe the growth rates, taking into account the rates of creation current study offers a more meaningful measure of of new domains, domains connecting to the Internet, Internet size, because it is through reachable network and domains disconnecting from the Internet. These services that all Internet sites gain the advantages of models can be used to analyze a number of different connectivity. As a point of comparison, we found questions about Internet connectivity. that only about 35% of the domains in Lottor’s Janu-
- 11 -
There are a number of possible areas for future work. It would be interesting to measure the growth rates of client-only sites, i.e., sites that make use of Internet services without exporting any services of their own. While those measurements cannot be determined from the data we collected, there are a variety of other characteristics that could be uncovered from our data. For example, we could analyze trends in the types of mechanisms being used for distancing (e.g., firewall gateways vs. turning off services). We could also analyze Internet reliability and distribution of message transit times, based on logs of our measurement traffic. Finally, we could compare the rates of Internet service reachability changes with network traffic rate changes, to indicate changing uses of the Internet (e.g., to uncover increasing use of bandwidth intensive applications that could cause traffic to increase faster than sites are being connected to the Internet).
Acknowledgements We thank Dave Clark of MIT for mentioning the idea of "The Great Disconnection" at the Fall 1990 Interop conference. We thank Mark Lottor of SRI International for his measurements of Domain Naming System growth. We thank the University of Colorado systems administration staff and the U.S. Computer Emergency Response Team for their helpful support in responding to inquiries raised by our measurement runs. We thank Panagiotis Tsirigotis for correcting a deficiency in the SunOS kernel that affected our measurement software. Schwartz was supported for this work in part by the National Science Foundation under grants DCR8420944 and NCR-9105372, a grant from AT&T Bell Laboratories, and a grant from Sun Microsystems’ Collaborative Research Program. Quarterman’s participation was part of an ongoing private project analyzing the growth and extent of several networks, conducted by Matrix Information and Directory Services, Inc.
9. References [Bowman, Danzig & Schwartz 1993] C. M. Bowman, P. B. Danzig and M. F. Schwartz. Research Problems for Scalable Internet Resource Discovery. To appear, Proc. of INET ’93, San Francisco, CA, Aug. 1993. [Carl-Mitchell & Quarterman 1992] S. Carl-Mitchell and J. S. Quarterman. Internet Firewalls. UNIX/World, 9(2), pp. 93-
102, Tech Valley Publishing, Mountain View, CA, Feb. 1992. [Cerf 1991] V. G. Cerf, editor. Guidelines for Internet Measurement Activities. Req. For Com. 1262, Internet Activities Board, Oct. 1991. [Feinler et al. 1982] E. Feinler, K. Harrenstien, Z. Su and V. White. DoD Internet Host Table Specification. Req. For Com. 810, Network Information Center, SRI Int., Mar. 1982. [Heimlich 1990] S. A. Heimlich. Traffic Characterization of the NSFNET National Backbone. Proc. SIGMETRICS Conf. on Measurement and Modeling of Computer Systems, pp. 257-258, Boulder, CO, May 1990. [Horvath 1990] S. M. Horvath. NSFNET Usage by Service. Message sent to
[email protected] electronic mail distribution list, Aug. 1990. [Lottor 1990] M. Lottor. Personal Communication. Discussion of Internet measurements to count number of domains and machines in the Internet. Apr. 1990. [Lottor 1992a] M. Lottor. Internet Growth (1981-1991). Req. For Com. 1296, Network Information Systems Center, SRI Int., Jan. 1992. [Lottor 1992b] M. Lottor. Internet Domain Survey Results. Network Information Systems Center, SRI Int., 1992. Anonymous FTP from ftp.nisc.sri.com: pub/zone/. [Merit, Inc. 1992] Merit, Inc. NSFNET Statistics. Anonymous FTP from nis.nsf.net:statistics/nsfnet/*, Oct. 1992. [Mockapetris 1987] P. Mockapetris. Domain Names - Concepts and Facilities. Req. For Com. 1034, USC Information Sci. Institute, Nov. 1987. [NSF Network Service Center 1989] NSF Network Service Center. NSF Network News. July 1989. [National Research Council 1991] National Research Council. Computers at Risk: Safe Computing in the Information Age. National Academy Press, Washington, D.C., 1991. [Nowitz & Lesk 1978] D. A. Nowitz and M. E. Lesk. A Dial-Up Network of UNIX Systems. Bell Laboratories, Murray Hill, NJ, Aug. 1978.
- 12 -
[Quarterman 1990] J. Quarterman. The Matrix: Computer Networks and Conferencing Systems Worldwide. Digital Press, 1990. [Quarterman 1992] J. S. Quarterman. Where is the Internet? Matrix News, 2(8), pp. 9-15, Matrix Information and Directory Services, Inc. (MIDS), Austin, Aug. 1992. [Quarterman 1993a] J. S. Quarterman. The Most Networked Countries. Matrix News, 3(3), pp. 4-7, Matrix Information and Directory Services, Inc. (MIDS), Austin, Mar. 1993. [Quarterman 1993b] J. S. Quarterman. Hosts by Wealth. Matrix News, 3(5), Matrix Information and Directory Services, Inc. (MIDS), Austin, 1993. [Romkey l988] J. Romkey. A Nonstandard for Transmission of IP Datagrams Over Serial Lines: SLIP. Req. For Com. 1055, June l988. [Schwartz 1991a] M. F. Schwartz. The Great Disconnection? Tech. Rep. CU-CS-521-91, Dept. Comput. Sci., Univ. Colorado, Boulder, CO, Feb. 1991. [Schwartz 1991b] M. F. Schwartz. A Measurement Study of Changes in Service-Level Reachability in the Global TCP/IP Internet: Goals, Experimental Design, Implementation, and Policy Considerations. Req. For Com. 1273, Nov. 1991. [Schwartz & Wood 1992] M. F. Schwartz and D. C. M. Wood. Discovering Shared Interests Among People Using Graph Analysis of Global Electronic Mail Traffic. Dept. Comput. Sci., Univ. Colorado, Boulder, CO, Revised Oct. 1992. To appear, Commun. ACM. [Schwartz 1993] M. F. Schwartz. Internet Resource Discovery at the University of Colorado. IEEE Computer Magazine, To appear, Sep. 1993. [Spafford 1989] E. H. Spafford. The Internet Worm: Crisis and Aftermath. Commun. ACM, 32(6), pp. 678687, June 1989. [Stoll 1988] C. Stoll. Stalking the Wiley Hacker. Commun. ACM, 31(5), pp. 484-497, May 1988.