sensors Article
A MEMS Resonant Sensor to Measure Fluid Density and Viscosity under Flexural and Torsional Vibrating Modes Libo Zhao *, Yingjie Hu, Tongdong Wang, Jianjun Ding, Xixiang Liu, Yulong Zhao and Zhuangde Jiang State Key Laboratory for Manufacturing Systems Engineering, Collaborative Innovation Center of Suzhou Nano Science and Technology, Xi’an Jiaotong University, Xi’an 710049, Shaanxi, China;
[email protected] (Y.H.);
[email protected] (T.W.);
[email protected] (J.D.);
[email protected] (X.L.);
[email protected] (Y.Z.);
[email protected] (Z.J.) * Correspondence:
[email protected]; Tel.: +86-29-8266-8616 Academic Editor: Stephane Evoy Received: 11 March 2016; Accepted: 2 June 2016; Published: 6 June 2016
Abstract: Methods to calculate fluid density and viscosity using a micro-cantilever and based on the resonance principle were put forward. Their measuring mechanisms were analyzed and the theoretical equations to calculate the density and viscosity were deduced. The fluid-solid coupling simulations were completed for the micro-cantilevers with different shapes. The sensing chips with micro-cantilevers were designed based on the simulation results and fabricated using the micro electromechanical systems (MEMS) technology. Finally, the MEMS resonant sensor was packaged with the sensing chip to measure the densities and viscosities of eight different fluids under the flexural and torsional vibrating modes separately. The relative errors of the measured densities from 600 kg/m3 to 900 kg/m3 and viscosities from 200 µPa¨ s to 1000 µPa¨ s were calculated and analyzed with different microcantilevers under various vibrating modes. The experimental results showed that the effects of the shape and vibrating mode of micro-cantilever on the measurement accuracies of fluid density and viscosity were analyzed in detail. Keywords: MEMS resonant sensor; microcantilever; density and viscosity; measuring accuracy; vibrating mode
1. Introduction The density and viscosity of fluid are the most important parameters in the oil [1,2], chemical [3] and medical [4] industries and so on. The density can be measured based on the resonant frequency shift of resonant devices [5]. Reference [6] showed that a microresonator had different resonant frequencies and quality factors due to different densities and viscosities of the loaded liquids. Generally, the resonant frequency of the microresonator decreased with increasing liquid density, and the full width at half maximum (FWHM) of the microresonator increased with increasing liquid viscosity [7,8]. With the development of micro electromechanical systems (MEMS) technology, the MEMS resonator has higher resonant frequency and quality factor, and presents many advantages to implement online measurements of fluid parameters, such as fast response times [9,10]. On the basis of the above phenomena, many MEMS resonant sensors have been studied for the measurement of fluid density and viscosity. Oden [11], Ahmed [12], and Papi [13] studied the measurement of fluid viscosity using the resonant frequency shift of an Atomic Force Microscope (AFM) microcantilever before and after being submerged in the fluid, but the high cost and special installation requirements of the AFM make this method difficult to use in industry. Goodwin [14,15] developed a rectangular silicon microcantilever with a silicon on insulator (SOI) wafer to measure fluid density Sensors 2016, 16, 830; doi:10.3390/s16060830
www.mdpi.com/journal/sensors
Sensors 2016, 16, 830
2 of 15
and viscosity through a vibrating method, and a large number of experimental data of fluid density and viscosity were given in those papers. The measuring accuracies of this sensor for viscosity and density were 10% and 1%, respectively, when the fluid viscosity was less than 1 mPa¨s. The sensor also had lower measurement sensitivity because the piezoresistors were fabricated using polysilicon with a low piezoresistive coefficient. The quality factor of a rectangular microcantilever was significantly reduced with the increase of fluid viscosity due to the increase of resonator energy dissipation, so this type of sensor could not be used to measure high viscosity fluids. Boudjiet [16] studied the effects of microcantilever shape and geometrical dimensions on the density sensitivity. This study showed that a wide and short cantilever was more sensitive to the density variation, the highest sensitivity was 228 Hz/(kg¨ m´3 ) and the measurement accuracy ranged from 0.4% to 0.6%. To improve the sensitivity of microcantilever sensors, Ansari [17] analyzed and compared the deflections and vibration characteristics of rectangular and trapezoidal profile microcantilevers. The results showed that the trapezoidal microcantilever had better sensitivity. To improve the quality factor of the resonator, Lucklum [18] designed a density and viscosity sensor, where a vibration plate was supported by four elastic beams and driven by Lorentz force undergo a reciprocating in-plane motion. The sensor could measure the square root of the product of density and viscosity with an accuracy of 1% in the range of 1~500 mPa¨s, but the density and viscosity were not measured separately. When the microcantilever was used to detect ultrasensitive mass, an optimized electromagnetic excitation method specifically for the second resonant mode was proposed and developed for further improving the resolution [19]. In conclusion, the resonant sensors reported in the literature above mainly operate under the first order resonant mode, which is also called the flexural resonant mode. Recently, Manzaneque [20] designed a piezoelectric MEMS resonator to measure fluid viscosity and density based on the second order bending mode, the measurement ranges of viscosity and density were 0.4–7.3 mPa¨s and 680–905 kg¨ m´3 , and the measuring accuracies of viscosity and density were 8% and 0.4%, respectively. All this suggests that the performance of resonant sensors under higher resonant modes should be researched further. In this paper, the theories of fluid density and viscosity measurement using the microcantilever resonator were analyzed in detail. Sensing chips with micro-cantilevers in two different shapes were designed via numerical analysis. The MEMS resonant sensor was fabricated with the sensing chips by the packaging process. The first two order resonant modes of micro-cantilevers were both used to measure densities and viscosities of different fluids. The experimental results were analyzed to discuss the effects of the microcantilever structure and the resonant modes on the accuracies of the density and viscosity measurements. Compared with the reference values, the sensor had higher accuracy to measure the fluid viscosity under the higher order resonant mode, but had approximate accuracies to measure the fluid density under the first two resonant modes. 2. Theory and Simulation The schematic diagram of the microcantilever resonant sensor is shown in Figure 1. The micro-cantilever was designed with a length l, width w and thickness d. The metal coil was positioned on the surface of the micro-cantilever. The Wheatstone bridge consisted of four piezoresistors designed to be located at the positions of stress concentration. Welding pads were used to connect with the input and output signals. B denotes the constant magnetic intensity provided by the external magnet. When the metal coil was powered with the alternating current I in a certain frequency, an alternating Lorentz force F was generated to drive the microcantilever to vibrate at the same frequency. Then, the resistance values of four piezoresistors were changed based on the piezoresistive effect because the stress conditions of the four piezoresistors varied. The Wheatstone bridge would output the corresponding signal which was proportional to the magnitude of the microcantilever vibration. Therefore, a dynamic resonant curve was obtained from the output of the Wheatstone bridge. When the frequency of the alternating current through the metal coil was close to the natural frequency of the microcantilever, then the microcantilever would vibrate in resonance. A peak value of
Sensors 2016, 16, 830
3 of 15
the Wheatstone bridge output signal appeared in the resonant curve, then the resonant frequency and Sensors 2016,of 16,the 830 micro-cantilever could be calculated. 3 of 15 quality factor
Figure 1. Schematicdiagram diagramof of the the micro-cantilever resonant sensor. Figure 1. Schematic micro-cantilever resonant sensor.
The fundamental frequencies f1 and f2 of the microcantilever under the first order flexural mode
The frequencies f 1 can andbef 2expressed of the microcantilever therespectively first order[21]. flexural mode and fundamental the first order torsional mode by Equations (1)under and (2), and the first order torsional mode can be expressed by Equations (1) and (2), respectively [21].
f1 f1 “
d 12 d E 4d φl122 3Ec
4π l 2
(1)
(1)
3ρc
1 d G 41l Gξ cJP f2 “ f2
4l
(2)
(2)
ρ c JP
where φ1 is the first order positive root of equation 1 + cosh(φn)cos(φn) = 0, φ1 = 1.8751. ρc and E are wheretheφ1density is the and firstelasticity order positive of equation 1 respectively. + cosh(φn )cos(φ 0, φmodulus, modulusroot of micro-cantilever, G is the shear andρc and E n) = 1 = 1.8751. 3 3 G =density E/(2 + 2ν), where ν is the Poisson ratio. Jp is polar moment of inertia and p =the (wdshear + w d)/12. ξ can and are the and elasticity modulus of micro-cantilever, respectively. G Jis modulus, be expressed as follows where n is the order G = E/(2 + 2ν), where ν is [22], the Poisson ratio. Jp isnumber: polar moment of inertia and Jp = (wd3 + w3 d)/12.
ξ can be expressed as follows [22], where n is the order number:
1 w 192 1 n w d˜4 5 5 tanh 3 d 8 2d ¸ n 1 n 1 4 w 192 ÿ 1 nπw
ξ“
3
d
d
´
2.1. Measurement Theory
π 5 n“1 n5
tanh
(3)
2d
(3)
2.1. Measurement Theory The different measurement equations for the fluid density and viscosity were analyzed under different conditions as follows: some assumptions should be discussed first. In general, the The different measurement equations for the fluid density and viscosity were analyzed under microcantilever was assumed as an isotropic linearly elastic solid. The internal frictional effect was different conditions as follows: some assumptions should be discussed first. In general, the negligible and the vibration amplitude was far smaller than the length scale of the micro-cantilever microcantilever was assumed as an isotropic linearly elastic solid. The internal frictional effect was in geometry. The fluid can be considered to be inviscid in practical application when the Reynolds negligible and the amplitude was far smaller than the length scale of the micro-cantilever number (Re) >>vibration 1 [23]. in geometry. The fluid can be to be inviscid inmicrocantilever practical application when the Reynolds The resonant frequencyconsidered and half peak width of the have close relationships number >>density 1 [23]. and viscosity when the microcantilever vibrates resonantly in the measured with(Re) fluid fluids. The relationship of and the resonant frequency and fluid density can behave described follows The resonant frequency half peak width of the microcantilever closeasrelationships underdensity the flexural vibration [24]. is implemented with good accuracy in the with fluid and viscosity whenThis the approximation microcantilever vibrates resonantly in the measured fluids. derivation of the well-known inviscid result for a rectangular cantilever [23]. The relationship of the resonant frequency and fluid density can be described as follows under the 1/2 good accuracy in the derivation of the flexural vibration [24]. This approximation is implemented with ffluid1 f w (4) well-known inviscid result for a rectangular cantilever 1 [23].
f vac1
4 c d
ˆ ˙ 1{2 πρf w ´ resonant frequencies of the microcantilever in the fluid and (4) where ffluid1 and fvac1 are the flexuralf fluid1 “ 1` f vac1 vacuum, respectively. ρf is the density of the fluid. 4ρc d The relationship between the resonant frequency and fluid density under the torsional
where f fluid1 and f vac1 are the flexural resonant frequencies of the microcantilever in the fluid and vibration can be described as follows [25]: vacuum, respectively. ρf is the density of the fluid. The relationship between the resonant frequency and fluid density under the torsional vibration can be described as follows [25]:
Sensors 2016, 16, 830
4 of 15
f fluid2 “ f vac2
ˆ
˙ 3πρf w ´1{2 1` 32ρc d
(5)
where f fluid2 and f vac2 are the torsional resonant frequencies of micro-cantilever in the fluid and vacuum, respectively. Equation (4) can be expressed in another form: ˜
4ρc d ρf “ πw
2 f vac1 ´1 2 f fluid1
¸ (6)
In addition, Equation (5) can be also expressed as follows: 32ρc d ρf “ 3πw
˜
¸ 2 f vac2 ´1 2 f fluid2
(7)
In Equations (6) and (7), f vac1 , f vac2 , ρc , d and w all need to be determined before the fluid density is measured via f fluid1 and f fluid2 . However, they are all constants for a specific microcantilever. Equations (6) and (7) were deduced for a microcantilever with a length much larger than its width (l/w >> 1). In addition, [14] has discussed the fluid density and viscosity measurement method with a cantilever plate structure (l/w « 1), where the relationship of the resonant frequency and fluid density could be expressed as follows: ρf “
ρc dυn Eυn5 d3 ´ ( 2l 24 1 ´ σ2 l 5 p2π f fluid q2
(8)
where σ is Poisson’s ratio, υn is the eigen value of the fluid velocity potential function. In Equation (8), all variables except ρf and f fluid are constants for a specific micro-cantilever. For Re >> 1, the frequency response of a rectangular cantilever in a viscous fluid is given by [26]: f fluid “ f vac
ˆ ˙´1{2 πρf w Real rΓp f fluid qs 1` 4ρc d
(9)
where Real [Γ(f fluid )] is the real part of the hydrodynamic function evaluated at the frequency in the liquid. However, the dimensions of the resonator in [26] are 2.8 mm ˆ 2.6 mm, indicating that Equation (9) can be rearranged as Equation (10) due to the Real [Γ(f fluid )] approaches 1 at Re >> 1: 4ρc d ρf “ πw
˜
2 f vac ´1 2 f fluid
¸ (10)
Therefore, Equations (6)–(8) and (10) can be all simplified as the following Equation (11) since the parameters of cantilever itself can be all confirmed: ρf “
k1 2 f fluid
` k2
(11)
where k1 and k2 are constants and calculated by experimental calibrations. However, both k1 and k2 are different under flexural and torsional resonant modes. Therefore, this paper used Equation (11) as working equation to measure the fluid density under different conditions such as the flexural and torsional resonant modes. The resonance quality factor Q is an important parameter for fluid viscosity measurement. When a resonator with random shape oscillates in a liquid, the inertial and viscous forces apply to the motion [27], and Q is given by:
Sensors 2016, 16, 830
5 of 15
Sensors 2016, 16, 830
5 of 15 3
Q 2 f fluid f f 2
(12)
where ηf is the viscosity of the liquid. 2 q3 ηthe 9 p2π f fluid of (12) f ρf resonant frequency and fluid viscosity Based on the above viewpoint, the Q relationship can be described as [14]: of the liquid. where η f is the viscosity Based on the above viewpoint, the relationship of the resonant 2 frequency and fluid viscosity can k3 2 gfluid 2 g vac be described as [14]: (13) f ˙ 2 3 ˆ 2gffluid 2g f vac fk3ffluid vac fluid ηf “ ´ (13) 3 f fluid f vac ρf f fluid where k3 is a constant and obtained by the experimental calibration, gfluid and gvac are half peak where kof a constant and obtained the experimental gfluid gvac aremicro-cantilever, half peak widths 3 isthe widths microcantilever in thebyfluid and vacuum,calibration, respectively. Forand a specific of the microcantilever in the fluid and vacuum, respectively. For a specific micro-cantilever, fvac and gvac are also constants and can be determined via calibration, so the ratio of gvac/fvacf vac canand be g are also constants and can be determined via calibration, so the ratio of g /f can be replaced vac vac vac replaced by k4. Then Equation (13) becomes: by k4 . Then Equation (13) becomes: 2
k 2 g fluid f k333 ˆ 2gfluid k4˙2 ηf “ f 3f fluid f fluid ´ k4 ρf f fluid
f fluid
(14) (14)
2.2. Fluid-Structure Fluid-Structure Interaction Interaction Simulation Simulation 2.2. Microcantilevers with andand trapezoidal shapesshapes were proposed. The designThe dimensions Microcantilevers withrectangular rectangular trapezoidal were proposed. design of the two different microcantilevers were a length of 1500 µm, width of 2500 µm, thickness of dimensions of the two different microcantilevers were a length of 1500 μm, width of 2500 μm, 20 µm, and the free end width of the trapezoidal micro-cantilever was 1000 µm. It is proven that thickness of 20 μm, and the free end width of the trapezoidal micro-cantilever was 1000 μm. It is a microcantilever with a larger width help to improve the sensitivity [16] and quality factor [28] proven that a microcantilever with acould larger width could help to improve the sensitivity [16] and of a microcantilever, and in particular it could improve the Re (Re = ρ fw/4η ), where f is the resonant f f the Re (Re = ρffw/4ηf), quality factor [28] of a microcantilever, and in particular it could improve frequency microcantilever) If The Re is much larger than 1, it Re means the viscosity equation where f is of thethe resonant frequency[23]. of the microcantilever) [23]. If The is much larger than 1, it and the density equation could be decoupled when the fluid density and viscosity are measured means the viscosity equation and the density equation could be decoupled when the fluid density simultaneously. this study, the Re of the proposed micro-cantilever wasproposed about 100,micro-cantilever so the resonant and viscosity areInmeasured simultaneously. In this study, the Re of the frequency of microcantilever only affected by the fluidwas density shownby inthe Equation (11), and was about 100, so the resonantwas frequency of microcantilever onlyas affected fluid density as the viscosity was calculated by the measured density, quality factor and resonant frequency of the shown in Equation (11), and the viscosity was calculated by the measured density, quality factor and micro-cantilever in the fluid, as shown in Equation (14).as shown in Equation (14). resonant frequency of the micro-cantilever in the fluid, Fluid-solid coupling coupling simulations simulations were were carried carried out out by by the the finite finite element element method method (FEM) (FEM) as as shown shown Fluid-solid in Figure 2. The silicon microcantilever was modeled using the SOLID45 solid element (the red in Figure 2. The silicon microcantilever was modeled using the SOLID45 solid element (the red part), 3 , and the Poisson’s ratio was 0.064. part), its elastic modulus was 169 GPa, its density was 2330 kg/m its elastic modulus was 169 GPa, its density was 2330 kg/m3, and the Poisson’s ratio was 0.064. The The fluid described by the FLUID30 acoustic fluid element (the green part),and andthe thefluid fluidelements elements fluid was was described by the FLUID30 acoustic fluid element (the green part), were coupled with solid elements. The fluid domain covered the microcantilever except for were coupled with solid elements. The fluid domain covered the microcantilever exceptthe forfixed the end, and of theoffluid domain was was increased by 5000 µm μm overover the dimensions of the fixed end,the anddimension the dimension the fluid domain increased by 5000 the dimensions of microcantilever. The mapping method was used to mesh the structure with the number of solid the microcantilever. The mapping method was used to mesh the structure with the number of solid elements, which andand the number of fluid which was 2000.was The 2000. resonant elements, whichwas was300, 300, the number of elements fluid elements which Thefrequency resonantf was obtained by modal analyses in the fluid-solid coupling simulation. However, the quality factorthe Q frequency f was obtained by modal analyses in the fluid-solid coupling simulation. However, has not been obtained from the current simulation because the peak width at half height cannot be quality factor Q has not been obtained from the current simulation because the peak width at half calculated by the simulationby results. height cannot be calculated the simulation results.
Figure Fluid-solid coupling model. Figure 2. 2. Fluid-solid coupling model.
Sensors 2016, 16, 830
6 of 15
Sensors 2016, 16, 830 Sensors 2016, 16, 830
6 of 15 6 of 15
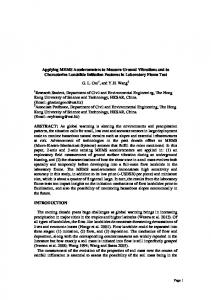
The The resonant resonant modes modes of of different different micro-cantilevers micro-cantilevers were were obtained obtained by by fluid-solid fluid-solid coupling coupling The resonant modes of different micro-cantilevers were obtained by fluid-solid coupling simulation in n-pentane, as shown in Figure 3, the resonant modes in other fluids simulation in n-pentane, as shown in Figure 3, the resonant modes in other fluids were were also also obtained obtained simulation in n-pentane, as shown in Figure 3, the resonant modesflexural in other fluids were also obtained using The first order using the the same same method. method. The first order mode mode was was the the first first order order flexural vibration, vibration, and and the the second second using the same method. The firsttorsional order mode was the first order flexural vibration, andshowed the second order mode was the first order vibration in all different fluids. Figure 3a,b order mode was the first order torsional vibration in all different fluids. Figure 3a,b showed thatthat the order mode was the first order torsional vibration in all different fluids. Figure 3a,b showed the the vibrating shapes of the rectangular micro-cantilever underthe thefirst first andsecond second orderthat modes, vibrating shapes of the rectangular micro-cantilever under and order modes, vibrating shapes of 3c,d the rectangular micro-cantileverofunder the first and second order modes, respectively. Figure respectively. Figure 3c,d reveal reveal the the vibrating vibrating shapes shapes of the the trapezoidal trapezoidal microcantilever microcantilever under under the the respectively. Figure 3c,d reveal the vibratingThus, shapes of thebetrapezoidal microcantilever under the first it could could first and and second second order order modes, modes, respectively. respectively. Thus, it be seen seen that that the the vibrating vibrating shapes shapes of of the the first and second order modes, respectively. Thus,the it fluid couldenvironment, be seen that but the are vibrating shapes of microcantilever mainly related to the the microcantilever obviously obviouslyhas hasnothing nothingtotododowith with the fluid environment, but are mainly related to microcantilever obviously has nothing to do with the fluid environment, but are mainly related to microcantilever structure (the length-width ratio). the microcantilever structure (the length-width ratio). the microcantilever structure (the length-width ratio).
(a) (a)
(b) (b)
(c) (c)
(d) (d)
Figure 3. Vibration shapes ofoftwo micro-cantilevers in deflection under the first two order modes. Figure 3. Vibration Vibrationshapes shapesof twomicro-cantilevers micro-cantilevers deflection under order modes. Figure 3. two in in deflection under thethe firstfirst twotwo order modes. (a) Rec.1st; (b) Rec.2nd; (c) Tra.1st; (d) Tra.2nd. (a) Rec.1st; (b) Rec.2nd; (c) Tra.1st; (d) Tra.2nd. (a) Rec.1st; (b) Rec.2nd; (c) Tra.1st; (d) Tra.2nd.
The rectangular micro-cantilever was taken as an example to analyze the relationship of its The The rectangular rectangular micro-cantilever micro-cantilever was was taken taken as as an an example example to to analyze analyze the the relationship relationship of of its its resonant frequency and the measured density, as shown in Figure 4. The curves were obtained from resonant resonant frequency frequency and and the the measured measured density, density, as shown in Figure 4. The curves were obtained obtained from from the results of coupling simulations and experiments when the microcantilever was vibrating in the results of ofcoupling couplingsimulations simulations and experiments when the microcantilever was vibrating in the results and experiments when the microcantilever was vibrating in fluids fluids with different densities under the first two resonant modes. fluids with different densities the first two resonant with different densities under under the first two resonant modes.modes.
(a) (a)
(b) (b)
Figure 4. The relationship of resonant frequency and density under different order modes. (a) Under Figure 4. The relationship of resonant frequency and density under different order modes. (a) Under Figure The relationship of resonant frequency andorder density under different order modes. (a) Under the first4.order mode (flexure); (b) under the second mode (torsion). the second order order mode mode (torsion). (torsion). the first first order order mode mode (flexure); (flexure); (b) (b) under under the the second
In Figure 4, the resonance frequency was varied linearly with the fluid density, but we know In Figure 4, the resonance frequency was varied linearly with the fluid density, but we know that the fluid density is indeedfrequency inversely proportional to the with square resonant frequency according In Figure 4, the resonance was varied linearly theoffluid density, but we know that that the fluid density is indeed inversely proportional to the square of resonant frequency according to Equation (11). The Taylor expansion at f fluid = a (a > 0) of Equation (11) can be written as: the fluid density is indeed inversely proportional to the square of resonant frequency according to to Equation (11). The Taylor expansion at ffluid = a (a > 0) of Equation (11) can be written as: Equation (11). The Taylor expansion at f fluid = a (a > 0) of Equation (11) can be written as: (n) f ffluid a f ffluid a f ffluid a (n) f ffluid a 2 n (15) ˇ f f ffluid a ˇ f ffluid a ( f a ) ˇ f ffluid a ( f a )2 ... f ffluid ˇ a ( f a )n Rn ( f ) (15) ˇf ˇ pnqn!ˇ 2 ˇ ( f a ) ( f a ) ... ( f a ) R ( f ) 1 0! 1! 2! n ρf ˇ ffluid “a 0! ρf ˇ ffluid “1!a ρf ˇ ffluid ρf n!ˇ ffluid “a 2!“a 2 ρf “ Rn(f) is the high ` p f ´ aq ` of (f − a)pn,f and ´ aqR ` ...approaching ` p f ´thus aqn ` Rn p f q (15) order infinitesimal n (f) zero, Equation (15) where 0! 1! 2! n! where Rn(f) is the high order infinitesimal of (f − a)n, and Rn(f) approaching zero, thus Equation (15) can be simplified as follows: can be simplified follows: where Rn (f ) is theas high order infinitesimal of (f ´ a)n , and Rn (f ) approaching zero, thus Equation (15) k a 2 k ( 2 k a 3 )( f a ) 3 k a 4 ( f a ) 2 ... (16) can be simplified as follows: ff k11a 2 k 22 ( 2 k11a 3 )( f a ) 3 k11a 4 ( f a ) 2 ... (16) ´2sensor in this paper ´3 ´4 The resonant frequency of are much than 4000 Hz, so the quadratic ρf “ k1 aof ` k2 `inp´2k qp f are ´ aqmuch ` 3k1larger alarger pf ´ aq2 4000 ` ... Hz, (16) The resonant frequency sensor this1 apaper than so the quadratic coefficient is very small due to the negative fourth power of a, and the coefficients of higher order coefficient is very small due to the negative fourth power of a, and the coefficients of higher order term are all close to zero. Then, Equation (16) is changed as follows: term are all close to zero. Then, Equation (16) is changed as follows:
Sensors 2016, 16, 830
7 of 15
The resonant frequency of sensor in this paper are much larger than 4000 Hz, so the quadratic coefficient is very small due to the negative fourth power of a, and the coefficients of higher order term are all close to zero. Then, Equation (16) is changed as follows: Sensors 2016, 16, 830 Sensors 2016, 16, 830
ρf “ ´2k1 a´3 f ` 3k1 a´2 ` k2
7 of 15
(17)
7 of 15
2two kinds of results were fairly consistent. Figure 4 showed that the slopes and f linearities 2k1a 3 f of3kthe k2 (17) 1a 3 When the density of the fluid decreased, the resonant frequency f 2k1a f 3k1a 2 k2 increased with a linearity larger (17) than Figure 4 showed that the slopes and linearities of the two kinds of results were fairly consistent. 0.99. Also, the relative deviations of the resonant frequency in the simulation and experiment under Figure 4 showed thatfluid the slopes and linearities of thefrequency two kindsincreased of resultswith wereafairly consistent. When the density of the decreased, the resonant linearity larger the same vibration were smaller than 10%, which validated the correctness of the fluid-solid coupling When0.99. the Also, density the fluid decreased, theresonant resonantfrequency frequencyinincreased with aand linearity larger than theofrelative deviations of the the simulation experiment simulation results. Therefore, the fluid-solidthe coupling simulation was very useful to guide the design than 0.99. relative deviations resonant frequency thecorrectness simulationofand under the Also, same the vibration were smaller of than 10%, which validatedinthe theexperiment fluid-solid of thecoupling microcantilever. under thesimulation same vibration were smaller the thanfluid-solid 10%, which validated the correctness ofuseful the fluid-solid results. Therefore, coupling simulation was very to guide In addition, it’smicrocantilever. shown that the slopes the fitting straight lines under the second coupling results. Therefore, theof fluid-solid coupling simulation was very useful toorder guidemode the designsimulation of the werethe larger than those under the first orderofmode. Thisstraight meanslines the under variation of resonant frequency design of the microcantilever. In addition, it’s shown that the slopes the fitting the second order mode In addition, it’s shown slopes ofmode. the fitting lines under the secondthe order mode under higher order was that larger with the same fluidstraight density fluctuation. sensitivity of were larger thanmode those under thethe first order This means the variation of Thus, resonant frequency were larger than those under firstwith order This means variation of resonant frequency higher order mode was the larger themode. samesecond fluid density fluctuation. the sensitivity fluidunder density measurement was higher under the orderthe mode thanThus, that under the firstoforder under higher order mode was larger with the same fluidmode density fluctuation. Thus, thethe sensitivity oflarger fluid density measurement was higher under theorder second order in mode that under first order mode. The density sensitivity under the second thisthan paper was about 2 times fluid density measurement wasunder higher under the second order mode than that under the first larger order mode. The density sensitivity the second order mode in this paper was about 2 times ´ 3 ´ 1 than that with the value of ´2.6 Hz¨ (kg¨ m ) in [29].
mode. The density sensitivity the −3 second order mode in this paper was about 2 times larger than that with the value of −2.6under Hz·(kg·m )−1 in [29]. −3)−1 in [29]. than that with the value of −2.6 Hz·(kg·m 3. Fabrication and Experiment 3. Fabrication and Experiment 3. Fabrication and Experiment 3.1. Microcantilever Design 3.1. Microcantilever Design 3.1. Design TwoMicrocantilever different micro-cantilever chips with rectangular and trapezoidal structures were designed Two different micro-cantilever chips with rectangular and trapezoidal structures were according to the simulation results as Figures and 6. and Two according different tomicro-cantilever chips in rectangular structures were designed the simulationshown results aswith shown in5Figures 5 andtrapezoidal 6. designed according to the simulation results as shown in Figures 5 and 6.
Figure 5. Two differentmicro-cantilever chips. Figure 5. Two differentmicro-cantilever chips.
Figure 5. Two differentmicro-cantilever chips.
Figure 6. Layout of the rectangular microcantilever chip. Figure Layoutof ofthe the rectangular rectangular microcantilever chip. Figure 6. 6.Layout microcantilever chip.
The sensing chip with the rectangular microcantilever was taken as an example to demonstrate The sensing chip the was as an example toIn demonstrate the layout in Figure 6, with where itsrectangular dimensionsmicrocantilever were the same as in taken the simulation model. the layout, Thelayout sensing chip with the rectangular microcantilever taken as an example to the 6, where its dimensions were the same aswas in the simulation model. thedemonstrate layout, there is ain Figure metal coil, four piezoresistors constituting the Wheatstone bridge,Inthermistor, the layout 6, where its dimensions were theThe same asthe inchip the simulation model. InMEMS the layout, there in is Figure a metal coil, leads four piezoresistors constituting Wheatstone bridge, thermistor, identification tags, inner and welding pads. sensing was fabricated using identification tags, leads and welding pads. The to sensing wasLorentz fabricated using MEMS technology [30]. Theinner microcantilever chip was excited vibratechip by the force which was technology by [30]. microcantilever was excited to vibrate themagnetic Lorentz force generated theThe alternating currentchip through the metal coil inbythe field. which When was the generated by the alternating current through the metal coil in the magnetic field. When the
Sensors 2016, 16, 830
8 of 15
there is a metal coil, four piezoresistors constituting the Wheatstone bridge, thermistor, identification tags, inner leads and welding pads. The sensing chip was fabricated using MEMS technology [30]. The microcantilever chip was excited to vibrate by the Lorentz force which was generated by the alternating current through the metal coil in the magnetic field. When the frequency of the alternating current was equal to the resonant frequency of the microcantilever chip, resonance would happen and Sensors 2016, 16, 830 the vibrating amplitude achieved its peak value. The amplitude data were obtained8 of by15the output of the Wheatstone bridge for the resistance values of piezoresistors were changed correspondingly. frequency of the alternating current was equal to the resonant frequency of the microcantilever chip, Theseresonance data were fitted by the to calculate the achieved resonantits frequency and factor would happen andcurves the vibrating amplitude peak value. Thequality amplitude dataof the microcantilever chip. A thermistor was used to provide a reference temperature. were obtained by the output of the Wheatstone bridge for the resistance values of piezoresistors were changed correspondingly. These data were fitted by the curves to calculate the resonant
3.2. The Experimental Systemfactor of the microcantilever chip. A thermistor was used to provide a frequency and quality
reference temperature. The schematic diagram and object diagram of the experimental system are shown in Figures 7 and 8. The resonant sensor was packaged with the developed sensing chip. The external magnetic 3.2. The Experimental System field was provided by a samarium cobalt permanent magnet with a strength of 0.28T. The magnetic The schematic diagram and object diagram of the experimental chip. systemAare shown in Figures 7 field direction was parallel to length direction of the microcantilever signal generator (33220 A and 8. The resonant sensor was packaged with the developed sensing chip. The external magnetic Agilent, Santa Clara, CA, USA) provided a sinusoidal AC voltage with suitable amplitude and field was provided by a samarium cobalt permanent magnet with a strength of 0.28T. The magnetic frequency to power the metal coil of the sensing chip. At the same time, it also provided a sync field direction was parallel to length direction of the microcantilever chip. A signal generator (33220 A reference voltage theUSA) phase-locked (SR830, Stanford, CA, USA). Agilent, Santasignal Clara, to CA, provided aamplifier sinusoidal AC voltage with Sunnyvale, suitable amplitude and The first and second order modes were both realized by increasing the frequency of exciting signal frequency to power the metal coil of the sensing chip. At the same time, it also provided a sync (AC voltage through the coil) toto bethe thephase-locked first and second order resonant frequencies of the reference voltage signal amplifier (SR830, Stanford, Sunnyvale, CA,micro-cantilever. USA). The first and second order modes were by both realized by increasing thewith frequency of of exciting (AC The Wheatstone bridge was powered a constant current source a value 2 mA,signal and its output voltage through the be the first and second order resonant frequencies of the The micro-cantilever. signal was detected bycoil) thetoStanford SR830 to determine the vibration mode. coupling of the The Wheatstone bridge was powered by a constant with a because value of the 2 mA, and its were AC voltage to the resistors of the Wheatstone bridgecurrent couldsource be ignored resistors output signal was detected by the Stanford SR830 to determine the vibration mode. The coupling located near the fixed end of the micro-cantilever and their displacements were very small. Theofsignal the AC voltage to the resistors of the Wheatstone bridge could be ignored because the resistors generator and phase-locked amplifier were both controlled by a computer through the general purpose were located near the fixed end of the micro-cantilever and their displacements were very small. interface bus (GPIB) lines. The environment temperature was kept with different constant values by The signal generator and phase-locked amplifier were both controlled by a computer through the a thermostatic (7008,interface Fluke, Everett, WA,lines. USA). general purpose bus (GPIB) The environment temperature was kept with different The resonant and half peak width should obtained to calculate the fluid density constant valuesfrequency by a thermostatic (7008, Fluke, Everett, WA,be USA). and viscosity using Equations (11) half andpeak (14).width The Stanford detected the output signals The resonant frequency and should be S830 obtained to calculate the fluid densityof the and viscosity using Equations (11) and (14). The Stanford S830the detected signals of the Wheatstone bridge when the sinusoidal AC voltage excited metal the coiloutput from low frequency to Wheatstone bridge when the sinusoidal AC voltage excited the metal coil from low frequency to high frequency. The signal amplitude of the Wheatstone bridge could be intensified when the input high frequency. The signal amplitude ofresonant the Wheatstone bridge be intensified when theininput frequency of AC voltage was close to the frequency ofcould the micro-cantilever chip the fluid. frequency of AC voltage was close to the resonant frequency of the micro-cantilever chip in the fluid. The obtained data of the amplitude versus the sweeping frequency are shown in Figure 9. The data in The obtained data of the amplitude versus the sweeping frequency are shown in Figure 9. The data in blue * were the in-phase component of voltage amplitude, and the data in blue # were the quadrature blue * were the in-phase component of voltage amplitude, and the data in blue ○ were the component of voltage amplitude. All data were fitted by the MATLAB software to obtain the fitting quadrature component of voltage amplitude. All data were fitted by the MATLAB software to equation. the resonant frequency, and half peak width and of the resonant sensor obtainThen the fitting equation. Then theamplitude resonant frequency, amplitude half peak width of could the be calculated based on this equation. resonant sensor could be calculated based on this equation.
Figure 7. Block diagram of experimental system. Figure 7. Block diagram of experimental system.
Sensors 2016, 16, 830
9 of 15
Sensors 2016, 16, 830
9 of 15
Sensors 2016, 16, 830
9 of 15
Figure 8. Experimental system. Figure 8. Experimental system. Figure 8. Experimental system.
Figure 9. The resonant fitted curves.
4. Results and Discussion
Figure 9. The resonant fitted curves. Figure 9. The resonant fitted curves.
In order test the sensor’s performance, different fluids with various densities and viscosities 4. Results andtoDiscussion 4. Results and Discussion should be measured by the proposed sensor. The measured fluids included n-pentane, n-hexane, In order to test the sensor’s performance, different fluids with various densities and viscosities n-heptane, isooctane, n-octane, cs silicone oil, cyclohexane and methylbenzene. specific fluids In order to test the sensor’s0.65 performance, different fluids with various densitiesAand viscosities should be measured by the proposed sensor. The measured fluids included n-pentane, n-hexane, has different densities and viscosities under different temperatures. For the alkane fluids, their should be measured by the proposed sensor. The measured fluids included n-pentane, n-hexane, n-heptane, isooctane, n-octane, 0.65 cs silicone oil, cyclohexane and methylbenzene. A specific fluids physical properties the most fromoil, 20 cyclohexane °C to 25 °C.and Their reference values of density, n-heptane, isooctane,are n-octane, 0.65stable cs silicone methylbenzene. A specific fluids has different densities and viscosities under differentpressure temperatures. For the alkane fluids, their viscosity and sonic speed under standard atmospheric and different temperature K has different densities and viscosities under different temperatures. For the alkane fluids, their(293.15 physical physical properties are the most stable from 20 °C to 25 °C. Their reference values of density, and 298.15 K) were calculated using the Reference Fluid Properties (REFPROP) software. In the field properties are the most stable from 20 ˝ C to 25 ˝ C. Their reference values of density, viscosity and sonic viscosity and sonic properties, speed under atmospheric pressure K of thermophysical thestandard REFPROP software [31,32] is and oftendifferent used to temperature provide the (293.15 reference speed under standard atmospheric pressure and different temperature (293.15 K and 298.15 K) were and 298.15 K) were calculated using the Reference Fluid Properties (REFPROP) software. In the field values of fluid viscosity, conductivity, and so on. Therefore, wethe used the values calculated usingdensity, the Reference Fluid Properties (REFPROP) software. In field ofreference thermophysical of thermophysical properties, the REFPROP software [31,32] is often used to provide the reference from the software to estimate the accuracy eachused measurement. properties, the REFPROP software [31,32] isof often to provide the reference values of fluid density, values ofthe fluid density, viscosity, conductivity, and so on. Therefore, we used the reference values For rectangular microcantilever chip, a frequency swept curve was inestimate 0.65 cs viscosity, conductivity, and so on. Therefore, we used the reference values from the obtained software to from the software to estimate the accuracy of each measurement. silicone oil under different resonant modes, as shown in Figure 10. There were many irregular peaks the accuracy of each measurement. For the rectangular microcantilever chip, a10Ba frequency sweptmicrocantilever curve was obtained in 0.65 cs in the curve below 2 kHz as shown inchip, Figure because chip easily For the rectangular microcantilever a frequency swept the curve was obtained in 0.65was cs silicone silicone oil under different resonant modes, as shown in Figure 10. There were many irregular peaks disturbed by external vibration and noise. oil under different resonant modes, as shown in Figure 10. There were many irregular peaks in the in the curveeasy below 2 kHz as that shown Figure because the microcantilever chip wasfrom easily It was to make sure this in curve had10Ba two peaks inchip the frequency 1 curve below 2 kHz as shown in Figure 10Ba because theresonant microcantilever was easily range disturbed by disturbed by external vibration and noise. to 100 kHz. In theory, another resonant peaks should also appear in the frequency range from 1 to external vibration and noise. It was easy makeofsure this curve in had resonant peaks in were the frequency range from 100 kHz, but theto strains the that piezoresistors thetwo microcantilever chip so small under higher1 to 100 resonant kHz. In theory, resonant peaks should also appear in the frequency range to from 1 to order modes,another so the Wheatstone bridge’s outputs were also small and difficult detect. 100 kHz, but the strains of the piezoresistors in the microcantilever chip were so small under higher The vibration modes could be estimated by the coupled fluid-solid simulation results. For example, order resonant modes, so the Wheatstone bridge’s outputs were also small and difficult to detect. The vibration modes could be estimated by the coupled fluid-solid simulation results. For example,
vibration, respectively. Therefore, the fluid viscosity and density could be measured under the first two order modes, and the experimental results were discussed as follows: the measurement data of the rectangular microcantilever chip under flexural resonant mode and torsional resonant mode are shown in Tables 1 and 2, respectively. The values of Q were calculated by Q = ffluid/2gfluid using the MATLAB method. The reference values of ρref and ηref for the fluid density and viscosity Sensors 2016, 16,fitting 830 10 of 15 were obtained from the REFPROP software.
(A)
(B)
Figure 10.10. Sweep frequency results of rectangular micro-cantilever in 0.65 cs silicone oil. oil. (A) (A) TheThe curve Figure Sweep frequency results of rectangular micro-cantilever in 0.65 cs silicone of curve sweepoffrequency; (B) The (B) detail red box in box picture (A): The box is (a) theisnoise below 2 kHz; sweep frequency; Theof detail of red in picture (A):red The red(a) box the noise below (b) isorder the first order resonance (fFlexure); is the second order resonance (tTorsion). (b)2iskHz; the first resonance (fFlexure); (c) is the(c)second order resonance (tTorsion). Table 1. Experimental results of rectangular micro-cantilever chip under flexural resonant mode.
It was easy to make sure that this curve had two resonant peaks in the frequency range from 1 −3) −3) ρref also (kg·mappear ρf (kg·m ηref (μPa·s)range ηf (μPa·s) T (K) resonant ffluid (Hz) to 100 kHz.Fluid In theory, another peaks Q should in the frequency from 1 to 293.15 5737.16 38.18 625.75 621.32 227.5 175.7higher 100 kHz,n-pentane but the strains of the piezoresistors in the microcantilever chip were so small under a 5738.98 34.75 620.83 217.9 217.9 order resonant modes, so298.15 the Wheatstone bridge’s outputs were 620.83 also small and difficult to detect. 293.15 5615.55 32.68 659.36 655.55 312.3 253 n-hexane The vibration modes could be estimated by the coupled fluid-solid simulation results. For example, 298.15 5632.09 30.95 654.78 650.76 296.3 285.4 Figure 10Bb,c show the resonant under first order flexural vibration and first order torsional 293.15 curves 5527.5 29.01 683.82 681.75 411.4 333.1 n-heptane vibration, respectively. Therefore, the fluid viscosity and density could be measured under the first 298.15 5541.15 29.17 679.6 677.6 388.5 328.5 two order modes, and the293.15 experimental results were discussed as 690.18 follows: the506.1 measurement 5500.02 25.63 690.6 438.6data of isooctane 298.15 chip5512.56 25.25 resonant 686.3 mode686.32 478.6 the rectangular microcantilever under flexural and torsional resonant452.8 mode are 293.15 5466.83 24.53 702.29 700.54 542 484.6 shown inn-octane Tables 1 and 2, respectively. The values of Q were calculated by Q = f fluid /2gfluid using the 5476.98 698.27 697.35 509.7 435.7 MATLAB fitting method. 298.15 The reference values25.74 of ρref and η ref for the fluid density and viscosity were 293.15 5283.39 27.41 763.61 761.36 672.3 387.1 silicone oil (0.65 cs) obtained from the REFPROP software. 298.15 5299.43 28.39 758.87 755.79 650 357.5 293.15 5220.12 24.24 778.63 783.84 961.8 510.5 Table 1. Experimental results of rectangular micro-cantilever chip under flexural resonant mode. cyclohexane 298.15 5240.91 25.99 773.89 776.36 884.7 437.3 293.15 5004.75 30.48 866.87 866.85 588 316 ´3 ´3 methylbenzeneT (K) Fluid f fluid (Hz) Q η ref (µPa¨ s) η f (µPa¨ s) ρref (kg¨ m ) ρf (kg¨ m ) b 298.15 5016.13 32.48 862.2 862.2 556 273.6 293.15of data5737.16 621.32to calibrate227.5 175.7 Note: The groups which have38.18 superscripts625.75 of a and b are used the constants in n-pentane 298.15 a 5738.98 34.75 620.83 620.83 217.9 217.9 10 13 the Equations (11) and (14). k1, k2, k3 and k4 were 2.5729154926 × 10 , −160.36, 3.9768556044 × 10 and −3 293.15 5615.55 32.68 659.36 655.55 312.3 253 3.777 × 10 , respectively. n-hexane 298.15 5632.09 30.95 654.78 650.76 296.3 285.4
n-heptane
293.15 298.15
5527.5 5541.15
29.01 29.17
683.82 679.6
681.75 677.6
411.4 388.5
333.1 328.5
isooctane
293.15 298.15
5500.02 5512.56
25.63 25.25
690.6 686.3
690.18 686.32
506.1 478.6
438.6 452.8
n-octane
293.15 298.15
5466.83 5476.98
24.53 25.74
702.29 698.27
700.54 697.35
542 509.7
484.6 435.7
silicone oil (0.65 cs)
293.15 298.15
5283.39 5299.43
27.41 28.39
763.61 758.87
761.36 755.79
672.3 650
387.1 357.5
cyclohexane
293.15 298.15
5220.12 5240.91
24.24 25.99
778.63 773.89
783.84 776.36
961.8 884.7
510.5 437.3
methylbenzene
293.15 298.15 b
5004.75 5016.13
30.48 32.48
866.87 862.2
866.85 862.2
588 556
316 273.6
Note: The groups of data which have superscripts of a and b are used to calibrate the constants in the Equations (11) and (14). k1 , k2 , k3 and k4 were 2.5729154926 ˆ 1010 , ´160.36, 3.9768556044 ˆ 1013 and 3.777 ˆ 10´3 , respectively.
Sensors 2016, 16, 830
11 of 15
Sensors 2016, 16, 830
11 of 15
Table 2. Experimental results of rectangular micro-cantilever chip under torsional resonant mode.
Table 2. Experimental results of rectangular micro-cantilever chip under torsional resonant mode. Fluid T (K) f fluid (Hz) Q η ref (µPa¨ s) η f (µPa¨ s) ρref (kg¨ m´3 ) ρf (kg¨ m´3 ) fluid (Hz) ρ ref (kg·m−3) ρ f (kg·m−3) η ref (μPa·s) η f (μPa·s) Fluid T (K) f Q 293.15 12,210.45 75.63 625.75 620.32 227.5 218.9 n-pentane 12,210.45 625.75 620.32 227.5 218.9 298.15 a 293.15 12,206.51 75.79 75.63 620.83 620.83 217.9 217.9 n-pentane a 298.15 12,206.51 75.79 620.83 620.83 217.9 217.9 293.15 11,951.80 66.11 659.36 655.08 312.3 293.1 n-hexane 11,951.80 659.36 655.08 312.3 293.1 298.15 293.15 11,964.81 67.54 66.11 654.78 653.28 296.3 280.1 n-hexane 298.15 11,964.81 67.54 654.78 653.28 296.3 280.1 293.15 11,777.05 57.71 683.82 679.87 411.4 391.9 n-heptane 293.15 11,777.05 679.87 411.4 391.9 11,790.67 59.15 57.71 679.6683.82 677.89 388.5 372.0 n-heptane 298.15 298.15 11,790.67 59.15 679.6 677.89 388.5 372.0 293.15 11,706.48 52.73 690.6 690.19 506.1 473.9 isooctane 293.15 11,706.48 690.19 506.1 473.9 11,717.74 54.24 52.73 686.3690.6 688.53 478.6 446.8 isooctane 298.15 298.15 11,717.74 54.24 686.3 688.53 478.6 446.8 293.15 11,633.45 51.28 702.29 701.08 542 503.7 n-octane 293.15 11,633.45 51.28 702.29 701.08 542 503.7 11,643.80 51.99 698.27 699.52 509.7 489.4 n-octane 298.15 298.15 11,643.80 51.99 698.27 699.52 509.7 489.4 293.15 11,264.99 54.17 763.61 759.26 672.3 609.2 silicone oil 293.15 11,264.99 54.17 763.61 759.26 672.3 609.2 298.15 11,282.02 54.63 758.87 756.45 650 587.6 (0.65 cs) silicone oil (0.65 cs) 298.15 11,282.02 54.63 758.87 756.45 650 587.6 293.15 293.15 11,141.85 39.38 39.38 778.63 780.01 961.8 888.3 11,141.85 778.63 780.01 961.8 888.3 cyclohexane cyclohexane 298.15 11,178.47 41.91 773.89 773.77 884.7 779.9 298.15 11,178.47 41.91 773.89 773.77 884.7 779.9 293.15 293.15 10,675.39 50.59 50.59 866.87 865.21 588 543.2 10,675.39 866.87 865.21 588 543.2 methylbenzene methylbenzene298.15 b 10,690.88 51.33 862.2 862.20 556 526.5 b 298.15 10,690.88 51.33 862.2 862.20 556 526.5 Note:The Thegroups groupsof of data data which which have a and b are used to calibrate the constants in thein Note: have superscripts superscriptsofof a and b are used to calibrate the constants Equations (11) and (14). k1 , k2 , k3 and k4 were 1.1844404355 ˆ 1011 , ´174.10, 1.567181537564 ˆ 1015 and the Equations (11) and (14). k1, k2, k3 and k4 were 1.1844404355 × 10¹¹, −174.10, 1.567181537564 × 10¹⁵ 6.649 ˆ 10´4 , respectively. −4 and 6.649 × 10 , respectively.
Here only experimental results and data acquisition method of the rectangular microcantilever Here only experimental results and data acquisition method of the rectangular microcantilever chip were discussed. The deviations between the experimental values and reference values of the chip were discussed. The deviations between the experimental values and reference values of the measured densities and viscosities under different resonant modes are shown in Figures 11 and 12. measured densities and viscosities under different resonant modes are shown in Figures 11 and 12. In addition, the measurement results of the trapezoidal micro-cantilever chip were obtained similarly, In addition, the measurement results of the trapezoidal micro-cantilever chip were obtained and for brevity are not repeated in this paper. similarly, and for brevity are not repeated in this paper.
(a)
(b)
Figure 11. Relative Relativeerrors errors density under different modes. (a) Under first order mode Figure 11. of of density under different orderorder modes. (a) Under first order mode (flexure); (flexure); under second order mode (torsion). (b) under (b) second order mode (torsion).
In order to describe and evaluate the measurement results of fluid density and viscosity, the In order to describe and evaluate the measurement results of fluid density and viscosity, the average relative deviation (ARD) and maximum relative deviation (MRD) were introduced to average relative deviation (ARD) and maximum relative deviation (MRD) were introduced to analyze analyze the measurement accuracy. The ARD is the average relative errors of all corresponding the measurement accuracy. The ARD is the average relative errors of all corresponding measurement measurement results of the eight fluids at two temperature points. The MRD is the maximum results of the eight fluids at two temperature points. The MRD is the maximum relative deviation of relative deviation of all corresponding measurement results of eight fluids as well. Figures 13 and 14 all corresponding measurement results of eight fluids as well. Figures 13 and 14 showed measurement showed measurement accuracies of density and viscosity in ARD and MRD under different resonant accuracies of density and viscosity in ARD and MRD under different resonant modes. modes. As shown in Figures 11 and 13, the fluid density range was from 620.83 kg/m3 to 866.87 kg/m3. In Figure 13, all ARDs in the density were approximate and all less than 0.3%, even under different resonant modes. In addition, the MRDs in the density were all less than 1% and also did not changed
Sensors 2016, 16, 830
12 of 15
As shown in Figures 11 and 13, the fluid density range was from 620.83 kg/m3 to 866.87 kg/m3 . In Figure 13, all ARDs in the density were approximate and all less than 0.3%, even under different Sensors 2016, 16, 830 12 of 15 Sensors 2016, 16, 830 12 of 15 resonant modes. In addition, the MRDs in the density were all less than 1% and also did not changed Sensors 2016, 16, 830 12 of 15 too much much under thethe chip shape andand the the resonant modes had only too under different differentresonant resonantmodes. modes.Therefore, Therefore, chip shape resonant modes had too much under on different resonant modes. Therefore, the chip shape and the resonant modes had slight influences the fluid density measurement accuracy. too much different modes. Therefore, the chip shape and the resonant modes had only slight under influences on theresonant fluid density measurement accuracy. only slight influences on the fluid density measurement accuracy. only slight influences on the fluid density measurement accuracy.
(a) (a) (a)
(b) (b) (b)
Figure 12. Relative Relative errorsofof viscosity under different modes. (a) Under firstmode order mode Figure 12. viscosity under different orderorder modes. (a) Under first order (flexure); Figure 12. Relativeerrors errors of viscosity under different order modes. (a) Under first order mode (flexure); (b) under second order mode (torsion). Figure 12. Relative errors of viscosity under different order modes. (a) Under first order mode (b) under second order mode (torsion). (flexure); (b) under second order mode (torsion). (flexure); (b) under second order mode (torsion).
Figure 13. Deviations of density values. Figure Deviations Figure 13. 13. Deviations of of density density values. values. Figure 13. Deviations of density values.
Figure 14. Deviations of viscosity values. Figure 14. Deviations of viscosity values. Figure 14. 14. Deviations values. Figure Deviations of of viscosity viscosity values.
In Figures 12 and 14, the fluid viscosity range was from 217.9 μPa·s to 961.8 μPa·s. The ARDs In Figures 12 and 14, the fluid viscosity range was from 217.9 μPa·s to 961.8 μPa·s. The ARDs Figures between 12 and 14, the fluid viscosity was fromvalues 217.9 were μPa·s22.74% to 961.8and μPa·s. The under ARDs in theInviscosity experimental values range and reference 41.29% in the viscosity between experimental values and reference values were 22.74% and 41.29% under in theorder viscosity between experimental values andand reference values micro-cantilevers, were 22.74% and 41.29% under first resonant mode for the rectangular trapezoidal respectively. first order resonant mode for the rectangular and trapezoidal micro-cantilevers, respectively. first orderthe resonant mode for the rectangular and trapezoidal micro-cantilevers, However, ARDs in the viscosity between experiment values and reference valuesrespectively. under the However, the ARDs in the viscosity between experiment values and reference values under the However, theresonant ARDs inmode the viscosity between experiment values and reference valuesofunder the second order were 5.78% and 6.92% for them, respectively. The ARDs the fluid second order resonant mode were 5.78% and 6.92% for them, respectively. The ARDs of the fluid second order resonant mode for them, ARDs of theoffluid viscosity measurement were were larger5.78% underand the6.92% flexural mode respectively. because the The quality factors the viscosity measurement were larger under the flexural mode because the quality factors of the viscosity measurement were larger under the the flexural because quality of the microcantilever chip were fairly small under first mode resonant mode.the The ARDsfactors of viscosity microcantilever chip were fairly small under the first resonant mode. The ARDs of viscosity microcantilever chip were fairly small under the first resonant mode. The ARDs of viscosity
Sensors 2016, 16, 830
13 of 15
In Figures 12 and 14, the fluid viscosity range was from 217.9 µPa¨ s to 961.8 µPa¨ s. The ARDs in the viscosity between experimental values and reference values were 22.74% and 41.29% under first order resonant mode for the rectangular and trapezoidal micro-cantilevers, respectively. However, the ARDs in the viscosity between experiment values and reference values under the second order resonant mode were 5.78% and 6.92% for them, respectively. The ARDs of the fluid viscosity measurement were larger under the flexural mode because the quality factors of the microcantilever chip were fairly small under the first resonant mode. The ARDs of viscosity measurement under the torsional mode were about 10% and could be accepted in comparison with other viscosity measuring methods [14,15,33,34]. It meant that the accuracy of fluid viscosity could be enhanced using the torsional resonant mode due to the higher quality factors as shown in Tables 1 and 2. 5. Conclusions In fluid parameter measurement, the main factor affecting the resonance frequency of a resonant sensor was the fluid density, and the main factor affecting the resonance amplitude was the fluid viscosity. In this paper, a fluid density measuring equation had been deduced from the resonant frequency of a microcantilever, and the fluid viscosity measuring equation had been deduced from the quality factor. In this research a simulation method was built to guide the design of a microcantilever resonant chip. An experimental system had been set up for the fabricated MEMS resonant sensor to measure the densities and viscosities of different fluids. The experimental results showed that the fluid density measurement accuracy could not be improved by using microcantilever chips of different shapes or high order resonant mode, but the fluid viscosity measurement accuracy under the torsional vibration mode was obviously better than that under the flexural vibration mode due to the higher quality factors under the former mode. Therefore, it’s necessary to investigate methods to improve the quality factor such as optimizing coil pattern and piezoresistors location or selecting a high order resonant mode. Acknowledgments: This work was supported in part by the National Natural Science Foundation of China (51375378, 51205306, 91323303, 51421004), National Key Scientific Instrument and Equipment Development Projects of China (2012YQ03026101), the Fundamental Research Funds for the Central Universities (2012jdgz08) and the 111 Program (B12016). Author Contributions: Libo Zhao and Zhuangde Jiang conceived and designed the experiments; Yingjie Hu and Tongdong Wang performed the experiments; Jianjun Ding and Xixiang Liu. analyzed the data; Yulong Zhao contributed reagents/materials/analysis tools; Yingjie Hu wrote the paper. Conflicts of Interest: The authors declare no conflict of interest.
References 1.
2. 3. 4. 5. 6.
7.
Harrison, C.; Ryu, S.; Goodwin, A.; Hsu, K.; Donzier, E.; Marty, F.; Mercier, B. A MEMS sensor for the measurement of density-viscosity for oilfield applications. In Proceedings of the Reliability, Packaging, Testing, and Characterization of MEMS/MOEMS V, San Jose, CA, USA, 25–26 January 2006. Markova, L.V.; Makarenko, V.M.; Semenyuk, M.S.; Zozulya, A.P.; Kong, H.; Han, H.-G. A magnetoelastic viscometer for on-line monitoring of viscosity of lubricating oils. J. Frict. Wear 2011, 32, 41–48. [CrossRef] Jakoby, B.; Vellekoop, M.J. Physical sensors for liquid properties. IEEE Sens. J. 2011, 11, 3076–3085. [CrossRef] Smith, P.D.; Young, R.C.D.; Chatwin, C.R. A MEMS viscometer for unadulterated human blood. Measurement 2010, 43, 144–151. [CrossRef] Sparks, D.; Smith, R.; Straayer, M.; Cripe, J.; Schneider, R.; Chimbayo, A.; Anasari, S.; Najafi, N. Measurement of density and chemical concentration using a microfluidic chip. Lab Chip 2003, 3, 19–21. [PubMed] Kim, H.J.; Kim, J.; Zandieh, O.; Chae1, M.-S.; Kim, T.S.; Lee, J.H.; Park, J.H.; Kim, S.; Hwang, K.S. Piezoelectric layer embedded-microdiaphragm sensors for the determination of blood viscosity and density. Appl. Phys. Lett. 2014, 105. [CrossRef] Fedorchenko, A.I.; Stachiv, I.; Wang, W.C. Method of the viscosity measurement by means of the vibrating micro-/nano-mechanical resonators. Flow Meas. Instrum. 2013, 32, 84–89. [CrossRef]
Sensors 2016, 16, 830
8. 9.
10.
11. 12. 13. 14.
15.
16.
17. 18. 19. 20.
21. 22. 23. 24. 25. 26. 27. 28.
14 of 15
Hur, D.; Lee, J.H. Determination of Liquid Density and Viscosity Using a Self-Actuating Microcantilever. Jpn. J. Appl. Phys. 2013, 52. [CrossRef] Etchart, I.; Chen, H.; Dryden, P.; Jundt, J.; Harrison, C.; Hsu, K.; Marty, F.; Mercier, B. MEMS sensors for density-viscosity sensing in a low-flow microfluidic environment. Sens. Actuators A Phys. 2008, 141, 266–275. [CrossRef] Toledo, J.; Manzaneque, T.; Ruiz-Diez, V.; Pfusterschmied, G.; Wistrela, E.; Steindl, W.; Schmid, U.; Sánchez-Rojas, J.L. Piezoelectric MEMS resonators for density and viscosity sensing in engine oil with diesel fuel. In Proceedings of the Transducers—18th International Conference on Solid-State Sensors, Actuators and Microsystems, Anchorage, AK, USA, 21–25 June 2015; pp. 436–439. Oden, P.I.; Chen, G.Y.; Steele, R.A.; Warmack, R.J.; Thundat, T. Viscous drag measurements utilizing microfabricated cantilevers. Appl. Phys. Lett. 1996, 68. [CrossRef] Ahmed, N.; Nino, D.F.; Moy, V.T. Measurement of solution viscosity by atomic force microscopy. Rev. Sci. Instrum. 2001, 72. [CrossRef] Papi, M.; Arcovito, G.; De Spirito, M.; Vassalli, M.; Tiribilli, B. Fluid viscosity determination by means of uncalibrated atomic force microscopy cantilevers. Appl. Phys. Lett. 2006, 88. [CrossRef] Goodwin, A.R.H.; Donzier, E.P.; Vancauwenberghe, O.; Fitt, A.D.; Ronaldson, K.A.; Wakeham, W.A.; de Lara, M.M.; Marty, F.; Mercier, B. A Vibrating Edge Supported Plate, Fabricated by the Methods of Micro Electro Mechanical System for the Simultaneous Measurement of Density and Viscosity: Results for Methylbenzene and Octane at Temperatures between (323 and 423) K and Pressures in the range (0.1–68) MPa. J. Chem. Eng. Data 2006, 51, 190–208. Goodwin, A.R.H.; Jakeways, C.V.; De Lara, M.M. A MEMS Vibrating Edge Supported Plate for the Simultaneous Measurement of Density and Viscosity: Results for Nitrogen, Methylbenzene, Water, 1-Propene, 1,1,2,3,3,3-hexafluoro-oxidized-polymd, and Polydimethylsiloxane and Four Certified Reference Materials with Viscosities in the Range (0.038 to 275) mPa¨ s and Densities between (408 to 1834) kg¨ m´3 at Temperatures from (313 to 373) K and Pressures up to 60 MPa. J. Chem. Eng. Data 2008, 53, 1436–1443. Boudjiet, M.T.; Bertrand, J.; Mathieu, F.; Nicu, L.; Mazenq, L.; Leïchlé, T.; Heinrich, S.M.; Pellet, C.; Dufour, I. Geometry optimization of uncoated silicon microcantilever-based gas density sensors. Sens. Actuators B Chem. 2015, 208, 600–607. [CrossRef] Ansari, M.Z.; Cho, C.; Kim, J.; Bang, B. Comparison between deflection and vibration characteristics of rectangular and trapezoidal profile microcantilevers. Sensors 2009, 9, 2706–2718. [CrossRef] [PubMed] Luckluma, F.; Reichel, E.K.; Jakoby, B. Miniature density-viscosity measurement cell utilizing electrodynamic-acoustic resonator sensors. Sens. Actuators A Phys. 2011, 172, 75–81. [CrossRef] Jin, D.; Li, X.; Liu, J.; Zuo, G.; Wang, Y.; Liu, M.; Yu, H. High-mode resonant piezoresistive cantilever sensors for tens-femtogram resoluble mass sensing in air. J. Micromech. Microeng. 2006, 16, 1017–1023. [CrossRef] Manzaneque, T.; Ruiz-Díez, V.; Hernando-García, J.; Wistrela, E.; Kucera, M.; Schmid, U.; Sánchez-Rojas, J.L. Piezoelectric MEMS resonator-based oscillator for density and viscosity sensing. Sens. Actuators A Phys. 2014, 220, 305–315. [CrossRef] McFarland, A.W.; Poggi, M.A.; Bottomley, L.A.; Colton, J.S. Characterization of microcantilevers solely by frequency response acquisition. J. Micromech. Microeng. 2005, 15, 785–791. [CrossRef] Timoshenko, S.P.; Goodier, J.N.; Abramson, H.N. Theory of Elasticity; McGraw-Hill: New York, NY, USA, 1970. Sader, J.E. Frequency response of cantilever beams immersed in viscous fluids with applications to the atomic force microscope. J. Appl. Phys. 1998, 84, 64–76. [CrossRef] Chu, W.H. Tech Rep No. 2, DTMB, Contract NObs-86396 (X); Southwest Research Institute: San Antonio, TX, USA, 1963. Green, C.P.; Sader, J.E. Torsional frequency response of cantilever beams immersed in viscous fluids with applications to the atomic force microscope. J. Appl. Phys. 2002, 92, 6262–6274. [CrossRef] Wilson, T.L.; Campbell, G.A.; Mutharasan, R. Viscosity and density values from excitation level response of piezoelectric-excited cantilever sensors. Sens. Actuators A Phys. 2007, 138, 44–51. [CrossRef] Ikehara, T.; Lu, J.; Konno, M.; Maeda, R.; Mihara, T. A high quality-factor silicon cantilever for a low detection-limit resonant mass sensor operated in air. J. Micromech. Microeng. 2007, 17. [CrossRef] Zhang, G.; Zhao, L.; Jiang, Z.; Yang, S.; Zhao, Y.; Huang, E.; Hebibul, R.; Liu, Z. Surface stress-induced deflection of a microcantilever with various widths and overall microcantilever sensitivity enhancement via geometry modification. J. Phys. D Appl. Phys. 2011, 44. [CrossRef]
Sensors 2016, 16, 830
29. 30.
31.
32.
33. 34.
15 of 15
Corman, T.; Enoksson, P. A low-pressure encapsulated resonant fluid density sensor with feedback control electronics. Meas. Sci. Technol. 2000, 11. [CrossRef] Xu, L.; Zhang, G.; Zhao, L.; Jiang, Z.; Wang, H.; Liu, Z. A fluid viscosity sensor with resonant trapezoidal micro cantilever. In Proceedings of the IEEE International Symposium on Assembly and Manufacturing (ISAM), Xi’an, China, 30 July–2 August 2013; pp. 131–134. Stanwix, P.L.; Locke, C.R.; Hughes, T.J.; Johns, M.L.; Goodwin, A.R.H.; Marsh, K.N.; May, E.F. Viscosity of {xCH4 + (1 ´ x)C3 H8 } with x = 0.949 for Temperatures between (200 and 423) K and Pressures between (10 and 31) MPa. J. Chem. Eng. Data 2014, 60, 118–123. [CrossRef] Locke, C.R.; Stanwix, P.L.; Hughes, T.J.; May, E.F. Viscosity of {xCO2 + (1 ´ x)CH4 } with x = 0.5174 for temperatures between (229 and 348) K and pressures between (1 and 32) MPa. J. Chem. Thermodyn. 2015, 87, 162–167. [CrossRef] Riesch, C.; Reichel, E.K.; Jachimowicz, A.; Schalko, J.; Jakoby, B.; Keplinger, F. A suspended plate viscosity sensor featuring in-plane vibration and piezoresistive readout. J. Micromech. Microeng. 2009, 19. [CrossRef] Cerimovic, S.; Beigelbeck, R.; Antlinger, H.; Schalko, J.; Jakoby, B.; Keplinger, F. Sensing viscosity and density of glycerol-water mixtures utilizing a suspended plate mems resonator. Microsyst. Technol. 2012, 18, 1045–1056. [CrossRef] © 2016 by the authors; licensee MDPI, Basel, Switzerland. This article is an open access article distributed under the terms and conditions of the Creative Commons Attribution (CC-BY) license (http://creativecommons.org/licenses/by/4.0/).