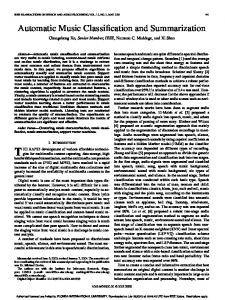
Frequency distribution histogram of the external diameter of myelinated fibres in the ... various methods for dividing univariate bimodal frequency distributions,.
Journal of Neuroscience Elsevier
Metho&
237
20 (1987) 237-248
NSM 00695
A method for automatic classification of large and small myelinated fibre populations in peripheral nerves Y. Usson ‘, S. Torch ’ and G. Drouet
d’Aubigny
2
’ Laboratoire de Zoologie et Biologie Animale, Unite AssociPe C. N. R. S. 682, Equipe de Neurobiologie du Deueloppement, UniversitP Scientifique Technologique et Medicale de Grenoble, Saint Martin d’H&es (France) and’ Laboratoire d’lnformatique et Mathematique darts les Sciences Sociales, Departement de Statistique, Unioersitk Grenoble II, Grenoble (France) (Received 1 September 1986) (Revised 24 November 1986) (Accepted 24 January 1987)
Key words: Automatic
classification;
Peripheral
nerve; Morphometry;
Clustering;
Nerve biopsy
The statistical analysis of morphometric data collected from biopsies of human superficial peroneal nerve is complicated by the heterogeneity of the population of myehnated fibres. In order to make separate statistical analyses of the subpopulations of large and small fibres we have developed a computer program (written in PASCAL) for their automatic separation. The method is based on a dynamic centres clustering algorithm and was applied to the multifactorial space defined by the principal component analysis of the morphometric variables: axonal diameter, myelin sheath thickness, circularity index and g-ratio. The classification technique was applied to measurements obtained from 5 control nerves, and to simulated data, and in each case it gave consistent Gaussian subpopulations with no need for the introduction of supplementary variables.
Introduction The widespread development of microcomputers and the parallel decrease in their cost during the last decade, has resulted in their presence in many laboratories, providing morphologists and neurobiologists with semi-automatic tools for data acquisition and processing (Curcio and Sloan, 1981; Barioz et al., 1982; Pullen, 1982, 1984; Allpress et al., 1983; Mize, 1983; Saxod et al., 1983). In accumulating more morphometric information biologists face the problem of statistical analysis of
Correspondence: Y. Usson, Laboratoire de Zoologie et Biologie Animale, Unite Associee C.N.R.S. 682, Equipe de Neurobiologie du Developpement, Universitt Scientifique Technologique et Mtdicale de Grenoble, BP 68, 38402 Saint Martin d’Heres Cedex, France.
0165-0270/87/$03.50
0 1987 Elsevier Science Publishers
B.V. (Biomedical
Division)
‘3X
0
2
.I External
h
diameter
8
IO
(
pm
12
)
Fig. 1. Frequency distribution histogram of the external diameter of myelinated fibres in the human superficial peroneal nerve (fascicle of 655 fibres).
their data. If frequency distributions happen to follow ordinary unimodal density functions such as normal or gamma laws the usual armoury of statistical analyses is adequate. Otherwise, it is necessary to find other methods or to elaborate specific mathematical models with which to describe the particular frequency distribution of the data. Unfortunately, this second situation confronts neurobiologists when conducting morphometric analyses of peripheral nerves. In particular, analysis of the frequency distributions of calibres of myelinated fibres in human superficial peroneal nerve (Fig. 1) and sural nerve (which are nerves commonly investigated in biopsies in hospital routine) reveals a great heterogeneity of fibre diameters resulting from the mixture of two subpopulations of large and small fibres (Origuchi, 1981; Grosse et al., 1981; Stoebner et al., 1981). A similar heterogeneity of axon calibres has been described in peripheral nerves of several animal species (Mira, 1978; Friede and Beuche, 1985). Some authors have pointed out the impossibility of conducting a significant statistical analysis of the relationship between axon calibres and thickness of myelin sheaths in such situations (Bronson et al., 1978; Berthold et al., 1983) and they suggest that these bimodal frequency distributions should be reduced to their Gaussian subcomponents to allow significant study. In the past, various methods for dividing univariate bimodal frequency distributions, including simple graphic methods (Harding, 1949; Bhattacharya, 1967) and sophisticated computing methods generally based on iterative maximum likelihood estimates (Day, 1969; Hosmer, 1973; Ling and Tolhurst, 1983) or moment recursion relations (Court, 1949) or using Fourier analysis (Gregor, 1969), have been described. Another approach is to design an appropriate mathematical model with which to represent multimodal frequency distributions. In a previous paper, we described such a method for the analysis of the distribution of myelinated fibre calibres (Usson and Drouet d’Aubigny, 1985) based on the use of probability density functions of the canonical exponential family (Cobb, 1978; Cobb et al., 1983). By means of these we have been able to compare the frequency distributions of fibre calibres and to separate large and small fibre populations using the antimodes of
239
functions as segregation thresholds. But this crude method of separation remained unsatisfactory because in the overlapping regions of the subpopulations it was not possible to distinguish between fibres of the same diameter belonging to different groups. It became obvious that the single criterion of calibre was not sufficient and we decided to adopt an approach involving multifactorial analysis. The aim of this paper is to describe the automatic method of multivariate classification of myelinated fibres we developed and which is now used in our laboratory * for the analysis of normal and pathological human superficial peroneal nerves.
Materials and Methods Tissue preparation Specimens of superficial peroneal nerves were taken from subjects in a posttraumatic coma requiring circulatory and respiratory assistance. Segments of 3 cm length of the sensory portion of the nerves were exposed and excised from the distal third of the leg. Sensory nerve conduction velocity and action potential amplitude were measured in each case, and appeared normal. The specimens were fixed for 1 h in 2.5% glutaraldehyde in 0.1 M cacodylate buffer, pH 7.2, at room temperature. After postfixation for half an hour in 1% 0~0, in the same buffer, the pieces were dehydrated in a graded ethanol series and embedded in Epon. Ultrathin sections were cut and stained with uranyl acetate and lead citrate and mounted on single-hole Formvar-covered grids. Electron micrographs were taken with a Philips 201 transmission electron microscope and after printing the final magnification was x 2800. Morphometric measurements Using a Hipad EDT11 digitizing tablet (Bausch & Lomb) connected to a microcomputer (Apple III and Apple Macintosh), the external contour of the myelin sheath and the axonal contour of each myelinated fibre were recorded and stored as files of Cartesian coordinates (x,, y,). From these values the cross-sectional areas (A) and the perimeters (P) were calculated using the following formulas (Pullen, 1984): n-1 A = 4 C
[Cxi
+
xi+l)(Yi+l
-Yi)
-
(YI
+Yz+*)Cx,+l
-xi>]
i=l n-1 p=
c
(Xi+1
-
xi)2
+
(Yi+l
-Yi>*
i=l
where n is the number of points of the closed contour and where coordinates of the first point (xi, yi) are identical to those of the last point (x,, yn). External
* and in the Service de Microscopic Electronique et Pathologie Ultrastrwturale, Regional de Grenoble, France.
Centre Hospitalier
140
diumeters and axonal diameters were deduced from external and axonal perimeters assuming axonal shape to be cylindrical. For each fibre the myelin sheath thickness was calculated as being half the difference between external diameter and axonal diameter and the g-ratio was obtained by dividing axonal diameter by external diameter. Finally, to express deformation of fibre contour from an ideal circular section we calculated a circulurig index using the following formula: 47~Ae Ci = ~ Pe2 where Ci is the circularity index, ranging from 1 for a circle to 0 as the contour deviates from the circular shape, Ae is the surface area and Pe is the perimeter delimited by the external contour of the fibre. Mathematical tools The software was written in standard PASCAL and implemented on Apple microcomputers (Apple III and Macintosh). Principal component analysis. The classification algorithm was not directly applied to the raw space defined by the morphometric variables. As our aim was to obtain the best segmentation between the two populations of fibres it was more judicious to work on a transformed space within which the heterogeneity of data was emphasized. Principal component analysis (PCA) is a multivariate statistical tool (Kendall, 1975; Charfield and Collins, 1980; Lebart et al., 1982; Harris, 1984) which suited our purpose in the sense of building a geometrical space enhancing the differences between data points. The first step of PCA consists of normalizing data; for each variable the arithmetic mean and standard deviation are calculated, and then the value of the mean is subtracted from each data point and the result divided by the standard deviation. This normalization offers the advantage of reducing any possible distortion effect related to the metric of each variable (linear metric for diameters and sheath thickness versus logarithmic metric for g-ratio and circularity index) or their scale range (0 to + cc for diameters and sheath thickness versus 0 to 1 in the case of g-ratio and circularity index). As data are now homogeneous in scale a correlation matrix can be built which contains the values of correlation coefficients for all possible pairs of variables. The examination of correlation coefficients permits the finding of redundancies inside the set of data, followed by elimination of all redundant variables from further analysis (i.e. those which are strongly correlated with another variable). The consequence of this process is a reduction of the dimensionality of the factorial space to its significant vectors alone (morphometric variables). The possibility of reducing the number of variables is a most interesting feature when large iterative programs such as PCA and Clustering Algorithm have to be implemented in a microcomputer environment, that is, with limited memory and slow computation speed. The next step of PCA is diagonalization of the correlation matrix obtained after the redundant variables have been eliminated (Kendall, 1975), in order to find its eigenvalues and eigenvectors. The latter are used to calculate the new coordinates of each data point. Consequently, PCA may be understood as switching axes from
241
k 0
0
GoO@ ,OOooO0 OO
0 0
iteration
no. 0
iteration
no. 2
iterations
q no. 3 & 4
of the
subpopulations
0
> centres Fig. 2. Dynamic centres subpopulations (0, 0).
clustering
of gravity algorithm.
The arrows (4 -,)
0 q elements
Example of classification of two dimensional data into two symbolize the Euclidian distances of a data point from
the centres of gravity
of the subpopulations.
initially defined by the variables to those calculated from the scatter properties of the data. The operations of rotation to achieve the final geometrical transformation have been described by Yelnik et al. (1983). The classification software is derived from an iterative Classification algorithm, clustering algorithm elaborated by Diday (1971) and known as the dynamic clusters method. Diday’s algorithm performs aggregation of the data points with reference to series of “standard points” chosen a priori in the data. In our program we adopt a slightly different approach by aggregating the data points around moving centres of gravity as described later in this section. This method has the advantage that it can be applied to any data set without the a priori knowledge of the characteristics of the clusters required in the dynamic clusters method. Our method consists of aggregating the n data points around k moving centres (where k is the expected number of classes) as a function of the Euclidian distance of each point from every center. At the end of each iteration step, new centres are calculated on the basis of the groups obtained, and the aggregation process is repeated until the centres are stabilized. To illustrate the principle of the method an example of the classification of two-dimensional data into two subpopulations (k = 2) is given in Fig. 2. At the beginning (iteration 0) two data points are randomly taken as initial centres of the two classes. The Euclidian distances separating data points from these centres are calculated and each point is subsequently attached to the nearest centre. Two groups of data points are thus obtained and their centres of gravity are calculated. These centres are used as new aggregation centres for the next step (iteration 1) of the classification. For each group, respectively, the Euclidian distance between the those
new location of the centre of gravity and its location in the previous step is calculated. The sum (Zd) of these distances is used as a measure of stabilization of the centres of the groups. The classification process converges rapidly and after a small number of iterations both groups and centres of gravity are stabilized, that is when 2d is zero or less than an arbitrary threshold (10 -‘). In our example, the stabilization occurs between iterations 3 and 4, and there is no need to repeat the process further. The rate of convergence depends on a small number of factors such as the number of classes one wants to obtain, the random choice of initial centres in the first step and the existence of significant subpopulations in the raw data. However, depending on the choice of initial centres, the final result of classification may differ for a few data points located near the border between the two groups. To minimize misclassification of these points it is necessary to repeat the classification process several times (an odd number from 5 to 11). Each point is then attached to the group it was most frequently associated with. Simulated data. The accuracy of the method was tested on simulated data sets within which every element was known and identified. These were created by mixing stochastically generated populations whose statistical parameters (proportions, means, variances and covariances) were imposed. Therefore, after classification has been performed on simulated data one can establish an index of classification failure by scoring elements which belong originally to a particular subpopulation but were misclassified with another.
Results The results illustrated in Figs. 1, 3, 4 and 5 and presented in Tables I and II correspond to a fascicle containing 655 myelinated fibres whose characteristics are summarized in Table IV (case 1095). Principal component analysis Five available morphometric variables were submitted to Principal Component Analysis. Table I shows the values of correlation coefficients obtained for each possible pair of variables. Simple examination of these values shows that the external diameter is strongly correlated with both the axonal diameter (0.9313) and myelin sheath thickness (0.9157). This is not surprising, since external diameter depends only on axonal diameter and myelin sheath thickness. As it gave redundant information the external diameter was then removed from the analysis. The absolute values of the correlation coefficients obtained for the 4 remaining variables are less than the value of 0.8 that we arbitrarily chose as the redundancy threshold (Kendall, 1975; Charfield and Collins, 1980). Accordingly, these were retained for the rest of the analysis. The eigenvalues of the correlation matrix obtained by diagonalization are presented in Table II as well as the percentages of explained variance associated with the four factorial axes. It appears that the value of cumulated variance reaches an amount of 99.41% when the percentages of explained variance associated with
243
TABLE
I
PRINCIPAL COMPONENT METRIC VARIABLES
Axonal diameter Sheath thickness Circularity index g-Ratio
TABLE
ANALYSIS
- CORRELATION
MATRIX
OF THE
FIVE
External diameter
Axonal diameter
Sheath thickness
Circularity index
0.9313 0.9157 0.2683 - 0.4544
0.7064 0.0709 -0.1175
0.4431 - 0.7534
- 0.5750
MORPHO-
II
PRINCIPAL COMPONENT ANALYSIS - EIGENVALUES PLAINED VARIANCE ASSOCIATED WITH THE FACTORIAL
1st factorial Zndfactorial 3rd factorial 4th factorial
axis axis axis axis
AND PERCENTAGES AXES
Eigenvalue
Explained variance
Cumulated variance
2.4046 1.1079 0.4634 0.0241
60.12% 27.70% 11.59% 0.59%
60.12% 87.82% 99.41% 100.00%
OF
EX-
the factorial axes 1, 2 and 3 are summed. That is the three-dimensional scatter space defined by these axes summarizes 99.41% of the total information contained within the original four-dimensional parametric space. The dispersion of data along the fourth factorial axis represents merely 0.59% of the total variance. This value is less than the relative error due to measurement (a raw 1%) and biological variations (commonly assumed to be 5%). The eigenvectors are given in Table III and show the disposition of the original morphological variables with reference to the principal factorial axes. The projections of the variables myelin sheath thickness and g-ratio on the first factorial axis are, respectively, 0.955 and -0.836. This means that the first factorial axis, which represents 60.12% of the total variance, is strongly correlated with these two parameters and in particular with the myelin sheath thickness.
TABLE
III
PRINCIPAL COMPONENT BLES ON THE FACTORIAL
1st 2nd 3rd 4th
factorial factorial factorial factorial
axis axis axis axis
ANALYSIS AXES
- PROJECTIONS
OF THE
MORPHOMETRIC
Axonal diameter
MyeIin thickness
Circularity
g-Ratio
0.584 0.783 0.203 - 0.072
0.955 0.237 - 0.141 0.113
0.673 - 0.542 0.503 0.000
- 0.836 0.381 0.386 0.079
VARIA-
244
Clussificution algorithm To eliminate variations due to the random positioning of centres in the first iteration step, the classification was repeated 5 times for each data set. The number of iterations necessary to reach convergence ranged from 3 to 12. The final result of the classification into two subpopulations of a real data set consisting of 655 myelinated fibres is shown in Figs. 3-5. The projections of fibres in the scattergrams (Fig. 3) are represented with different symbols corresponding to the groups defined by the automatic classification (square for small fibres, triangle for large fibres). The fibres cluster in two distinct places with different densities. These clusters have various shapes depending on the pair of morphometric variables considered: ellipses (Fig. 3A, B), kidney shapes (Fig. 3C). This is of particular interest since according to Diday (1971), the aggregation of data points with reference to the centres of gravity and not with reference to “standard points” may lead to round-shaped clusters even when the subpopulations are in fact elongated. It appears that the small fibres have less dispersed characteristics than the large fibres for any of the variables studied, with the exception of the circularity index. In this
12 ]
0
‘.O’
4
2
a
6
0
2
4
6
a
1.0
-3 5.
* .
I *
g
..
I
0.8
2 3 ,$ 0.6 3 E! 6 o.4
. .
q
B 2
4
6
Axonal Diameter ( pm )
8
0.2! 0
1 2
n-
1 4
6
-4 8
Axonal Diameter ( wrn )
Fig. 3. Scattergrams of axonal diameter vs the 4 other morphometric parameters. A: vs external diameter. B: vs sheath thickness. C: vs g-ratio. D: vs circularity index. The projections of myelinated fibres are represented with different symbols corresponding to the groups defined by the automatic classification. 0. 429 small fibres. A, 226 large fibres.
245
100 : 2
0 I
80
z "I; 60 2
40
2 "E
20
small flbres larqe flbres
0 0
2
4
External Fig. 4. Frequency
distribution
6
8
10
diameter
histograms of external diameter of the large and small fibre populations determined by automatic classification.
small fibres large flbres
0 I
0.5
1'0
Myelin sheath Fig.
5. Frequency
TABLE
12
( pm 1
1'5
2'0
2’5
thicknessc
distribution histograms of myelin sheath populations determined by automatic
3‘0
pm )
thickness of the large classification.
and
small
fibre
IV
MEAN VALUES (+ STANDARD DEVIATIONS) OF THE DIAMETERS OF MYELINATED FIBRES IN FASCICLES OF FIVE CONTROL HUMAN SUPERFICIAL PERONEAL NERVES Case 111 Fascicle Number of fibres Mean external diameter (pm) Mean axonal diameter (pm) Small fibres % of fibres Mean external diameter (am) Mean axonal diameter (pm) Large fibres % of fibres Mean external diameter (am) Mean axonal diameter (pm)
550
567
1095
800 655 309 258 5.90+2.19 4.95k2.13 5.46 + 2.47 4.77 * 3.01 3.93 f 1.38 3.28 i 1.21 3.56+ 1.43 3.17+ 1.14
1130
712 6.26 f 3.04 4.31* 1.77
69.3 3.9951.00 2.79+0.83
81.8 4.08 kO.88 2.81 f0.82
78.0 4.90 * 0.99 3.40 f 0.87
65.5 3.59 +0.83 2.64 k 0.74
69.1 4.49 * 1.07 3.43 * 0.93
30.7 8.75 f 1.36 5.28 + 0.93
18.2 7.85 * 1.19 4.83 f 0.89
22.0 9.45 & 1.50 5.81 k 1.19
34.5 7.53 + 1.31 4.51* 0.94
30.9 10.20 + 2.20 6.28 + 1.61
case, the large fibres are grouped around a mean value of 0.87 & 0.06 indicating that their shapes are not much different from a circle. In contrast to this. the circularity index of small fibres spreads from 0.4 to 0.95 expressing a broader spectrum of deformations from a circular shape. The frequency distribution histograms 01 external diameter and myelin sheath thickness are shown in Figs. 4 and 5, respectively. The histograms of the small fibre population are clearly normally distributed. The large fibre distribution of myelin sheath thickness appears less Gaussian and less regular because of the choice of class size, but in all cases the hypothesis of Gaussian distribution has been tested and verified using the chi-square test. For all the studied variables the frequency distributions of the two myelinated fibre populations overlap. Some of the large fibres have an external diameter smaller than the mean diameter of the small fibre population (Fig. 4 and Table IV). Minimum overlap between populations is observed for the myelin sheath thickness variable. This, in conjunction with the strong correlation between this variable and the first factorial axis (Table Ill) stresses the importance of myelin sheath thickness as a criterion of classification of myelinated fibres. Consequently. if one wants to determine to which population a single fibre belongs by using only one morphometric variable, one should choose myelin sheath thickness. Simuluted dutu Five sets of simulated data were generated with characteristics based on those of the 5 control nerves (Table IV), to which different biases were added. The classification was performed on these data and the index of classification failure was established for each. The indexes of classification failure obtained were comprised between 0.1% and 1.5% and in all cases. the error was due to simulated large fibres misclassified in the small fibre population.
Conclusion Our method permits a good separation of the large and small fibre populations and requires a maximum of 4 morphometric variables. The resulting groups are normally distributed and consistent. In conclusion, it appears that the myelin sheath thickness is a more discriminant morphological variable than the fibre calibre (although the latter remains a convenient descriptive variable insofar as total population characteristics are concerned) and consequently the different fibre types should be named “ thickly sheathed” and “thinly sheathed” rather than “large” and “small”.
Acknowledgement We thank Prof. P. Stoebner and the Service de Microscopic Electronique et Pathologie Ultrastructurale, C.H.R. de Grenoble for providing us with the tissue samples. This work was supported by a grant (C.R.E 836026) from the lnstitut National de la Sante et de la Recherche Medicale (INSERM).
247
References Allpress, S., Pollock, M. and Nukada, H. (1983) Morphometric assessment of peripheral nerve. In A.D. Kidman, J.K. Ton&ins, C.A. Morris and N.A. Cooper (Eds.), Molecular Pathology of Nerve and Muscle, Humana Press, Clifton, NJ, pp. 151-161. Barioz. C.M., Stoebner, P., Bourdin, A. and Vila, A. (1982) Methode d’analyse morphometrique optique et ultrastructurale du nerf musculo-cutant humain normal, Biol. Cell, 45: 289. Berthold, C.H., Nilsson, I. and Rydmark, M. (1983) Axon diameter and myelin sheath thickness in nerve fibers of the ventral spinal root of the seventh lumbar nerve of the adult and developing cat, J. Anat., 136: 483-508. Bhattacharya, C.G. (1967) A simple method of resolution of a distribution into gaussian components, Biometrics, 23: 115-137. Bronson, R.T., Bishop, Y. and Hedley-Whyte, T.E. (1978) A contribution to the electron microscopic morphometric analysis of peripheral nerve, J. Comp. Neurol., 178: 177-185. Charfield, C. and Collins, A.J. (1980) Introduction to Multivariate Analysis, Chapman & Hall, London, New York, pp. 40-81. Cobb, L. (1978) Stochastic catastrophe models and multimodal distributions, Behav. Sci., 23: 360-374. Cobb, L., Koppstein, P. and Chen, N.H. (1983) Estimation and moment recursion relations for multimodal distributions of the exponential family, J. Am. Stat. Assoc., 78: 124-130. Court, A. (1949) Separating frequency distributions into two normal components, Science, 110: 500-501. Curcio, CA. and Sloan, K.R. (1981) A computer system for combined neuronal mapping and morphometry, J. Neurosci. Meth., 4: 267-276. Day, N.E. (1969) Estimating the components of a mixture of normal distributions, Biometrika, 56: 463-474. Diday, E. (1971) La methode des n&es dynamiques, Rev. Stat. Appl., 19: 19-34. Friede. R.L. and Beuche, W. (1985) A new approach toward analyzing peripheral nerve fiber populations. I. Variance in sheath thickness corresponds to different geometric proportion of internodes, J. Neuropathol. Exp. Neurol., 44: 60-72. Gregor, J. (1969) An algorithm for the decomposition of a distribution into Gaussian components, Biometrics, 25: 79-93. Grosse. R., Burlet, C., Floquet, A. and Floquet, J. (1981) Morphometric study of the post-natal maturation of human superficial peroneal nerve sampled by biopsy-Achieved using automatic image-analysis, Stereol. Iugosl., 3 (Suppl. 1): 533-538. Harding, J.P. (1949) The use of probability paper for the graphical analysis of polymodal frequency distributions, J. Mar. Biol. Assoc., 28: 141-153. Harris, R.J. (1984) A Primer of Multivariate Statistics, 2nd edn., Academic Press, New York, pp. 235-261. Hosmer, D.W. (1973) A comparison of iterative maximum likelihood estimates of the parameters of a mixture of two normal distributions under three different types of sample, Biometrics, 29: 761-770. Kendall, M.G. (1975) Multivariate Analysis, Charles Griffin, London, pp. 13-46. Lebart. L., Morineau, A. and Fenelon, J.-P. (1982) Traitement des Don&es Statistiques-Methodes et Programmes, Dunod, Paris. Ling, L. and Tolhurst, D.J. (1983) Recovering the parameters of finite mixtures of normal distributions from a noisy record: an empirical comparison of different estimating procedures, J. Neurosci. Meth., 8: 309-333. Mira, J.-C. (1978) Etudes quantitatives sur la regeneration des fibres nerveuses myelinisees, Arch. Anat. Microsc. Morphol. Exp., 65: 255-284. Mize, R.R. (1983) A microcomputer system for measuring neuron properties from digitized images, J. Neurosci. Meth., 9: 105-113. Origucbi, Y. (1981) Quantitative histological study in the sural nerve of children, Brain Dev., 3: 395-402. Pullen, A.H. (1982) A structured program in BASIC for the analysis of the peripheral nerve morphometry, J. Neurosci. Meth., 5: 103-120. Pullen, A.H. (1984) A structured program in BASIC for cell morphometry: its application to the spinal motoneurone, J. Neurosci. Meth., 12: 155-178.
748 Saxod. R.. Bouvet. J.. Rourdin. A. and Stoehner. P. (1983) Examen semi-automatise assist6 par ordinateur pour l’analyse morphomttrique de micrographics Clectroniques. Application au nerf periphtrique, Biol. Cell, 48: 84. Stoebner, P., Villa, A.. Bourdin, A. and Barioz, C.M. (1981) Analyse morphometrique du nerf musculocutane humam normal--rCsultats preliminairea. Biol. Cell. 42: 13a. Usson. Y. and Drouet d’Aubigny, G. (1985) Multimodal frequency distribution analysis of peripheral nerves. Anal. Quant. Cytol. Histol., 7: 294-298. Yelnik, J., Percheron. G.. Francois. C. and Burnod. Y. (1983) Principal component analysis: a suitable method for the 3-dimensional study of the shape, dimensions and orientation of dendritic arbortzations, J. Neurosci. Meth.. 9: 115- 125.