A method for evaluating subsurface damage in optical glass Yaguo Li,1,* Hao Huang,1 Ruiqing Xie,1 Haibo Li,1 Yan Deng,1 Xianhua Chen,1 Jian Wang,1,2 Qiao Xu,1 Wei Yang,2 Yinbiao Guo2 1 Fine Optical Engineering Research Center, Chengdu 610041, China School of Mechanical & Electrical Engineering, Xiamen University, Xiamen 361005, China *
[email protected]
2
Abstract: An alternative method for evaluating subsurface damage (SSD) in ground fused silica is presented. The method can acquire the knowledge of depth and morphology of subsurface damage at the same time. The fundamental support lent to the method is the fact that the depth of field reduces as the numerical aperture (NA)/magnification increases in optical microscopes. Large depth of field without undermining NA is preferred in most applications while the narrow range of focus depth is desired for our method. Using this method, we experimented on fused silica which was ground with bound-abrasive diamond wheels and the results show good agreement with the traditional method. The consistency indicates that the proposed method is practicable and effective in inspecting the subsurface damage in optical components. ©2010 Optical Society of America OCIS codes: (220.4610) Optical fabrication; (220.5450) Polishing; (350.3850) Materials processing
References and links 1.
C. Deve, Optical Workshop Principles, Third Ed., 1949 (in French) [translated by T. L. Tippell, Second Ed., 1954, Chap. 2]. 2. J. C. Lambropoulos, S. D. Jacobs, and J. Ruckman, “Material removal mechanisms from grinding to polishing,” Ceram. Trans. 102, 113–128 (1999). 3. S. Li, Z. Wang, and Y. Wu, “Relationship between subsurface damage and surface roughness of optical materials in grinding and lapping processes,” J. Mater. Process. Technol. 205(1-3), 34–41 (2008). 4. J. H. Campbell, “Damage Resistant Optical Glasses for High Power Lasers: A Continuing Glass Science and Technology Challenge,” UCRL-JC-149843 (2002). 5. P. P. Hed, D. F. Edwards, and J. B. Davis, “Subsurface Damage in Optical Materials: Origin, Measurement & Removal,” UCRL-99548 (1988). 6. D. A. Lucca, E. Brinksmeierm, and G. Goch, “Progress in Assessing Surface and Subsurface Integrity,” Ann. CIRP 47(2), 669–693 (1998). 7. R. E. Green, Jr., “Nondestructive Evaluation of Materials,” Annu. Rev. Mater. Sci. 20(1), 197–217 (1990). 8. E. Brinksmeier, “State-of-the-art of non-destructive measurement of sub-surface material properties and damages,” Precis. Eng. 11(4), 211–224 (1989). 9. J. Shen, S. Liu, K. Yi, H. He, J. Shao, and Z. Fan, “Subsurface damage in optical substrates,” Optik (Stuttg.) 116(6), 288–294 (2005). 10. Y. Lee, J. Wang, Q. Xu, J. Han, W. Yang, and Y. Guo, “Evaluating Subsurface Damage in Optical Glasses,” to be submitted. 11. J. A. Randi, J. C. Lambropoulos, and S. D. Jacobs, “Subsurface damage in some single crystalline optical materials,” Appl. Opt. 44(12), 2241–2249 (2005). 12. S. N. Shafrir, J. C. Lambropoulos, and S. D. Jacobs, “Subsurface damage and microstructure development in precision microground hard ceramics using magnetorheological finishing spots,” Appl. Opt. 46(22), 5500–5515 (2007). 13. X. Tonnellier, P. Morantz, P. Shore, A. Baldwin, R. Evans, and D. D. Walker, “Subsurface damage in precision ground ULE(R) and Zerodur(R) surfaces,” Opt. Express 15(19), 12197–12205 (2007).
#131023 - $15.00 USD
(C) 2010 OSA
Received 1 Jul 2010; revised 18 Jul 2010; accepted 19 Jul 2010; published 28 Jul 2010
2 August 2010 / Vol. 18, No. 16 / OPTICS EXPRESS 17180
14. Q. Zhao, J. Chen, J. Yao, and S. Zhou, “Investigation of surface and subsurface damage in diamond grinding of optical glass using hybrid copper-resin-bonded diamond wheel,” J. Vac. Sci. Technol. B 27(3), 1489–1495 (2009). 15. J. Neauport, C. Ambard, P. Cormont, N. Darbois, J. Destribats, C. Luitot, and O. Rondeau, “Subsurface damage measurement of ground fused silica parts by HF etching techniques,” Opt. Express 17(22), 20448–20456 (2009). 16. J. Neauport, C. Ambard, H. Bercegol, O. Cahuc, J. P. Champreux, J. L. Charles, P. Cormont, N. Darboios, P. Darnis, J. Destribats, E. Fargin, I. Iordanoff, R. Laheurte, L. Lamaignere, P. Legros, R. Mercier, and F. Pilon, “Optimizing fused silica polishing processes for 351nm high power laser application,” Proc. SPIE 7132, 71321I (2008). 17. T. R. Thomas, Rough Surfaces, Second Ed., (Imperial College Press, London, UK, 1999), Chap. 2. 18. C. Y. Poon, and B. Bhushan, “Comparison of surface roughness measurements by stylus profiler, AFM, and non-contact optical profiler,” Wear 190(1), 76–88 (1995). 19. V. Radhakrishnan, “Effect of stylus radius on the roughness values measured with tracing stylus instruments,” Wear 16(5), 325–335 (1970). 20. Y. Ebenstein, and L. A. Bentolila, “Single-molecule detection: focusing on the objective,” Nat. Nanotechnol. 5(2), 99–100 (2010). J. J. Schwartz, S. Stavrakis, and S. R. Quake, “Colloidal lenses allow high-temperature single-molecule imaging and improve fluorophore photostability,” Nat. Nanotechnol. 5(2), 127–132 (2010). 21. X. Li, Geometrical Optics & Optical Design, (Zhejiang University Press, Hangzhou, China, 1997), Chap. 14 (in Chinese); see also K. R. Spring and M. W. Davidson, “Depth of Field and Depth of Focus,” http://www.microscopyu.com/articles/formulas/formulasfielddepth.html. 22. A. Barylski, and M. Deja, “Microgrinding of flat surfaces on single-disc lapping machine,” Int. J. Mach. Mach. Mater. 5, 245–267 (2009). 23. T. Suratwala, L. Wong, P. Miller, M. D. Feit, J. Menapace, R. Steele, P. Davis, and D. Walmer, “Sub-surface mechanical damage distributions during grinding of fused silica,” J. Non-Cryst. Solids 352(52-54), 5601–5617 (2006). 24. Z. Wang, Y. Wu, Y. Dai, and S. Li, “Subsurface damage distribution in the lapping process,” Appl. Opt. 47(10), 1417–1426 (2008). 25. P. E. Miller, T. I. Suratwala, L. L. Wong, M. D. Feit, J. A. Menapace, P. J. Davis, and R. A. Steele, “The Distribution of Subsurface Damage in Fused Silica,” Proc. SPIE 5991, 599101 (2005).
1. Introduction Subsurface damage (SSD) is of great importance in material processing, because it is a critical factor influencing the strength of materials and the usage of components. Subsurface damage is incurred due to material fracture in the machining of brittle materials such as glasses and ceramics. The fracture will be generated when brittle material is subjected to extreme pressure such as exerted by fine abrasives, for instance, silicon carbide, alumina, and diamond, etc. which are widely used, at present, for loose abrasive lapping or bound abrasive grinding of glasses [1–3]. The SSD must be eliminated in order to improve the performance and lifetime of optical components by means of polishing techniques [4,5]. Polishing is time-consuming and not cost-effective compared to grinding process. Therefore, the less the material to be removed the better in polishing process. The material that needs to be removed should not be less than the depth of SSD left by loose/fixed abrasive grinding. Therefore it is necessary to measure subsurface damage so as to minimize the cost and time to fabricate an optical component. A number of methods are available to assess subsurface damage in glass and ceramics nowadays [6–10]. Generally speaking, these methods can be grouped into two general categories: destructive and nondestructive evaluation [6,10]. Destructive techniques are more explicit and reliable whilst nondestructive ones will not make samples unusable. Because the equipment for nondestructive testing is usually very expensive and the mechanism is fairly complicated, the destructive methods are preferable to evaluating SSD in optical workshop. To measure subsurface damage, a profiler (e.g. TalySurf by Taylor Hobson) is typically utilized in conjunction with an optical microscope in conventional testing processes [11–14]. The ground surface of fused silica is at first wedged or spotted with a polishing machine and etched in chemical solutions (usually containing hydrofluoric acid or fluoride) to open cracks, then profiled with a stylus profilometer along the wedge or the centerline of the spot and inspected
#131023 - $15.00 USD
(C) 2010 OSA
Received 1 Jul 2010; revised 18 Jul 2010; accepted 19 Jul 2010; published 28 Jul 2010
2 August 2010 / Vol. 18, No. 16 / OPTICS EXPRESS 17181
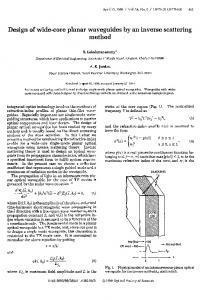
with the aid of an optical microscope. At last, the results from profilometer and microscope are compared in order to gain knowledge of subsurface damage (e.g. depth of SSD, morphologies at varied depths below the ground surface). The above procedure requires that the area scanned with the microscope correspond to the area profiled with the profilometer, which maybe bring about repositioning errors. In addition, the essential instrument profilometer can be as expensive as several hundred thousand dollars like the Form Talysurf PGI-1240, Taylor Hobson. More recently, a convenient approach was put forward by J. Neauport et al. to determine the subsurface damage of ground fused silica without the need for optical microscopy and pre-polishing to expose the SSD [15,16]. However, the surface to be measured undergoes chemical etching together with profiling several times so that the variation in surface roughness with the etching time/thickness can be obtained. The profilometer is a key apparatus to this technique, too. It is not necessarily time-saving to implement this technique in comparison with the traditional method. Most importantly, the results of the method strongly depend on the tip of the profilometer’s stylus [17–19]. Theoretically speaking, the sharper the tip is, the closer to actual value the measurements are. As a result, this technique underestimates the actual depth of subsurface damage. Here we proposed an alternative to the classical testing method. The preparation of samples is the same as the conventional method whereas the differences exist in the observation and measurement of subsurface damage. A laser displacement sensor (less than ten thousand dollars) far more inexpensive than the Form Talysurf is combined with an optical microscope to simultaneously acquire the information on depth and density of subsurface damage. The repositioning error is obviated since there is no need for the transportation of the sample from microscopes to profilers or inverse operation. The detailed description of the system is presented and followed by discussion on the properties of measuring system. Finally, a comparison in measuring results between the new method and traditional one is given. 2. The basic science of the proposed method and the configuration of measuring system As it is well known, each objective lens in a microscope has characteristic numerical aperture (NA), focus distance and depth of field (DOF). Greater magnification will be accompanied by larger NA and smaller DOF as well as shorter working distance (focal length). The depth of field in an optical microscope decreases as magnification increases. In most cases, both large NA and DOF/working distance (focal length) are preferred. Much effort has been made to increase the NA whilst maintaining long working distance and large DOF [20]. However, small DOF rather than large DOF is desirable in our method, because the DOF dominates the resolution of the proposed method which is based on the fact that the cracks out of focus are blurred and only when located in the range of depth of field the cracks can be clearly observed. When there exist cracks at Z1 & Z2, one can first focus the objective onto the location Z1 (Fig. 1). Moving the stage under the sample or the objective and adjusting the objective lens to focus the lens onto Z2, the difference is the depth of Z2 from Z1 once the values of Z1 & Z2 can be known and the cracks at Z1 & Z2 can be imaged as well. If Z1 is located on the surface of a ground fused silica sample, the difference between Z1 and Z2 is the depth of subsurface damage when the last traces of SSD is situated at Z2. Varying the Z2, one can collect a series of morphologies at various depths under the ground surface. This way the SSD depth and morphology of SSD at a certain depth can be obtained at the same time.
#131023 - $15.00 USD
(C) 2010 OSA
Received 1 Jul 2010; revised 18 Jul 2010; accepted 19 Jul 2010; published 28 Jul 2010
2 August 2010 / Vol. 18, No. 16 / OPTICS EXPRESS 17182
Fig. 1. The basic principle of our SSD measuring system
According to the abovementioned principle, a measuring system was set up. This set-up is composed of an optical microscope (Leica DM4000M, Germany), a laser displacement sensor (Keyence LK-G10, Japan), a motorized translation stage capable of moving in 3-direction independently (i.e. X, Y, Z axes) and a computer for displaying the images of cracks, controlling the movement of the stage and processing data (Fig. 2). The microscope was equipped with 5 types of objective lens with 5 × , 10 × , 20 × , 50 × , 100 × magnification, respectively, as well as a 10 × eyepiece. However, only two objectives (largest and smallest magnification lens) were frequently used in our experiments; the 100 × lens was applied to measure the depth of SSD and the other 5 × lens was employed to assist in approximately positioning the area to be examined and locating the last trace of SSD due to its relatively wide field of view (2620.3µm × 1965.2µm). The laser displacement sensor with a resolution of 0.1µm plays a part in registering the displacement in Z direction, the detecting beam of which is red laser light of 650nm in wavelength. The translation stage driven by a motor can travel in three directions independently with steps of 0.1mm, 0.1mm and 0.1µm in X-, Y-, and Z-axis, respectively. Two screws are designed to guarantee a horizontal stage or surface to be tested.
Fig. 2. Sketch of apparatus for measuring subsurface damage of ground substrates. The translation stage is capable of moving along X, Y and Z directions.
The resolution of the measuring system is influenced by many factors, among which the depth of field is the most important. The depth of field usually relates to numerical aperture (NA) and magnification of the objective. Provided that the sample lies within the range of the depth of field (DOF), the viewgraph will be clear. In our experiments, the small DOF facilitated the resolution of the system; as a result, the large NA/magnification objective lens(100 × ) was selected. The DOF of some commonly used objectives are tabulated in Table 1 [21], including the measured range out of which the images were apparently dimmed. The range is the distance between lower and upper position beyond which the images of cracks are obviously vague.
#131023 - $15.00 USD
(C) 2010 OSA
Received 1 Jul 2010; revised 18 Jul 2010; accepted 19 Jul 2010; published 28 Jul 2010
2 August 2010 / Vol. 18, No. 16 / OPTICS EXPRESS 17183
Table 1. The magnification and numerical aperture (NA) of common-use objective lens and corresponding depth of field (DOF). Magnification
5×
10 ×
20 ×
50 ×
100 ×
NA
0.15
0.3
0.5
0.8
0.9
DOF/µm
19.3
4.8
1.5
0.4
0.2
Measured range/µm
-