Independent component analysis (ICA) is a data-driven approach for extracting components and time courses of interest from fMRI data. ICA has been applied to.
A Method for Testing Conjuntive and Subtractive Hypotheses on Group fMRI Data Using Independent Component Analysis V. D. Calhoun1, T. Adali2, G. D. Pearlson1, J. J. Pekar3 1
Olin Neuropsychiatry Research Center/Yale University, Dept. of Psychiatry, Hartford, CT, United States, 2University of Maryland Baltimore County, Dept. of CSEE, Baltimore, MD, United States, 3Johns Hopkins, Dept. of Radiology/FM Kirby Research Center, Kennedy Krieger Institute, Baltimore, MD, United States
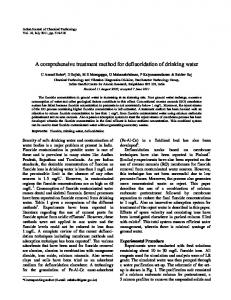
Synopsis Independent component analysis for fMRI has been extended for use with multiple subjects but a method for group comparisons is needed. We propose a method for performing subtractive and conjunctive comparisons of group ICA data. Our approach compares similar features (either in space or in time) extracted from group data, allowing subtractive and conjunctive tests to be performed on ICA components. We demonstrate its application to a simple set of paradigms designed to stimulate visual cortex, motor cortex, or both. Introduction Independent component analysis (ICA) is a data-driven approach for extracting components and time courses of interest from fMRI data. ICA has been applied to fMRI data with promising results [1]. We have recently extended ICA for the analysis of groups of subjects [2]. In many fMRI experiments, it is desirable to directly compare and contrast two different conditions either within or between subject groups. Methods for performing such comparisons have been developed within the framework of the general linear model; however such comparisons are not intuitive for ICA. There is a need for ICA methods providing for comparing one or more groups of subjects or paradigms. We propose a method for comparing similar features extracted from group data allowing subtractive and conjunctive tests to be performed on ICA components. We demonstrate it on data from a set of experiments designed to stimulate visual cortex only (V), motor cortex only (M) or both visual and motor cortices (VM). Comparison of Group ICA Data The implicit hypothesis test in most functional imaging methods, such as those based upon the GLM, is whether activation amplitudes are significantly “unique” or different from the null hypothesis of zero in the areas of interest or not. This is similar to the test used in data-driven approaches. For example, in ICA one might select a “component of interest” by choosing the component that correlates the highest with a task waveform. Next, a test is performed to determine which voxels are significantly “contained” in this component and these are determined to be “activated”. The main difference between GLM and ICA is that in ICA, it is difficult to assign probabilities to components since the model is not specified a priori. However this is not a problem for group ICA studies, which involve a second level analysis. In both ICA and GLM approaches, t-tests are performed. The null-hypothesis tested is whether “activated” regions are significantly different from zero. Thus at this stage one uses a similar model for both GLM and ICA approaches. Comparisons of two ICA groups can be problematic because the ICA results represent a comparison of two different linear models with different time courses. We propose a solution involving extracting components of interest using an a priori spatial or temporal template (see figure at right) as well as quantifying whether the components extracted from the two groups have sufficiently unique time courses from the remaining (unextracted) components. Methods Using a Philips NT 1.5 T scanner, BOLD scan were acquired (EPI, TR=1s, TE=39ms, fov=24cm, 64 x 64, st=5.5 mm, 18 slices) over a 3-min, 40-sec period. The visual stimuli were provided on a rear-projection screen subtending 25 degrees of visual field via an LCD projector. Following review and approval by the Johns Hopkins University Institutional Review Board, eight subjects gave informed consent. The four paradigms utilized were visual (V), motor (M), and visuomotor (VM). The visual paradigm consisted of an 8 Hz reversing checkerboard (RC) presented for 20 seconds in the right visual hemifield, followed by 5 seconds of an asterisk fixation, followed by 20 seconds of RC presented to the left visual hemifield, followed by 10 seconds of an asterisk fixation. This 55 second set of events was repeated four times for a total of 220 seconds. The motor paradigm consisted of the subjects touching their right thumb to each of their four fingers sequentially, back and forth, at a self paced rate. Cueing was done via a fixation point which was one of three colors, lime (indicating move left hand), red (indicating move right hand) or white (indicating move neither hand). The visuomotor paradigm consisted of the same stimulus as in the visual paradigm, with subjects instructed to move the hand on the same side on which the visual stimulus is presented. The images were imported into SPM99, normalized into a Talairach template [3,4], and group ICA was performed for each paradigm. Second level subtractive and conjunctive analyses were then performed on the resulting amplitude images. Onset latencies were estimated using a weighted least squares technique [5]. Results The group ICA results revealed, for the V paradigm, activation in the left or right visual cortex during right or left visual hemifield stimulation, respectively, with time courses closely matching the paradigm. Additionally, transient parieto-occipital activation was observed only during changes in the visual display. The M paradigm reveals activation in the left or right motor cortex during right or left finger movement, respectively. Activation in the supplementary motor area, basal ganglia and contralateral cerebellum is also observed. The VM paradigm (see figure at right) reveals activation in both left or right visual and motor cortex during left or right finger movement/visual hemifield stimulation, respectively. A small, but significant latency difference was observed between the onset of visual and motor activation (see table at right). The conjunction analysis revealed overlapping parieto-occipital areas (green) for all three paradigms. As expected, the commonly activated areas (i.e. visual for V&VM, motor for M&VM) are revealed. The subtraction analysis revealed, as expected, motor regions in the VM minus V comparison and visual areas in the VM minus M comparison. Additionally, a significant difference in the anterior motor cortex for the M experiment compared with the VM experiment was revealed. The parieto-occipital regions are largely cancelled by subtraction and are not significantly visible in either comparison. The M minus VM comparison reveals motor areas anterior to those seen in the conjunction analysis. Spatial comparisons indicated larger extent of activation during the M or V experiments. Conclusion We have presented a method for comparing multi-subject fMRI data using independent component analysis, and demonstrated its application to a simple set of paradigms. We performed conjunctive and subtractive Group Averaged Left Cortex Right Cortex comparisons on both the component maps and the time courses for a visual, motor, and visuomotor paradigm. The Onset Latencies method presented allows detailed subtractive and conjunctive analysis of both brain activation and time courses Visual Experiment 3.46±0.33s 3.19±0.28s across groups or paradigm for the flexible modeling approach, ICA. Motor Experiment 3.91±0.30s 4.43±0.32s Difference .450±0.18s 1.24±0.53ms References (p