© EARSeL and Warsaw University, Warsaw 2005. Proceedings of 4th EARSeL Workshop on Imaging Spectroscopy. New quality in environmental studies. Zagajewski B., Sobczak M., Wrzesień M., (eds)
A METHOD USING DIFFERENT REMOTE SENSING TECHNIQUES FOR ESTIMATING GRASSLAND BIO-PHYSICAL VARIABLES J.G.P.W. Clevers1, G.W.A.M. van der Heijden2 and A.G.T. Schut2 1. Centre for Geo-Information (CGI), Wageningen University and Research Centre, P.O. Box 47, 6700 AA Wageningen, The Netherlands;
[email protected] 2. Plant Research International, P.O. Box 16, 6700 AA Wageningen, The Netherlands ABSTRACT For efficient grassland management, information on the spatial variation of the crop within fields is of the utmost importance. Currently, this mainly depends on qualitative expert knowledge. Quantitative information on the actual status of grass swards at the right moment in the season is important for management decisions, like nitrogen supply, water supply or harvesting. Remote sensing has proven to be a useful technique for estimating and mapping the spatial variation of various biophysical variables. A whole range of vegetation indices has been developed for estimating variables like biomass, leaf area index and the fraction of absorbed photosynthetically active radiation for a range of vegetation types. However, calibration of the image data is crucial in the performance and applicability of this technique. The aim of this paper is to show the possibility to calibrate image data using fast non-destructive close-range sensing instruments, hence being able to build models to assess important plant characteristics on large areas. A homogeneously managed grassland field of about one hectare was used as a test site. It was subdivided into 20 plots of 15 by 3 meters. End of July 2004 measurements were performed with a close-range sensing device, the so-called Imspector Mobile. This imaging platform consists of two imaging spectrographs, covering the spectral range of 440-960 (Imspector V9) and 850-1680 nm (Imspector N17), and a 3-CCD camera, equipped with special band filters (centre wavelengths are at 600, 710 and 800 nm). The platform is further equipped with artificial light sources. An airborne campaign with the UltraCam digital CCD camera (centre wavelength of the four bands are at 460, 520, 660 and 740 nm) was used for extrapolation to large scale areas. Plots were harvested and variables like fresh and dry biomass, and leaf nitrogen content were determined. Results showed that the Imspector Mobile could be used for estimating crop variables of the grassland field with a grass-clover mixture. Partial least squares (PLS) models combining spectral and spatial information from the Imspector Mobile yielded acceptable results in predicting crop variables. Subsequently, the predicted field variables were used to build a prediction model using the reflectance values of the UltraCam images. These were then compared with the measured field variables and the model proved to have acceptable predictive power. INTRODUCTION Energetically speaking, current agricultural cropping systems have a low efficiency. Under Dutch growing conditions - with highly developed agricultural practices – still no more than 1% of the energy of the sun reaching the earth surface is fixed in plant biomass (chemical energy in crops). The net yield of grassland is estimated at no more than 8.5 ton dry matter (DM) yield per hectare on average each year, whereas the potential gross yield with the same agricultural practices on experimental plots is estimated at 15 ton DM per ha per year. If we can lower this so-called 'yield gap', the same or more biomass can be produced on a smaller area. Since the area of grassland in the densely populated Netherlands is over 1 million ha, more efficient management lowering the yield gap is extremely useful. However, at this moment it is still not clear what causes this ‘yield
© EARSeL and Warsaw University, Warsaw 2005. Proceedings of 4th EARSeL Workshop on Imaging Spectroscopy. New quality in environmental studies. Zagajewski B., Sobczak M., Wrzesień M., (eds)
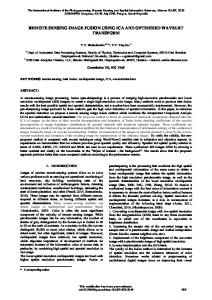
gap’. Insight in the causes is hampered by the lack of fast and accurate methods for determining crop growth. Various techniques, e.g. using imaging spectroscopy, are therefore developed for determining the causes of this yield gap. If we do know the causes, we can optimize current grassland management practices, using precision agriculture. Optimization refers to biomass production of high quality in order to maximize animal production. This requires the need to monitor the crop over large areas. To assess stagnation of growth and impending yield reduction at a large scale, the availability of fast, timely and accurate methods is called for. Furthermore, such methods can also be used for estimating the amount of nitrogen left in the soil, which could be re-used, hence minimizing environmental impacts associated with fertilization. The latter being of increasing concern [1]. The role of imaging spectroscopy for the characterisation of grass swards was studied by Schut [26]. He explored the potential for growth monitoring, detection of nitrogen and drought stress, and assessment of dry matter yield, clover content, nutrient content, feeding value, sward heterogeneity and production capacity using a close-range imaging spectroscopy system applicable in the laboratory or for mini-experiments. From this a mobile system was developed for application to field experiments, the so-called Imspector Mobile [7]. This imaging platform consists of two imaging spectrometers, covering the spectral range of 440-960 (Imspector V9) and 8501680 nm (Imspector N17), and a 3-CCD camera, equipped with special band filters (centre wavelengths are at 600, 710 and 800 nm). The platform is further equipped with artificial light sources and thus can measure independently of external weather conditions. A combination of image parameters and hyperspectral reflectance curves derived from classified images can be used to estimate yields, nutrient contents and feeding value of grass plots [8]. Although the Imspector Mobile is a non destructive and relatively fast measurement device, it is not suitable for monitoring large areas of grassland. Remote sensing has proven to be a useful technique for estimating and mapping vegetation biophysical variables over large scale areas. Both statistical and physical methods have been used for describing the relationship between spectral measurements and biophysical variables. As an example, a whole range of vegetation indices has been developed for estimating variables like biomass, leaf area index and the fraction of absorbed photosynthetically active radiation for a range of vegetation types. For estimating leaf chlorophyll and nitrogen content imaging spectroscopy has shown promising results [9]. However, calibration of the image data is crucial in the performance and applicability of this technique. Therefore we try to combine the dedicated close-range sensing equipment with remote sensing techniques. By using the Imspector Mobile for calibrating the remote sensing data, we hope to be able to extrapolate the results to large areas of grassland. The idea is illustrated in figure 1. Beeri et al. [10] developed an alternative approach for using ground-truth models for sugar beet N-credit and tested these models with satellite images.
Physical + chemical measurements
cal.
Close sensing
cal.
Remote sensing
Figure 1: Schematic representation: destructive and expensive measurements are used to calibrate the close-range sensing device. The close-range sensing device can then characterise the status of the crop at many locations, fast and non-destructively. These data can then be used to calibrate the remote sensing data. After calibration, these data can be used for extrapolation of these characteristics to larger areas. 760
© EARSeL and Warsaw University, Warsaw 2005. Proceedings of 4th EARSeL Workshop on Imaging Spectroscopy. New quality in environmental studies. Zagajewski B., Sobczak M., Wrzesień M., (eds)
The objective of this paper is first to test the potential of the close-range Imspector Mobile system for estimating crop variables of the grassland field with a grass-clover mixture. Therefore the features measured with this device will be used to build a model to predict the most important grassland characteristics. Subsequently, another model will be built using the reflectances derived from UltraCam digital camera images for spatially extrapolating the Imspector estimates. First we will describe the field experiment and the chemical analysis used in this study. Next we will describe the Imspector Mobile, and build a model to predict grassland characteristics. Finally, we will use the fitted values of the Imspector Mobile to build a model for the remote sensing data to extrapolate the results to large areas of grassland. MATERIAL AND METHODS Field experiment and chemical analysis Within field 1 of the Droevendaal experimental farm in Wageningen (the Netherlands), a total of 20 plots were defined within a field with a mixture of grass and white clover. These plots were 15 m long and 3 m wide with a spacing of approximately 10 m between the plots. After recording the spectral reflectance with various instruments, plots were harvested with a Haldrup plot-harvester on 30 July 2004. The biomass was recorded with a built-in weighing unit on the Haldrup harvester. After cutting, a drill sample was taken from the harvested material. These samples were oven dried during 72 hours at 70oC. After drying, samples were ground and sieved. From this material, a subsample was taken for wet-chemical analysis on total-N, P, K, Ca and Na content. Total-N and P was measured with the so-called Segmented Flow Analysis procedure, after destruction with H2O2, Se, H2SO4 and salisic acid. Contents of K, Ca and Na were measured using Flame-Atomic Emission Spectrometry. Imspector Mobile The plots in field 1 at Droevendaal were measured on 29 July 2004 with the Imspector Mobile (Figure 2). The Imspector Mobile has a GPS, a speedometer and three sensors on board consisting of a detector, filters or spectrograph, lens and an artificial xenon light source, which allows for nearly constant illumination over all recordings [7, 8].
Figure 2: The Imspector Mobile.
761
© EARSeL and Warsaw University, Warsaw 2005. Proceedings of 4th EARSeL Workshop on Imaging Spectroscopy. New quality in environmental studies. Zagajewski B., Sobczak M., Wrzesień M., (eds)
The three sensors are: 1. A 3CCD camera with 1024×1390 pixels and 3 narrow spectral bands at 600, 710 and 800 nm recording the reflection of an area of 45×60 cm on the soil surface. Using image processing, the percentage of ground cover, an index of reflection intensity and the mean reflections of green pixels per band were calculated from the 3CCD images. Within an image, the standard deviation of ground coverage was calculated over sub-blocks of 5 cm2 and 15 cm2. Two examples of typical pictures taken by this sensor are shown in Figure 3. 2. A visible light imaging spectrograph (ImSpector V9). The V9 sensor records the reflection from 439-956 nm in 1090 spectral bands with 1300 pixels on the image-line. The recorded image line at the soil surface is approximately 1.39 mm wide and 152 mm long. 3. A NIR imaging spectrograph (ImSpector N17). The N17 sensor records the reflection from 848-1680 nm in 256 spectral bands with 320 pixels on the image-line. The recorded image line at the soil surface is approximately 1.39 mm wide and 133 mm long.
Figure 3: Images 10 and 20 from the 3CCD sensor from plot 1. The 50%-grey Spectralon standard is present at the top and bottom in every recording. One image-line is taken such that it coincides with an image-line in the upper part of the 3CCD image, the other image-line coincides with an image-line in the lower part of the 3CCD image, both across the 50% reflecting Spectralon standards (see Figure 3). Images were recorded while driving with a velocity of 0.3-0.5 m/s. On each plot, 20-30 recordings were made with each sensor within a narrow strip of 60 cm wide in the middle of the plot. After recording, reflection was calculated using the Spectralon standard, available in every recording. The V9 and N17 images were warped to correct for bending in the spatial and spectral direction [11]. All measurements were geolocated using the on-board GPS system. Calculation of V9 and N17 explanatory variables for Imspector Mobile Pixel spectra in the V9 and N17 were normalized by dividing the spectrum by the mean reflection from 743-955 nm for the V9 sensor and from 1070-1130 nm for the N17 sensor. Pixels were assigned to the classes green material, dead material or soil using thresholding [8]. Spectra of green material within a plot were averaged to a single average spectrum per plot for V9 and N17.
762
© EARSeL and Warsaw University, Warsaw 2005. Proceedings of 4th EARSeL Workshop on Imaging Spectroscopy. New quality in environmental studies. Zagajewski B., Sobczak M., Wrzesień M., (eds)
Calculation of 3CCD explanatory variables for Imspector Mobile The 3CCD images were classified into separate pixels containing background material (soil, dead material) and green leaves. Ground coverage (GC) was calculated as the percentage of pixels classified as green material. The mean reflection in bands at 600 (R600), 710 (R710) and 800 nm (R800) were calculated for pixels classified as green material. As a result of system design, reflection intensity is a function of leaf height and leaf angle. Higher reflection intensities correspond with higher positions in the canopy and a more horizontal leaf orientation. Therefore, pixels in the class with green leaves were subdivided into 10 reflection intensity classes. The index of reflection intensity (IRI) is calculated as the percentage of pixels classified as green material that is present in the (intensity) classes with the highest reflection intensity [3] . Schut et al. [3] used wavelet analyses and the spatial standard deviation to quantify heterogeneity, damage and productivity of grass swards. For the 3CCD images a similar approach was followed. The 3CCD images were subdivided into square blocks of 5 cm2 and 15 cm2. The (spatial) standard deviation of GC values (GC_SSD) was calculated as the standard deviation of the GC values per block. Transects of 210 adjacent pixels were defined in the row and column direction within the 3CCD images. For each transect wavelet entropy and wavelet energy values were calculated [2]. Finally, mean values per image and per plot were calculated. Wavelet energy is a measure of the number of wavelet frequencies that are required to describe a certain pattern. Higher values for wavelet entropy correspond with grass dominated swards and low values correspond with swards dominated with species with larger leaves (e.g. clover). The wavelet energy corresponds with the amplitude of a certain pattern, in our case higher values coincide with more biomass accumulation. The clustering of green pixels with homogeneous colour characteristics was determined with image analyses procedures based on the principles of mathematic morphology. This procedure will result in a larger fraction of leaf clusters when swards are dominated by clover. UltraCam digital camera Vexcel’s UltraCam digital camera system delivers large format aerial imagery that is radiometrically and geometrically superior to images captured by conventional film cameras at a comparable price [12]. It features a better than 12-bit per pixel dynamic range, compared to film cameras at less than 8-bits per pixel, and without any grain-noise. The UltraCam system comprises a panchromatic band and four multispectral bands (Table 1). On 28 July 2004 Aerodata performed a flight line across Wageningen with the UltraCam-D digital camera. The flight altitude was about 2790 m, resulting in a pixel size of 0.25 m for the panchromatic band and 0.78 m for the multispectral bands (blue, green, red and near-infrared). Aerodata provided all data in tiff-format, after performing a geometric correction for the internal camera geometry and a radiometric correction for vignetting and white balance. In total 21 images were recorded with an overlap of nearly 80%. The image size is given in Table 1 in terms of pixels, which means that one image covers an area of about 2875 by 1875 m. The spectral sensitivity of the four spectral bands is depicted in Figure 4.
763
© EARSeL and Warsaw University, Warsaw 2005. Proceedings of 4th EARSeL Workshop on Imaging Spectroscopy. New quality in environmental studies. Zagajewski B., Sobczak M., Wrzesień M., (eds)
Table 1: Specifications of the UltraCam digital camera [13]. Sensor type Focal length (mm)
Area CCD 100 mm Panchromatic 28 mm Multispectral 55 × 37 9 11500 × 7500 pixels 3680 × 2400 pixels 9 >12 450 – 665 (Pan) 420 – 475 (blue) 455 – 580 (green) 635 – 675 (red) 700 – 805 (NIR) POS Z/I 510 navigation system with GPS and INS
Total field of view (o) Number of CCD lines/camera Panchromatic image size Multispectral image size Sensor size (µm) Radiometric resolution (bit) Spectral resolution (nm) (Full Width Half Maximum)
Georeferencing
UltraCam Spectral Bands 20 18
Spectral Sensitivity (rel.)
16 14 12
Blue Green Red NIR
10 8 6 4 2 0 360
410
460
510
560
610
660
710
760
810
860
910
960
Wavelength (nm)
Figure 4: Spectral sensitivity of the four spectral bands of the UltraCam-D camera as used on 28 July 2004.
764
© EARSeL and Warsaw University, Warsaw 2005. Proceedings of 4th EARSeL Workshop on Imaging Spectroscopy. New quality in environmental studies. Zagajewski B., Sobczak M., Wrzesień M., (eds)
Figure 5: Parts of a false colour composite image made with the UltraCam-D camera over the Wageningen site on 28 July 2004 (image lvl02-00234). Left: part of the area with five reference targets is shown; right: the grass/clover test site with the polygons showing the Imspector measurement sites. Figure 5 shows an example of parts of an Ultracam image over Droevendaal. Shadows of some cloud cover are present in the upper left corner of the image. Going further north along the flight line, the influence of cloud cover was becoming more severe. The UltraCam images were georeferenced to the Dutch national coordinate system (RD) using a basemap. A second order polynomial transformation yielded an overall rms-error of about 0.6 m using 97 ground control points. The pixel values of the UltraCam images can be converted to reflectance factors by using reference targets. A linear transformation can be used in order to correct for camera calibration and atmospheric effects [14]. The assumption is that effects (e.g., from the atmosphere) are the same for the targets and for the objects to be calibrated. Therefore, we suggest to do this calibration to ground reflectances only within one image if weather conditions are not optimal. Reference targets During the 2004 campaign reference targets were deployed at the Wageningen site. Five targets were used in total. They consisted of aluminum plates of 2.50 by 2.50 m, covered with Nextel Suede coating paint at different gray levels providing nearly Lambertian reflectance characteristics at various reflectance levels. Figure 6 shows the spectral reflectance as measured with a FieldSpec spectroradiometer. On 29 July 2004 a field campaign with a FieldSpec Pro FR spectroradiometer was performed. The FieldSpec instrument is built by Analytical Spectral Devices (ASD) in the US. The FieldSpec Pro spectroradiometer was deployed using the fiber optic cable with a 25° field of view. Measurement height above the object was about 1 – 1.5 m. As a result, the field of view at the object level was circular with a radius of 0.22 – 0.33 m. About 10 measurements per object were performed, whereby each measurement is the average of 50 readings at the same spot. Although weather conditions were constant, the spectroradiometer was calibrated regularly using a Spectralon calibration panel. This panel was calibrated very accurately in the laboratory and its characteristics were stored as calibration files on the computer. Before performing a new calibration, the Spectralon reference was measured just like the other objects. The latter measurement could be used for checking whether measurement conditions remained constant between two calibrations.
765
© EARSeL and Warsaw University, Warsaw 2005. Proceedings of 4th EARSeL Workshop on Imaging Spectroscopy. New quality in environmental studies. Zagajewski B., Sobczak M., Wrzesień M., (eds)
Reference targets 1.0
Reflectance
0.8
0.6
70% target 40% target 25% target 10% target 5% target
0.4
0.2
0.0 350
550
750
950
1150
1350
1550
1750
1950
2150
2350
Wavelength (nm)
Figure 6: Spectral reflectance characteristics of the reference targets used at the Wageningen site in 2004. Statistical analysis As a first step, the variables measured by the Imspector Mobile were used to estimate the field measured variables using partial least squares (PLS) models. Step two was to build a model using the predicted field measurements from step 1 as response variable and the mean values of calibrated reflectances obtained with the UltraCam digital camera system coinciding with the measured area in the field as explanatory variables using a multiple linear regression (MLS) model. Finally, the predicted variables obtained from the UltraCam image were compared with the measured field variables and the model was used to extrapolate the field characteristics over the entire image. To select the number of latent variables in the PLS-model, the root-mean-square error of crossvalidation (RMSECV) was calculated as:
∑ (yˆ
RMSECV =
− yi )
2
i
i
,
n
where yˆ i and y i were respectively the leave-one-out predictions and observed values of the variable of interest, i.e. the model was fitted without using observation i and then observation i was predicted using this model. This was done for all observations. To obtain insight in the prediction capability of the model, we use the percentage of variation accounted for by the cross validated model (using the leave-one-out predictions) with regard to the total variation in the dataset:
Q 2 = 1−
∑ (yˆ
i
−yi
i
∑ (y
i
−y
) )
2
2
,
i
766
© EARSeL and Warsaw University, Warsaw 2005. Proceedings of 4th EARSeL Workshop on Imaging Spectroscopy. New quality in environmental studies. Zagajewski B., Sobczak M., Wrzesień M., (eds)
where y is the average value of the observed variable of interest. The Q2 has strong resemblance with R2 but can become negative if the prediction of the model is inadequate (e.g. in case of overfitting). The Q2 is (as R2) strongly sensitive to the variation within the data set, so should be considered with caution. RESULTS AND DISCUSSION Field measurements Table 2 summarizes the field measurements performed for the 20 plots of the grass/clover experiment. Yield figures were at a high level for all plots. The plots were defined within a normal grassland field and no treatment differences existed between the various plots. As a result the range in yield figures is not large, which may reduce the statistical significance of relationships between spectral measurements and the field measurements. Table 2: Summary statistics for the 20 plots of the grass/clover experiment (harvested on 30 July 2004).
Biomass (t/ha) DM yield (kg/ha) DM content (%) N content (g/kg DM)
Minimum 10.91 2186 16.24 27.78
Maximum 24.39 4187 21.33 32.61
Mean 17.79 3346 18.96 30.27
Standard deviation 3.39 499 1.11 1.23
CV 0.19 0.15 0.06 0.04
N 20 20 20 20
Imspector Mobile Table 3 gives the correlation coefficients of the most important image parameters and the four grassland characteristics biomass, DM yield, DM content and N content. The variables GC and GC_SSD are most strongly correlated with biomass. Variability within a plot is negatively related to biomass, a larger heterogeneity means lower yields. Leaf clustering and wavelet entropy do not correlate strongly to any of the variables. This means that the content of white clover is not so important for differences in yield or contents between plots. The spatial patterns and heterogeneity within the plots is illustrated in Figure 7 for 4 variables derived from the 3CCD images of the Imspector Mobile. Table 3: Correlation coefficients of the most important image parameters and biomass, DM yield, DM content and N content.
GC GC_SSD_5cm2 GC_SSD_15cm2 Leaf clusters Wavelet entropy R600/R710 IRI (R800-R600) / (R800-R710) R600 R710 R800
Biomass 0.85 -0.59 -0.87 -0.04 0.17 -0.82 0.78 -0.82 -0.19 0.32 0.80
DM yield 0.75 -0.50 -0.78 -0.20 0.28 -0.77 0.69 -0.70 -0.20 0.28 0.69
DM content -0.81 0.59 0.78 -0.26 0.11 0.71 -0.76 0.81 0.11 -0.34 -0.80
N content 0.52 -0.40 -0.39 0.14 -0.13 -0.59 0.50 -0.51 -0.14 0.23 0.56
767
© EARSeL and Warsaw University, Warsaw 2005. Proceedings of 4th EARSeL Workshop on Imaging Spectroscopy. New quality in environmental studies. Zagajewski B., Sobczak M., Wrzesień M., (eds)
Figure 7: Plot with the spatial pattern of some variables derived by the Imspector; (a) GC_SSD@5cm2, (b) fraction of leaf clusters, (c) ground coverage and (d) relative values of leaf colour (reflection @ 600 nm / reflection @ 710 nm). UltraCam images After geometrically linking the Imspector Mobile measurements with the UltraCam images (see, e.g., Figure 5) for each plot a polygon matching the location of the Imspector measurements was defined. Table 4 summarizes the reflectances within the polygons of the four spectral bands. Also from these figures we must conclude that the variation between the plots is very limited for the blue, green and red spectral bands. Close study of the image further revealed that plot 20 was at the edge of a cloud shadow. Therefore, this plot was excluded from further analysis using the UltraCam data. Table 4: Summary statistics of the UltraCam spectral reflectances for the 19 plots of the grass/clover experiment (harvested on 30 July 2004).
Blue reflectance Green reflectance Red reflectance Near-infrared reflectance
Minimum 0.0206 0.0361 0.0212 0.5433
Maximum 0.0266 0.0416 0.0281 0.6909
Mean 0.0232 0.0386 0.0244 0.6084
Standard deviation 0.0019 0.0017 0.0022 0.0373
CV 0.08 0.04 0.09 0.06
N 19 19 19 19 768
© EARSeL and Warsaw University, Warsaw 2005. Proceedings of 4th EARSeL Workshop on Imaging Spectroscopy. New quality in environmental studies. Zagajewski B., Sobczak M., Wrzesień M., (eds)
Statistical models In Table 5 PLS models are presented for the fit of grassland charactistics versus two sets of Mobile Imspector variables. Table 5: Q2 and RMSECV values of the PLS models. Model Model 1: Y=observed X=3CCD, Model 2: Y=observed X=(3CCD V9 N17)
Biomass (t/ha) Q2 RMSECV 0.719 1.748
DM yield (kg/ha) Q2 RMSECV 0.504 342.6
DM content (%) Q2 RMSECV 0.596 0.688
N content (g/kg DM) Q2 RMSECV 0.063 1.161
0.381
0.269
0.189
0.084
2.596
416.1
0.975
1.148
The model that included only parameters derived from the 3CCD images was most accurate for biomass, DM yield and DM content. For N content none of the models performed satisfactory, which is probably due to low variability in the measured N content values. Including data from the V9 and N17 sensors resulted in lower Q2 and larger RMSECV values. This is most probably due to the small number of observations. The predicted values of model 1, obtained by leave-one-out, were now used as response variable to fit a multiple linear regression (MLR) model. By using the leave-one-out predictions, the observed value for each point is not used for fitting the model, hence ensuring independence. As the explanatory variables the average values of the blue, green, red and near-infrared pixels corresponding with the field plots at the geo-referenced positions were used. The results are shown in Table 6 and Figure 8. The Ultracam bands explain a reasonable proportion of the variability in observed biomass and DM yield, using the predicted values from the close sensing device as response variable. The direct fit of Ultracam variables on the observed values was only slightly better (R2) than the indirect fit through the prediction of the close sensing model (Q2). This gives confidence that an indirect method using a close-range sensing device can be used for calibrating remote sensing images with only limited loss of accuracy. The results can be applied to a whole image. The extrapolation to the whole grassland parcel is illustrated in Figure 9.
Table 6: Results for fitting the MLR model with the remote sensed data as explanatory variables and the predicted (leave-one-out) values of model 1 as the response variable. Q2 is here the percentage of variation of the original variable explained by this model, i.e. of the observed y and not of the response variable used in the model. In the second row a similar model was fitted, now using the observed variable as response variable. The hence obtained Q2 (=R2 in this case) is shown for correspondence. This is the maximum attainable percentage of variation that can be explained by a linear model. The RMSE is an estimate of the standard error. Model MLR X=(blue,green,red,NIR) Y=pred. from Model 1 Y=Original observations
Biomass Q2 RMSE 0.746 1.656 0.770 1.577
DM yield Q2 RMSE 0.647 288.1 0.675 276.1
DM content Q2 RMSE 0.552 0.733 0.577 0.712
N content Q2 RMSE 0.253 1.060 0.346 0.991
769
© EARSeL and Warsaw University, Warsaw 2005. Proceedings of 4th EARSeL Workshop on Imaging Spectroscopy. New quality in environmental studies. Zagajewski B., Sobczak M., Wrzesień M., (eds)
Biomass
DM yield
30
5000
Predicted DM yield (kg/ha)
Predicted Biomass (t/ha)
4500 25
20
15
4000
3500
3000
2500
10 10
15
20
25
2000 2000
30
Measured Biomass (t/ha)
2500
DM content
3500
4000
4500
5000
N content 34
Predicted N content (g/kg DM)
23
Predicted DM content (%)
3000
Measured DM yield (kg/ha)
21
19
17
15
32
30
28
26 15
17
19
21
Measured DM content (%)
23
26
28
30
32
34
Measured N content (g/kg DM)
Figure 8: Predicted versus observed values are shown for the four most important characteristics. The predicted values are obtained by fitting a MLR-model using the fitted leave-one-out data of Model 1 as response variable and the remote sensing data as the explanatory variables. The black line is the line y=x.
770
© EARSeL and Warsaw University, Warsaw 2005. Proceedings of 4th EARSeL Workshop on Imaging Spectroscopy. New quality in environmental studies. Zagajewski B., Sobczak M., Wrzesień M., (eds)
Figure 9: Spatial pattern of the predicted biomass (t/ha) for the grass/clover parcel at the Droevendaal experimental farm, Wageningen, the Netherlands. CONCLUSIONS The close-range sensing data, obtained by the Imspector Mobile, provide good estimates for biomass and DM yield and a reasonable estimate for DM content. This is due to a good estimate of ground cover, using the detailed information in the 3CCD camera. The content of the various nutrients like N were not estimated well in this experiment. This was due to the limited size of the dataset and the limited observed range, since no special treatment was imposed on the plots. Therefore the use of the spectrographs (V9, N17) in this experiment was limited. In other experiments these proved to be very useful for measuring nutrients like N [4, 6, 8]. We have shown that it is possible to predict biomass, DM yield and DM content from remote sensing data through an indirect fit of closely sensed data with the Imspector Mobile. This allows new ways for grassland management over large areas combining the fast, non-destructive measurements of close sensing devices with the remote sensing data. This opens new ways to precision agriculture and mapping of regional productivity, where fast, non-destructive and reasonably accurate close-range sensing measurements can be used for calibrating remote sensing information. The calibration of the Imspector Mobile is crucial for future application. It would be nice to see how robust prediction models perform that were calibrated with data from previous experiments. This may reduce the amount of required ground truth data even further. This is planned in future experiments. From a remote sensing point of view it will be interesting to investigate whether the use of more than the four spectral bands of the UltraCam camera can further improve the predictive power of the remote sensing data. As a next step it is planned to use airborne imaging spectrometry data for the extrapolation step. ACKNOWLEDGEMENTS We thank the ‘Scheppen van Ruimte’ programme for funding. We would like to acknowledge Aerodata for providing the UltraCam images and VEXCEL for providing the specifications and spectral sensitivities of the UltraCam camera.
771
© EARSeL and Warsaw University, Warsaw 2005. Proceedings of 4th EARSeL Workshop on Imaging Spectroscopy. New quality in environmental studies. Zagajewski B., Sobczak M., Wrzesień M., (eds)
REFERENCES 1.
Nosengo, N., 2003. Fertilized to death. Nature, 425: 894-895.
2.
Schut, A.G.T., 2003. Imaging spectroscopy for characterisation of grass swards. PhD Thesis, Wageningen University, Wageningen, 264 pp.
3.
Schut, A.G.T. and J.J.M.H. Ketelaars, 2003. Assessment of seasonal dry-matter yield and quality of grass swards with imaging spectroscopy. Grass and Forage Science, 58: 385396.
4.
Schut, A.G.T. and J.J.M.H. Ketelaars, 2003. Imaging spectroscopy for early detection of drought stress in grass swards. Netherlands Journal of Agricultural Science, 51: 319-337.
5.
Schut, A.G.T. and J.J.M.H. Ketelaars, 2003. Imaging spectroscopy for early detection of nitrogen deficiency in grass swards. Netherlands Journal of Agricultural Science, 51: 297317.
6.
Schut, A.G.T., C. Lokhorst, M.M.W.B. Hendriks, J.G. Kornet and G.J. Kasper, 2005. Potential of imaging spectroscopy as tool for pasture management. Grass and Forage Science, 60: 34-45.
7.
Molema, G.J., J. Meuleman, J.G. Kornet, S. A.G.T. and J.J.M.H. Ketelaars, 2003. A mobile imaging spectroscopy system as tool for crop characterization in agriculture. In: 4th European Conference on Precision Agriculture, edited by A. Werner and A. Jarfe (ECPA, Berlin) 499-500.
8.
Schut, A.G.T., M.M.W.B. Hendriks, F.K. Van Evert, I.E. Hoving, M.W.J. Stienezen, G. Holshof, G.J. Molema and J. Meuleman, 2004. Non-destructive assessment of dry matter yield, nutrient content and feeding value of grass swards with imaging spectroscopy. In: 7th International Conference on Precision Agriculture, edited by U.o. Minnesota (Minneapolis)
9.
Clevers, J.G.P.W. and R.E.E. Jongschaap, 2001. Imaging spectrometry for agricultural applications. In Imaging Spectrometry: Basic Principles and Prospective Applications, edited by F.D. Van der Meer and S.M. De Jong (Kluwer Academic Publishers: Dordrecht) 157-199.
10.
Beeri, O., R. Phillips, P. Carson and M. Liebig, 2005. Alternate satellite models for estimation of sugar beet residue nitrogen credit. Agriculture, Ecosystems & Environment, 107: 21-35.
11.
Van der Heijden, G.W.A.M. and C.A. Glasbey, 2003. Calibrating spectral images using penalized likelihood. Real-Time Imaging, 9: 231-236.
12.
Schiewe, J., 2005. Status and future perspectives of the application potential of digital airborne sensor systems. International Journal of Applied Earth Observation, 6: 215-228.
13.
VEXCEL, 2005. http://www.vexcel.com/products/photogram/ultracam/, 12-04-2005.
14.
Clevers, J.G.P.W., 1988. Multispectral aerial photography as a new method in agricultural field trial analysis. International Journal of Remote Sensing, 9: 319-332.
772