A Methodology for Edge Detection of Sobradinho Reservoir - BA, Brazil with SRTM and Aster Images Jhonathan Gomes dos Santos; João Rodrigues Tavares Junior Universidade Federal de Pernambuco - Pós-Graduação em Ciências Geodésicas e Tecnologias da Geoinformação- DECART- Av. Acadêmico Hélio Ramos, s/n - Cidade Universitária - CEP 50740-530 - Recife-PE – Brasil.
[email protected];
[email protected]
Abstract. This paper reports an investigation of methods of reservoir edge detection using Remote Sensing images in a study case of the reservoir’s edges of Sobradinho, Bahia, Brazil. The tests included LANDSAT-5 TM imagery, SRTM-DEM, SWBD edge of the SRTM and ASTER-VNIR-GDEM, The SRTM-NASA SWBD planimetry differ in the edge SRTM DEM and the edge B4. Altimetric profiles were developed between the edges of SRTMDEM and radiometric in B4 and it was found: low penetration of imaging the SRTM-DEM in the recesses of the edges of the reservoir, while the highest elevations of the terrain are more prominent than the lower slopes; the failure to observe the dates of the images used in ground cover masks as well as ignorance of the dynamics of the surface from the edge of the reservoir, used in data generation are the main causes of the discrepancies between the SRTM-SWBD (BWB) edge and edge by segmentation of the band 4 (B4). Keywords: Edge reservoir, Remote Sensing, segmentation, mathematical morphology, SRTM, ASTER.
1.
Introduction The use Remote Sensing images to identify edges of water bodies requires large studies using different images and different imaging methods for understanding the behavior of these spatial and spectral edges.
Edge detection of water bodies by remote sensing data has numerous applications, both in defining the coastline (YOO et al., 2004), the demarcation of coral reef (Yamano et al., 2006), plains tide (RYU, and MIN WON, 2002) or the extraction of contour lines of lakes and reservoirs (FRAZIER and PAGE 2000; LU et al., 2011). The present work is located around the reservoir Sobradinho in the state of Bahia, Brazil, which in turn is generated by a reservoir in the São Francisco river, the largest artificial lake in the world (CHESF, 2011), placed in a region of negative water balance and semi-arid climate, which influences the variation of the water depth and the volume of water stored. .One of the limitations of free images is to find optical images with dates consistent with the time of measurement of the water level in the reservoir margin. Whereas relief and water volume affect the shape of the edge of the reservoir.Using an MDE for detecting edges of water bodies due to the fact that the topography is who defines the geometry of the surface water bodies and therefore the knowledge of the geomorphological setting of the area surrounding the reservoir sobradinho. As relief is determining the geometry of the edge of water bodies was used in this study, digital elevation models, such as the ASTER GDEM and SRTM, the latter in particular, offers among the products the SWBD (SRTM Water Body Data) which consists of vectorization grid water bodies around the globe. In this study, we use software and images free download The study of edge detection reservoir Sobradinho - BA, with segmentation of Landsat TM band 4-5 (taken as reference) and MDE-relief SRTM allow us to analyze the spatial behavior of band 4 of Landsat TM-5 and draw comparisons with the edge of the SRTM-SWBD, SRTM and ASTER GDEM-VNIR. Generally in the infrared spectral range of 0.75 micrometers to 1000 micrometers, the spectral behavior of water is different from the type of soil exposed to outcrops of the basement, as is the case in the area of this study. In the range microwave imaging SAR (Synthetic Aperture Radar), the spectral characteristics of soil-water interface is very different from the infrared range, and also depends on the bandwidth used. The digital elevation model SRTM DEM-prepared C-band (5.21 m to 7.69 cm, 90 m spatial resolution) (Zhou et al., 2009; Rabus et al., 2003), is used in this work function access and free use of images, and for being a source of modeling terrain in 3-D.
The ASTER GDEM-VNIR-MDE generates through stereoscopic images of bands 3B (Back) and 3N (Nadir), whose spectral range is 0.76 micrometers to 0.86 micrometers, and has a spatial resolution of 30 m (ASTER, 2009). The necessity of using MDE this study is due to the topography delimit the area occupied by water in a basin part, and that the build up tends to maintain a surface configured for a same height level, and Therefore, it has on its edge one isoline altitude within a certain date or time interval. In the present work, the spectral behavior of the divide-soil water in the banda C-SRTM DEM will be studied in relation to sensor bands TM (Thematic Mapper) LANDSAT-5, which in turn generates free images with spatial resolution 30 m. In the band of 4 TM (near infrared - 0.760 micrometers to 0.900 micrometers) the contrast between water and soil generally is large, which allows the study of this interface. Suitable compositions of the TM bands, such that the composition shows the spectral response in the visible range of the sensor TM (R), 3 (G) 2, (B) 1 (Band 1, Blue, 0.450 micrometers to 0.520 micrometers; Band 2, Green, 0.520 micrometers - 0.600 micrometers; Band 3, Red, 0.630 micrometers - 0.690 micrometers), allows support to the results generated by visual interpretation of the features analyzed. The images VNIR (Visible and Infrared Nearest) ASTER GDEM-have-VNIR spectral response of visible and near infrared and are also free. Already bands 3B and 3N providing MDE, enable show the separation between water and soil and can-ASTER GDEM images-VNIR and TM Landsat-5 be used together to investigate the boundary between water and land. The combined use of TM-5, ASTER-GDEM MDE-SRTM and therefore allows studies on edge detection reservoir Sobradinho (including applying to other reservoirs).
2.
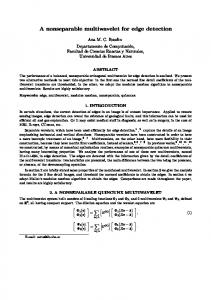
Study area The study area of this work is the edge of the reservoir hydroelectric Sobradinho, State of Bahia. It is the largest artificial lake in the world and is monitored by the São Francisco Hydroelectric Company (CHESF) (Fig 1). The reservoir is located in a region of the middle Rio São Francisco negative water balance, and geology sedimentary and crystalline basement shows, whose units exposed in geological and environmental CPRM (2006), are predominantly characteristics of land flattened.
Figure 1. Area of reservoir Sobradinho. Adapted from CPRM (2006).
The predominant vegetation is savanna. In Correia and Day (2003) and Dantas (2005) deals with physical characterization of reservoir Sobradinho, which has an area of 4214.3 km2 at its maximum elevation of 392.5 m operation with 280 km in length and varying width 5-50 km, while the minimum rate of operation is 380.5 m. The dimensions of the
reservoir Sobradinho allow the use of images of spatial resolution of 30 m to test the scale of 1:150000 on the best methods of edge detectors for images freely available.
3.
Methods, Results and Discussion Compatibility Data In this study we used data, images and free software. All processing steps were carried out in Sring software (System Information Processing Georrefenciadas) version 5.1.7, developed by INPE (National Institute for Space Research), available at: http://www.dpi.inpe.br/spring / Portuguese / download.php. The data used were from different remote sensors: Landsat TM 5, ASTER, SRTM. Therefore, it was necessary a temporal compatibility of data from SRTM DEM and ASTER GDEM-correct for the acquisition of Landsat TM 5, since the conditions of the surface of a reservoir has high dynamics. The mission SRTM consisted of a survey topography of the globe, through SAR interferometry, performed between 11 and 20 February 2000 (RABUS et al, 2003). Data provinientes ASTER, were purchased in the form of digital elevation model ASTER GDEM-, made from stereoscopy (ASTER, 2009) and images obtained at different times. For the acquisition of TM 5 images to be used in this work, data were considered monthly average surface elevation of the reservoir Sobradinho between 2000 and 2011, provided by CHESF (Hydroelectric Company of San Francisco). The quota was established as a standard in February 2000, due to the fact that the SRTM data are not available for any other times. In February 2000, the average monthly quota was 387.24 m, from this, we selected the months from January 2000 to December 2011 similar to possessing shares of 387.24 m (± 1 m). Given the size of the reservoir Sobradinho (4214.3 km²) and its location, it took 4 scenes TM sensor whose orbits/dots are shown in Table 1 below:
Orbit/Point
Acquisition data
217/66
29/08/2011
217/67
24/09/2009
218/66
26/05/2011
218/67
28/09/2010
Table 1. TM sensor scenes On the issue of availability of Landsat TM 5, as well as atmospheric conditions were considered in the analysis and processing carried out in this work only images whose Obita / point is 218/67, this, in turn, covers 79.2% of the surface the reservoir. The remaining images (217/66, 217/67 and 218/66) was used to compose the extension of the reservoir and not considered in the procedures performed in this study. In LANDSAT-5 TM sensor, band 4(Figure 1) corresponds to the near infrared (0.76 micrometers - 0.9 micrometers), it is observed a very low reflectance of clean water in this spectral range. This optical property of water allows differentiating water bodies clean in relation to other components such as bare soil and vegetation (NEW, 2008; JENSEN, 2009). However, Watanabe et al. (2010) cites that the spectral response of inland waters, such as reservoirs, is related to substances in the column of water bodies, and these elements, called optically active components, are responsible for the different spectral responses Water captured by the sensors. New (2001) classifies the components that affect the spectral characteristics of water in three different categories: living organisms, particulate matter and dissolved organic. For Jensen (2009) these sediments may come from a variety of sources, including the erosion of agricultural areas, the weathering of mountainous areas, coastal erosion caused by waves or natural vessel traffic and volcanic eruptions (ash). Miller and Mckee (2004) state that water bodies inland as well as coastal, can carry a considerable amount of suspended sediment that can dramatically affect the characteristics of their spectral reflectance. Doxaran, Froidefond and Castaing (2002) studied the correlation between reflectance and suspended sediment in coastal waters (phytoplankton, dissolved organic matter and mineral particles) and Karaska et al. (2004) conducted a study on the reflectance of suspended matter in river water by analyzing factors such as turbidity and chlorophyll, among others. Both showed that these sediments are to be
considered in detecting edge lines due to the spectral response of the same. The use of images derived from remote sensors requires, in many cases, the correction of errors inherent to image acquisition. The atmospheric conditions directly influence the quality of images obtained by the sensors, so it is necessary corrections atmospheric calls, which second Vermote (1997), is a process which, ideally, is to eliminate the interference of air in the image. Among the methods used to perform this type of correction, enconta is the method called DOS (Dark Object Subtraction) developed by Chaves (1989), which in turn was implemented in this study using the methodology proposed by Gütler et al (2005). Another type of correction to be performed in remote sensing images is the radiometric correction, which consists of me convert values Digital Number (DN), levels of ash disposed in each pixel of the image in reflectance values, which is a physical quantity inherent the natural targets, requires complex processing algorithms with input parameters and specific atmospheric conditions and sensor (MENESES and ALMEIDA, 2012). The scenes TM, Landsat 5, used in this study were submitted to the above corrections to the following methodological steps. Figure 1 shows the mosaic of images corrected TM used on the reservoir area.
Figure 2. Mosaic TM image, band 4 (near infrared), and the region of the reservoir Sobradinho.
SRTM DEM The Digital Elevation Model (DEM) SRTM (Shuttle Radar Topographic Mission) is a three dimensional representation of the earth, obtained by interferometry using a Synthetic Aperture Radar or SAR (Synthetic Aperture Radar) (RODRIGUEZ, BELZ and MORRIS, 2006). The range of the electromagnetic spectrum used for the generation of MDE SRTM, corresponding to the C band, i.e. radiation whose wavelength is located in the range between 3.75 and 7.5 cm. In this spectral range, according to Slater et al (2006), the radar signal shows very low values or do not return values on water bodies, resulting in black areas or regions "empty" (voids). The water in SAR images, affects the dielectric constant of the surface, and thus its back-scattering coefficient (NEW, 2006), causing flooded regions behave differently from dry soil. Works such as Guth (2006), Farr et al. (2007) and Grohmann, Ricocomini and Steiner (2008), claim that problems involving low-slope areas are related to the inherent noise-SRTM DEM and disability reflection of radar signals in water bodies and wetlands. Rodriguez, Morris and Belz (2006) lists several sources of error in the data-SRTM DEM, among them, to attribute these noises linear static calibration errors InSAR system, resulting in a remarkable observation of banding. SRTM Water Body Data (SWBD) Slater et al. (2006) describe editing a product, among others, very significant about the SRTM data: the SRTM Water Body Data (SWBD). This is a set of data obtained from the DEM SRTM level 2, that is, with a spatial resolution of 30 m, and edited for each block files available in the extension SHP (ESRI, 1998), which provide a vector representation Line edge of water bodies. Editing products is further supported by the letters digitaliazadas pertencentea Geospatial-Intelligence Agency of the United States (NGA - National Geospatial Intelligence Agency), as well as masks cover crops obtained by the Landsat 5 TM sensor derived data whose acquisition dates ranging from late 1980 to 1993. The planimetric accuracy of these data was specified at 50 m (mean square error), but based on the evaluation of NASA (National Aeronautics and Space Administration) the error may be less of 19 m at 25 m. As regards the waters, lakes considered with length greater than or equal to 600 m (lakes length less than 600 m were not mapped) as specifications of NIMA (2001), as is the case in reservoir Sobradinho.
ASTER GDEM Digital Elevation Model obtained by the stereoscopic ASTER band 3, corresponding to the near infrared (0.78 to 0.86 micrometers), as Hirano, Welch and Lang (2003). Due to the nature of the process of obtaining this MDE along ponds occur some of the worst-visual anomalies in ASTER GDEM second Guth (2006). According ASTER (2009), among the major errors and anomalies inherent in the ASTER GDEM-VNIR-stand out: the anomaly and the effect of step mole. In generating the MOU by stereoscopic model is obtained from images obtained from the same location from different angles. This technique, in the case of ASTER-GDEM-VNIR may differ in altimetry altitude values located on the edge of each scene used for making the MDE, resulting in linear features along the boundaries of the scenes constituting the model. In water bodies where the level surface behaves dynamically, there are naturally differences in level between scenes captured in different moments. ASTER GDEM-in-VNIR these differences are called anomalies or stair step anomalies, and appear when the images are overlaid to generate the respective model. These anomalies may represent, for ASTER-GDEM, a discontinuity or altimetric dislocation presented by the relief pattern, resembling the one shearing surface. The call path mole effect is described in ASTER (2009) as an anomaly overlapping scenes used in the model but unlike anomalies step, not only show the limits of captured scenes. The occurrence of this effect is due to superposition of multiple scenes where, for example, the reflectance of elements existing on the surface of a body of water captured by the sensor, resulting in a malfunction of curvilinear shape. Image Segmentation TM About the corrected images of the band 4 of TM sensor onboard the satellite Landsat 5 was applied to image segmentation operation that, according to Gonzalez and Woods (2010) and Guimarães and Candeias (2009), subdivides an image into its parts or objects constituents. The segmentation process according Brites, Bias and Santa Rosa (2012), makes the environment in which is inserted the pixel is considered in the classification, that is, takes into account the characteristics of the medium (regions) and not exclusively the spectral values of the pixels. This work was performed the operation targeting growth regions grouping pixels into regions or sub-regions, based on thresholds of similarity
between the image pixels, which in this case is based on the values of reflectance image TM band 4. After the corrections of images of the band 4 sensor TM, tests were performed in order to estimate values for the parameter of similarity. Therefore, observations were made of values of gray levels, corresponding to the reflectance of the scene targets, demonstrating pixels that match the specified range of values of gray levels (reflectance). Figure 3 shows a slicing radiometric, or a color picture is divided into 10 gray levels (reflectance) and the upper and lower limits of this slicing, 0 and 255, respectively.
Figure 3. Slicing radiometric Mosaic TM image, band 4 (near infrared), the region of the reservoir Sobradinho.
It can be seen in Figure 3 that the flooded area of the reservoir is represented predominantly in blue tones corresponding to the lowest levels of reflectance. The next step was to identify the threshold reflectance of the flooded area belonging to the reservoir. For this purpose, we conducted a search for a value visually presenting the whole area of the reservoir Sobradinho, which in turn, due to the dynamics and dimensions, has reflectance values higher than those expected for pure water due to the presence of elements optically assets.
Figure 4 shows the band 4 of Landsat TM 5 of the southwest region of the shell, enlarged chosen to be performed with the slicing radiometric reflectance values corresponding to 50 and 60.
(a) Band 4
(b) 0 -50
(c) 0 - 60
Figure 4. - Band 4 of Landsat TM 5 of the southwest region and the slicing radiometric reflectance values corresponding to 50 and 60. Figure 4(a) presents the complexity of defining a border line through the spectral gradient found in the selected area: the pixels in darker shades correspond to predominantly wetlands, but some areas near the banks of the reservoir, the region shown in this figure, hamper the interpretation of the image. Note also the presence of shadow clouds represented similarly in dark tones. Figure 4(b) shows the slicing radiometric selected area whose threshold is 50, where it can be seen that for most of the shell in this area there is a match of pixels evidenced by slicing 0 to 50, and wetlands region . Figure 4(c) presents the occurrences of pixels evidenced by slicing radiometric 0-60, which in turn correspond to shadows caused predominantly by the relief. Slicing Radiometric Model of ASTER GDEM The model ASTER-GDEM-VNIR region of the reservoir Sobradinho was mosaicado from six images derived from the band 3 (3B and 3N) shown in Table 2. From Mosaic ASTER GDEM-one was generated shadow image, which in turn is shown in Figure 7 whose extension displays the abnormalities on water bodies described in ASTER (2009) with the elevation altitude areas (in red).
Image
Latitude
Longitude
ASTGTM_S10W041_dem
10° S
41° W
ASTGTM_S10W042_dem
10° S
42° W
ASTGTM_S10W043_dem
10° S
43° W
ASTGTM_S11W041_dem
11° S
41° W
ASTGTM_S11W042_dem
11° S
42° W
ASTGTM_S11W043_dem
11° S
43° W
Table 2. ASTER GDEM- images used Figure 5 presents the product of slicing altimetric model ASTER GDEMVNIR-with the altitude values of 380.5 m, 392.5 m (maximum and minimum quota of operation provided by CHESF Dam, respectively) and 387.24 m (average value for the month of February 2000). This slicing was performed in order to assess the possibility of using ASTERGDEM-VNIR for slicing of altimetric coordinates above the reservoir, but the fragmentation along the slicing of the model precludes their use for this purpose sought this work. Figure 6 presents a zoom of ASTER GDEM-VNIR-with quotas in red. In Figure 7, we have showed the slicing and edge altimetric to the ASTER GDEM image.
Figure 5. Mosaic of images from the ASTER GDEM-(shaded).
Figure 6. Zoom of ASTER GDEM-VNIR-with quotas in red
Slicing altimetric of ASTER-GDEM
slicing edge of altimetric of ASTERGDEM
Figure 7. ASTER GDEM It is observed from the detail shown that difference in the surface elevation of the reservoir provided by the Model ASTER GDEM reaches 14 meters, and the presence of defects inherent in the model, thus it is not possible to consider the edge generated by slicing altimetric reservoir Sobradinho ..
The SRTM data Slicing Radiometric the SRTM DEM The SRTM DEM, available as an image in gray levels, was obtained by the Mosaic of 4 images, presented by naming the articulation index compatible with the scale 1:250000 Brazilian Institute of Geography and Statistics (IBGE). The mosaic of images, SRTM DEM is shown in Figure 8.
Figure 8. Mosaic SRTM DEM, Sobradinho Reservoir region, Bahia. The DEM-SRTM was submitted in SPRING, a slicing altimetry, ie the pixels were selected this model based on the same altitude intervals, thereby slicing altimeter showed regions where the altitude is less than or equal to the quota reservoir level Sobradinho courtesy CHESF for the period of the mission SRTM, ie 387.27 m. Figure 22 shows the product of altimetric slicing into three levels of altitude: 380.5 m, 392.5 m 387.5 me, representing the minimum operating Sobradinho dam, the value of
average monthly quota of February 2000, and the value of the maximum level of operation of the dam, respectively. Figure 9 shows the product slicing of altimetric model at elevation 387.24 meters.
Slicing altimetric of SRTM DEM Slicing altimetric of SRTM DEM in with 387.24 m three levels Figure 9. Slicing altimetric of SRTM DEM. SRTM Water Body Data The SRTM mission data used are from the SRTM-DEM with a spatial resolution of 90 meters, and a major product generated by the processing of your data, SWBD, which in turn consists of vectorization of water bodies available in SHP extension. These data provided two distinct edges, which will be considered below. The SRTM-files SWBD, characterized by itself on a ledge validated by NGA (National Geospatial Intelligence Agency), identified in this work as BWB edge. For this mosaic four files were available in Shapefile format, as shown in Table 3. Figure 10 shows the mosaic obtained by the edge of Shapefile ® SWBD called this work, BWB.
Arquivo
Latitude
Longitude
W041s10s.shp
41° W
10° S
W042s10s.shp 42° W
10° S
W043s10s.shp 43° W
10° S
W043s11s.shp
11° S
44° W
Table 3. SRTM – Files used SWBD
Figure 10. Edge vectored from SRTM, called BWB.
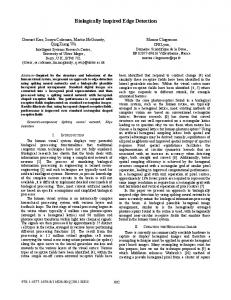
(a)
Profile of 13: Distance X Altimetry value (c)
(b)
Profile of 13: Distance X Reflectance (d)
Figure 11. Result to BWB and B4.
The area 13 (Figure 11(a) ), which in turn presents one of the points where the edges overlap B4 and BWD. The area is enlarged in Figure 11 (b). The line profile considered for the area in question has a length of 659 m, whose center is marked by the point of coincidence between the edg-
es and B4 BWB. The altitude recorded at the point where the edges overlap is 390 m; highest altitude recorded along the line profile is 398.66 m and the lowest recorded elevation is 388.17, the average slope measured under the profile line is 2, 77%, as can be seen in Figure (c). Regarding the radiometric profile (Fig. 11 (d)) we have: a reflectance at the point of coincidence between edges is 153.16, the highest and lowest reflectance observed along the profile line are respectively 254 and 19 7, the average observed reflectance is 116.01. The profiles generated and presented in Figures 11(c) and 11(d) show no relationship between topography and the reflectance of the targets in the scene as a reason convergence or divergence between edges, revealing the heterogeneity present in the behavior of the edge BWB in all excerpts considered. The topographic profile in question presents with serrated area covered by water, it is possible to observe an elevation in the region of the second half of the profile can not be observed in Figure (b), which suggests that it is an error coming from the sensor system used to generate the SRTM DEM. In radiometric profile observed that the points of coincidence between the edges, the reflectance is 153.16, however, this value decays intensely along the profile reaching the value of 19.7 at the end of the line profile, or in wetlands.
4.
Conclusion and Recommendation Several experiments were done to find the most accurate edge detection reservoir Sobradinho - BA, testing the use of MDE-SRTM, ASTER GDEM-VNIR-operators, Mathematical Morphology, SRTM-edge SWBD, and segmentation of the band 4 of Landsat TM 5. The methodological research conducted here indicates that the segmentation of Landsat TM band 4-5 is the most appropriate method for edge detection of tank Sobradinho - BA in scale 1:150000. The ASTER GDEM-VNIR-are not suitable for edge detection by which images are formed by mosaics of images with MDE implying different times at different water levels, which would result in discontinuous edges. Another reason that makes it impossible to use the model ASTER GDEM-VNIR-generation edge reservoir are anomalies encountered in obtaining this model due to the method used for their generation: stereoscopy. The recommendation of Guth (2010) on the overlap of the ASTER GDEM-by-VNIR data SWBD is not suitable for cartographic products, as inconsistencies in the SRTM Water Body Data (SWBD) make these data unreliable when it requires cartographic accuracy even for large scales of 1:150,000 with.
One problem with use of edge MDE-SRTM is that the water generates noise in band C, and the line edge is very irregular and incomplete, but the use of these noises can be considered as parameters to generate surfaces altitude consistent with surface water bodies. It is recommended the application of mathematical morphology techniques to other imaging radars, like the TerraSAR-X. It is recommended, though, that for systems design InSAR sensors are taken into account to adjust the acquisition geometry for mapping complex edges of water bodies inland or coastal regions. The model SRTM-SWBD showed no consistency regarding the position and orientation of the edge B4 TM Landsat-5, not getting clear procedures and algorithms used in the methodology NASA / NGA. The fact that they have been observed where the edge BWB showed up sometimes internal and sometimes external to the edge B4, demonstrates the inconsistency product SRTM-SWBD, as if getting the lines edges of water bodies say about the different times, and therefore different levels of surface reservoir Sobradinho, should always be present whenever external or external, with occasional coincidences between the edges in places where the slope is high. The use of masks cover crops, used in making data SWBD, did not take into account the varying levels of the reservoir Sobradinho during the SRTM mission accomplishment, thereby compromising the quality of data available. As a recommendation the use of high spatial resolution QuickBird and GeoEye like the segmentation of band on the infrared as well as points of field control for the water level, is an important continuation of this research. The use of images acquired by sensors of high temporal resolution to add edge detection reservoir more accurately mapping, thereby capturing images with minor changes in surface level.
References ASTER GDEM Validation Team: ASTER Global DEM Validation – Summary Report, METI & NASA, 28 p., 2009. BRITES, R. S.; BIAS, E. S.; SANTA ROSA, A. N. de C. Classificação por regiões. In: Paulo Roberto Meneses, Tati de Almeida. (org.) Introdução ao Processamento de Imagens de Sensoriamento Remoto. Editora UNB. Brasília, 2012. CHAVEZ Jr., P.S. Radiometric calibration of Landsat Thematic Mapper multispectral images. Photogrammetric Engineering and Remote Sensing, Bethesda, v.55, p.1285-1294, 1989.
CHESF - Companhia Hidroelétrica do São Francisco. Disponível em: Acesso: setembro de 2011. CORREIA, M. de F., DIAS, M. A. F. da. Variação do nível do reservatório de Sobradinho e seu impacto sobre o clima da região. Revista Brasileira de Recursos Hídricos. V.8, n.1, jan/mar de 2003, p.157-168. CPRM – Serviço Geológico do Brasil. Mapa de Geodiversidade do Estado da Bahia. 2006. DANTAS, C. E. de O. Análise dos efeitos dinâmicos em reservatórios de grande extensão: estudo de caso: reservatório de Sobradinho. Dissertação de Mestrado. Recife. 2005. Pós-graduação em Engenharia Civil. 72p DOXARAN, D.; FROIDEFOND, J. M.; CASTAING, P. A reflectance band ratio used to estimate suspended matter concentrations in coastal sediment-dominated waters, International Journal of Remote Sensing. V. 23, p. 5079 – 5085, 2002. ESRI – EARTH SCIENCES AND RESOURCES INSTITUTE, 1998. ESRI Shapefile Technical Description. Disponível em: < http://www.esri.com/library/whitepapers/pdfs/shapefile.pdf >. Acesso em: junho de 2012. FARR, T.; ROSEN, P. A.; CLARO, E.; CRIPPEN, R.; DUREN, R.; HENSLEY, S; KOBRICK, M; PALLER, M.; RODRIGUEZ, E.; ROTH, L.; SEAL, D.; SHAFFER, S.; SHIMADA, J.; UMLAND, J; WERNWER, M.; OSKIN, M.; BURBANK, D.; ALSDORF, D. The Shuttle Radar Topography Mission. Reviews of Geophysics, v. 45, 33 p., 2007. FRAZIER, P. S; PAGE K. J. Water body detection and delineation with Landsat T M data. Photogrammetric Engineering & Remote Sensing, v. 66, n. 12, p. 1461– 1467, 2000. GONZALEZ, R. C.; WOODS, R. E. Processamento de Imagens Digitais. São Paulo: Editora Pearson Prentice Hall, 624 p., 2010. GROHMAN, C. H.; RICOCOMINI, C.; STEINER, S. S. Aplicações dos modelos de elevação SRTM em geomorfologia. Revista Geografia. Acadêmica, v.2, n.2, p. 7383, 2008. GUIMARÃES, L. M. e CANDEIAS, A. L. B. Utilização de técnicas de processamento de imagens digitais para definição de contorno de reservatórios. XIV Simpósio Brasileiro de Sensoriamento Remoto, Natal, Brasil, p. 6927-6934, INPE, 25-30 abril 2009. GÜRTLER, S.; EPIPHANIO, J. C. N.; LUIZ, A. J. B.; FORMAGGIO, A. R. Planilha eletrônica para o cálculo da reflectância em imagens TM e ETM+ Landsat. Revista Brasileira de Cartografia, v. 57 n.02, p.162-167, 2005. GUTH, P.L., Geomorphometry from SRTM: Comparison to NED, Photogramm. Photogrammetric Engineering & Remote Sensing, v. 72, p. 269-277, 2006.
HIRANO, A, WELCH, R. and LANG, H. Mapping from ASTER stereo image data: DEM validation and accuracy assessment. ISPRS Journal of Photogrammetry & Remote Sensing, v. 57, p. 356 – 370, 2003. JENSEN, J. R. Sensoriamento Remoto do Ambiente: Uma perspectiva em Recursos Terrestres. Ed Parêntesis, 672 p., 2009. KARASKA, M. A., R. L. HUGUENIN, J. L. BEACHAM, M. WANG, J. R. JENSEN,and R. S. KAUFMANN. AVIRIS measurements of chlorophyll, suspended minerals, dissolved organic carbon, and turbidity in the Neuse River, North Carolina. Photogrammetric Engineering & Remote Sensing, v. 70, n. 1., p. 125–133, 2004. LU, S., WU, B., YAN, N. AND WANG, H. Water body mapping method with HJ1A/B satellite imagery. International Journal of Applied Earth Observation and Geoinformation, v. 13, n.1, p. 428–434, 2011. MENESES, P. R.; ALMEIDA, T. Distorções e correções dos dados da imagem. In: Paulo Roberto Meneses, Tati de Almeida. (org.) Introdução ao Processamento de Imagens de Sensoriamento Remoto. Editora UNB. Brasília, 2012. MILLER, R. L. and MCKEE, B. A. . Using MODIS Terra 250m imagery to map concentrations of total suspended matter in coastal waters. Remote Sensing of Environment, v. 93, n. 1, p. 259-266, 2004. NIMA – NATIONAL IMAGERY AND MAPPING AGENCY, 2000. Performance Specification, Digital Terrain Elevation Data (DTED®), MIL-PRF-89020B, maio de 2000. NOVO, E. M. L. de. Sensoriamento Remoto. Princípios e aplicações. 3ª. Edição revista e ampliada. São Paulo. Editora Edgard Blucher. 363p. 2008. NOVO, E. M. L. M. Bases teóricas para o uso de imagens SAR no estudo de áreas alagadas. Anais 1º Simpósio de Geotecnologias no Pantanal, Campo Grande, Brasil, Embrapa Informática Agropecuária/INPE, p.883-894, 11-15 novembro 2006. NOVO, E. M. L. M. Comportamento Espectral da Água. In: MENESES, P. R.; MADEIRA NETTO, J. das S. (Orgs.) Sensoriamento Remoto: Reflectância de Alvos Naturais. Brasília: UnB, Embrapa Cerrados, p 203-222, 2001. RABUS, B.; EINEDER; M.; ROTH, R.; BAMLER, R. The Shuttle Radar Topography Mission — a new class of digital elevation models acquired by spaceborne radar. ISPRS Journal of Photogrammetry & Remote Sensing, v.57, p.241-262, 2003. RODRÍGUEZ, E., MORRIS, C. S.; BELZ, J. E. A global assessment of the SRTM performance, Photogrammetric Engineering & Remote Sensing, v.72, p 249 – 260, 2006. RYU , J. , WON J, and MIN, K. D. Waterline extraction from landsat TM data in a tidal flat. A casestudy in Gomso bay, Korea. Technical Report Series Department of Geography & Antropology Lousiana State University, v.83, p. 442-456, 2002. SLATER, J.A., GARVEY, G., JOHNSTON, C., HAASE, J., HEADY, B., KROENUNG, G. and LITTLE, J. The SRTM Data “Finishing” Process and Products. Photogrammetric Engineering & Remote Sensing, v.73, n.3, p. 237-247, 2006.
VERMOTE, E.F. Second Simulation of the Satellite Signal in the Solar Spectrum, 6S: an overview. IEEE Transactions on Geoscience and Remote Sensing, New York, v. 35, n.3, p. 675-686, 1997. WATANABE, F. S. Y. ; IMAI, N. N. ; BARBOSA, C. C. F. ; ARAÚJO, A. P. Avaliação do comportamento espectral da água: estudo de caso do alto curso do rio paraná (Presidente Epitácio SP). In: III Simpósio Brasileiro de Ciências Geodésicas e Tecnologicas da Geoinformação, 2010, Recife-PE. A informação Geoesoacial: Inovação Tecnológica, Ocupação e Monitoramento, p. 1-8, 2010. YAMANO, H., SHIMAZAKI, H., MATSUNAGA, T., ISHODA, A., MCCLENNEN, C., YOKOKI, H., FUJITA, K., OSAWA, Y. and KAYANNE, H. Evaluation of various satellite sensors for waterline extraction in a coral reef environment: Majuro Atoll, Marshall Islands. Geomorphology, v.82, p. 398–411, 2006. YOO, H., RYU, J., BAE, I., AHN , Y. A study on sedimentary environments by remotely sensed data in the southern tidal of Kangwa island, Korea. Gayana, v.68, n.2, 2004.
ZHOU, X., CHANG, N-B, LI, S. Applications of SAR interferometry in Earth and environmental science research. Sensors, v.9, p. 1976-1912, 2009.