A Methodology for Evaluating the Technological Maturity of Micro and Nano Fabrication Processes Emmanuel Brousseau, Richard Barton, Stefan Dimov, Samuel Bigot
To cite this version: Emmanuel Brousseau, Richard Barton, Stefan Dimov, Samuel Bigot. A Methodology for Evaluating the Technological Maturity of Micro and Nano Fabrication Processes. Svetan Ratchev. Precision Assembly Technologies and Systems, 315, Springer, pp.329-336, 2010, IFIP Advances in Information and Communication Technology, 978-3-642-11597-4. .
HAL Id: hal-01055668 https://hal.inria.fr/hal-01055668 Submitted on 13 Aug 2014
HAL is a multi-disciplinary open access archive for the deposit and dissemination of scientific research documents, whether they are published or not. The documents may come from teaching and research institutions in France or abroad, or from public or private research centers.
L’archive ouverte pluridisciplinaire HAL, est destin´ee au d´epˆot et `a la diffusion de documents scientifiques de niveau recherche, publi´es ou non, ´emanant des ´etablissements d’enseignement et de recherche fran¸cais ou ´etrangers, des laboratoires publics ou priv´es.
A Methodology for Evaluating the Technological Maturity of Micro and Nano Fabrication Processes Emmanuel Brousseau1, Richard Barton2, Stefan Dimov1, Samuel Bigot1 1
Manufacturing Engineering Centre, Cardiff University, Cardiff CF24 3AA, UK 2 Cardiff Business School, Cardiff University, Cardiff CF10 3EU, UK {
[email protected]}
Abstract. Given that Micro and Nano Technologies (MNTs) is still an emerging field, it is important to adopt a tool for evaluating the maturity of MNT-based products and the production processes enabling their manufacture. In particular, as a risk assessment tool, it could help both the pace of technological adoption and the successful exploitation of these technologies. In this context, the objective of the research presented is to describe a methodology for assessing the maturity of MNTs. The paper also demonstrates the implementation of this methodology for a set of micro and nano manufacturing processes employed for tooling and replication. It could also be easily implemented to evaluate the maturity of other production processes for MNT-based products such as micro assembly technologies. The reported study was conducted in collaboration with two networks funded through the Sixth Framework Programme (FP6) of the European Commission (EC), namely the Multi-Material Micro Manufacture (4M) Network of Excellence (NoE) and the µSAPIENT Coordination Action (CA). By analysing data from R&D projects carried out in the field of MNTs by partner organisations in these two consortia, the maturity phases targeted by each project could be evaluated and as a result, the maturity profiles for given technologies could be extracted. An important output of this study is to help inform the industry, the global research community and policy makers about the current level of maturity reached by the MNTs which are developed in R&D projects carried out at European level and in particular, within the 4M NoE and the µSAPIENT CA. Keywords: technology maturity assessment, micro manufacturing, nano manufacturing, micro and nano technologies
1 Introduction Despite the recognised benefits that result from technology standardisation, whether directed at products or production processes, very little attention has been paid to propose methods for evaluating technological maturity consistently between organisations. Perhaps the most popular concept for performing such a maturity assessment is the Technology Readiness Level (TRL). This concept and the associated TRL scale were developed in the 1980s by the National Aeronautics and Space Administration (NASA) and further adopted in the 1990s by the United States
Air Force [1]. It is a measure to assess the maturity of an evolving technology such as materials, components or devices, prior to incorporating it into a system or subsystem. Although the TRL evaluation method is well suited to the assessment of proprietary technologies developed by a single organization, it cannot be easily applied for obtaining a global picture of the maturity of technologies developed in parallel by different organisations as it is the case with MNTs. Thus, the objectives of this paper are to present an alternative methodology that would simplify the evaluation of technological maturity by different organisations and to apply this methodology in the context of MNTs. The motivation behind this research was also to obtain a picture at the European level of the distribution of the research efforts on MNTs along a technology maturity scale. Thus, it was anticipated that this study would help inform European and national funding bodies, the research community and the industry about the maturity of such technologies. The paper is organised as follows. The next section presents the proposed methodology and describes its application in the context of MNTs. Then, the following section illustrates the maturity assessments results when this method has been applied to evaluate a set of micro and nano manufacturing processes belonging to the technological scope of the 4M NoE and the µSAPIENT CA. Finally, the generic findings of this study are presented to conclude the paper.
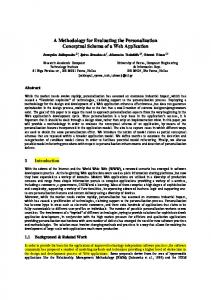
2 Methodology The methodology employed in this study is illustrated in Fig. 1. It relies on identifying a portfolio of R&D projects in a given technological domain in order to have access to a rich and validated knowledge repository. The attractive characteristics of such an approach are that: • The projects accessed are funded on a competitive base by regional, national and EC programmes that reflect specific industrial requirements and also the outcomes of roadmapping and foresight studies; • The projects are also peer reviewed by experts that concur with the current status and targeted advances in key technology development areas that are stated in the project proposals; • The projects involve consortia of industry and R&D partners that are specialists in their fields and have agreed a joint R&D programme. In this research, a portfolio of MNTs-based R&D projects that involve partners in the EC FP6 funded 4M NoE and µSAPIENT CA was used to apply the proposed methodology. In total, these two networks bring together 40 R&D organisations spread over 17 different European member states. This portfolio comprised more than 300 projects which have commenced or have been completed over the last 5 years with European, national or institutional funding. The study is an attempt to position each of these research projects on a technology maturity scale in order to obtain a picture of the distribution of the MNTs R&D efforts across Europe. To carry out this analysis, five consecutive steps illustrated in Fig. 1 and described in the following sub-sections were identified.
Fig. 1. Methodology for technology maturity assessment. 2.1 Definition of a Technology Maturity Scale The maturity scale used was inspired by the TRL scale which is composed of 9 levels grouped into 6 transition phases [1]. However, this scale had to be adapted to the context of this study as it did not describe appropriately the maturity levels of MNTs. For this reason, the TRL concept was presented to 4M and µSAPIENT partners in order to obtain their view on a maturity scale that could be applicable in the context of MNTs. This was done during a workshop that sought the input of thirty 4M and µSAPIENT experts. This workshop took place on the 14th February 2008 at the Fraunhofer Institut für Zuverlaessigkeit und Mikrointegration (IZM) in Munich. In particular, the participants were split into three groups, which were given the same questions throughout the workshop. However, each group was asked to provide answers in the context of particular R&D projects. More specifically, the first group had to give its input with respect to projects targeting the development of micro and nano manufacturing technologies. The second group concentrated on R&D projects that are focused on applying MNTs in different application areas. Finally, the remit of the third group was to provide input in the context of projects targeting both manufacturing technologies and application developments. Each group was presented with the 6 transition phases of the TRL scale. Then, after an initial discussion they were asked to refine those phases taking into account the scope of the R&D work targeted and/or conducted in the context of their MNT projects. By combining the answers of the three groups, a common scale composed of the following seven “maturity phases” of technology development was identified: - Phase 1: Basic technology research - Phase 2: Feasibility study - Phase 3: Technology development - Phase 4: Technology demonstration
- Phase 5: System development/integration - Phase 6: Integration in a production environment and validation - Phase 7: Mass production/Serial production 2.2 Identification of Maturity Indicators During this workshop, a Delphi-type study was also conducted in order to identify key indicators for each maturity phase. Thus, generic indicators in the form of project motivations and activities typically associated with specific technology development phases were obtained. For example, a key indicator identified as a possible motivation for setting up an R&D project was “new material to be developed”. In particular, this was considered by the workshop participants as a key indicator belonging to the phase 1 of technology development: “Basic technology research”. In addition, the importance of these indicators for each maturity phase was also weighted by the workshop attendees.
2.3 Questionnaire Design The identified indicators were then used to develop a questionnaire the output of which would allow R&D projects to be positioned objectively on the maturity scale, without taking into account the application specific R&D issues addressed by them. In particular, its purpose was to present simple questions to researchers with respect to the motivations behind setting up an R&D project and the generic activities carried out within the project. At the same time, the answers to these questions were linked to the maturity indicators and thus, the maturity phases addressed by a project could be extracted automatically. In order to collect the responses to the designed survey, a self-administered on-line questionnaire was preferred to other techniques such as semi-structured interviews for the following reasons: • The identification of the maturity indicators during the workshop meant that the use of open-ended questions would be limited; • The size of the targeted respondents was relatively large and geographically dispersed. To design the questionnaire and come up with the necessary questions, a data requirement table was built as recommended in [2]. This ensured that the data collected would provide sufficient information to meet the aims of the survey. 2.4 Administration of the Questionnaire For maximising the reliability of the responses, it was decided, whenever possible, to get the questionnaire completed directly by the individual researchers responsible for carrying out the work for each project considered in the survey. For this reason, the
name and contact details of researchers associated with each project was obtained from the organisations taking part in the study. In order to validate the questionnaire, a pilot survey was carried out with five researchers at the Cardiff University Manufacturing Engineering Centre. This sample was chosen because it represented a population with a similar profile to that expected to take part in the survey. As a result of this pilot study, a number of questions were modified in order to clarify their meaning and thus to avoid any confusion in their interpretation. Then, the final questionnaire was launched online on 13th June 2008 at the following address: http://www.surveys.cardiff.ac.uk/maturitymnt. 2.5 Analysis of the Results In order to evaluate the maturity of the R&D projects from the data collected with the questionnaire, the use of maturity profiles was preferred to the calculation of single maturity value as it would be the case with the TRL concept. More specifically, a technology assessed with TRL is considered to have reached one particular level along the TRL scale. Instead, in the context of this study, a profile was chosen to represent the results of the maturity assessment because it provides a more realistic “snap shot” of current status of MNTs than that obtained with a single maturity value. For example, the micro milling technology is currently being exploited commercially by mould and watch making industries. At the same time, the research community recognises that further fundamental investigations are also needed to understand and especially to model the mechanics of mechanical machining at the micro scale [3]. In this case, the output of the maturity assessment method employed should result in a profile capturing the fact that micro milling is a technology for which R&D efforts span a broad spectrum of maturity phases. Based on the responses received from the questionnaire, a maturity profile was constructed for each project. For example, one of the questions asked the respondents to select the main motivations/triggers to start an R&D project from the list of identified maturity indicators. If a given survey participant selected “new material to be developed”, which was classified as a phase 1 indicator (see section 2.2), then based on the weight of this indicator, a particular score would be assigned for phase 1 for this project. Any other phase 1 indicators selected by this survey respondent would increase the score for this phase. Another question consisted in asking what were the essential tasks required to achieve the project objectives, again from the list of identified indicators. In this case, the same scoring procedure was applied to extract the scores for each maturity phase. Finally, during the analysis of the survey results for a particular project, the total score achieved for each phase was divided by the sum of the scores for all phases. This allowed expressing the score obtained for each phase as a percentage of that for all phases. Thus, the maturity associated with each project could be presented as a profile displaying percentages of R&D efforts along the adopted maturity scale. In particular, the x axis of a graph displaying such a maturity profile represents the considered seven phases while its y axis indicates the percentage of R&D efforts in terms of technological motivations and research activities that are associated with each phase.
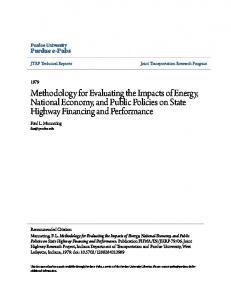
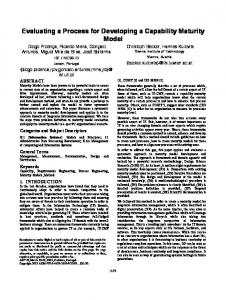
3 Maturity Assessment Results for Selected Micro Tooling and Replication Processes The questionnaire was designed to differentiate whether a given manufacturing technology could be categorised as “developed” within a project or simply “used as a supporting technology”. In the first case, a project would typically focus on overcoming one or several limitations of a manufacturing process in order to improve or broaden its capabilities. In the second case, a project would be more likely to develop a product incorporating micro and nano features and utilise one or a set of micro/nano manufacturing processes to produce different components of the developed product. The maturity profile for a given manufacturing technology was calculated by grouping together all the projects which categorised it as “developed”. The projects in which it was simply “used as a supporting technology” were not taken into account in this assessment because the maturity profiles of those projects would be representative of the particular application developed and thus less meaningful for evaluating the maturity of the associated manufacturing technologies. Based on the grouping of projects targeting the development of a given technology and the assessment of their respective maturity profile, the average percentage corresponding to each maturity phase was calculated. For example, in the case of two projects aiming at developing Nano Imprint Lithography (NIL), if the maturity profile for phase 1 had reached 30% for project A and 50% for project B, then the average percentage corresponding to phase 1 would be 40% for this technology. As it was mentioned earlier, the use of maturity profiles was preferred in this study as a means to increase the information content of the maturity assessment results. However, in order to provide a maturity ranking and to compare one technology with another, it is also useful to complement the information given by the maturity profiles by deriving from them a single maturity value for each technology. To achieve this, the sum of the percentages for phases 5, 6 and 7 was computed for each technology. This sum is called the “maturity indicator” as it gives the percentage of R&D efforts that are targeted at the most mature phases of the scale and as a result, it provides an indication of the suitability of a technology to be exploited commercially. Fig. 2 and Fig. 3 show the maturity profiles obtained for a restricted number of micro tooling and replication processes. These profiles are compared against each other by mapping them on a graph for which the x axis represents the value of the maturity indicator for a given technology while the y axis shows the number of projects surveyed that developed a particular technology. The processes shown in Fig. 2 and 3 correspond to those that were considered the most important for the future according to the results of a roadmapping study carried out in 2006 by the 4M community [4]. When considering micro tooling processes only, Fig. 2 shows that the maturity of micro milling and micro EDM is ranked higher than that for laser ablation. This fact tends to support the real impact of these technologies in the context of the micro tool making industry. Also it is not surprising to observe from Fig. 3 that, among the polymer replication processes, the maturity indicator of injection moulding is higher than that of NIL and nano imprinting.
Fig. 2. Comparison of maturity profiles for micro tooling processes
Fig. 3. Comparison of maturity profiles for replication processes.
4 Conclusions The paper presented a methodology for assessing technology maturity which is inspired by the TRL concept. However, it is designed to overcome some of the limitations of this concept. In particular, the proposed methodology was developed to simplify the maturity evaluation procedure in order to combine a large number of inputs from a rich and validated knowledge repository in the form of an R&D project portfolio. In addition, the method results in a maturity assessment output containing an increased information content and it also allows the identification of a broad picture of technology maturity that is not specific to a particular organisation. The methodology was demonstrated for a set of micro and nano manufacturing processes employed for tooling and replication. However, it could also be easily applied to evaluate the maturity of a range of micro assembly technologies. The generic finding resulting from implementing this methodology on selected micro and nano fabrication processes is that R&D efforts exist to support the integration into production environments of the most important future manufacturing technologies, as identified by the 4M community. However, the proportion of these R&D activities is lower compared with those focused on the less mature phases of their development. In addition to being a risk assessment tool for industry, the proposed methodology should be valuable for funding bodies and policy makers to monitor the impact of sponsored R&D projects and to identify funding gaps along the maturity scale. Acknowledgments. The research reported in this paper is funded by the Engineering and Physical Sciences Research Council (GR/S75505, EP/F056745/1) and the ERDF Programme “Supporting Innovative Product Engineering and Responsive Manufacture”. Also, it was carried out within the framework of the EC FP6 Networks of Excellence, “Multi-Material Micro Manufacture (4M): Technologies and Applications”, the "Innovative Production Machines and Systems (I*PROMS)" and the FP6 Coordination Action µSAPIENT. The authors gratefully acknowledge the assistance given by colleagues at Cardiff University Innovative Manufacturing Research Centre and by the participants to the questionnaire.
References 1. Mankins J. Technology readiness levels, 1995, www.hq.nasa.gov/office/codeq/trl/trl.pdf 2. Saunders M., Lewis P. and Thornhill A.: Research Methods for Business Students. Prentice Hall, Harlow (2003) 3. Dornfeld, D., Min, S. Takeuchi, Y.: Recent Advances in Mechanical Micromachining. Annals of the CIRP, 55(2), 745--768 (2006) 4. Dimov, S.S., Matthews, C.W., Glanfield, A. Dorrington, P.: A Roadmapping Study in Multi-Material Micro Manufacture. In: Proceedings of the Second International Conference on Multi-Material Micro Manufacture, 4M2006, pp xi-xxv. (2006)