A Methodology to Improve Dependability in Spreadsheets Margaret Burnett Oregon State University
[email protected]
1
Introduction
2
Testing and Methodology
Marc Fisher II, Gregg Rothermel University of Nebraska - Lincoln {mfisher,grother}@cse.unl.edu
that generates new test cases to cover unexercised portions of the spreadsheet [2] or replays test cases Spreadsheets are one of the most commonly used end- to re-validate changed portions of the spreadsheet. user programming environments. As such, there has been significant effort on the part of researchers and Assertions Mechanism practitioners to develop methodologies and tools to 3 improve the dependability of spreadsheets. Our work has focused on the development of the WYSIWYT also includes an assertions mechanism “What You See Is What You Test” (WYSIWYT) where users can supply a valid range of values for family of techniques. WYSIWYT is designed to be a cell [1]. These ranges are then propagated through seamlessly integrated into a spreadsheet environment dependent cells using interval arithmetic techniques, and the user’s development processes. It uses visual and conflicts between user-supplied ranges, propadevices that are integrated into the user’s spreadsheet gated ranges and cell values are displayed to the user. The assertions mechanism interacts with Help-Meto guide the process of finding and fixing problems Test in two ways. User-supplied ranges on cells whose with the spreadsheet. There are three major components to the WYSI- formulas are simple data values are used to limit the WYT methodology: a testing and debugging inputs used when generating new test cases. Helpmethodology, an assertions mechanism, and the Me-Test then attempts to generate test cases that violate the ranges on formula cells as they indicate “Surprise-Explain-Reward” strategy. that the user has an error either in a formula or a range.
Debugging 4
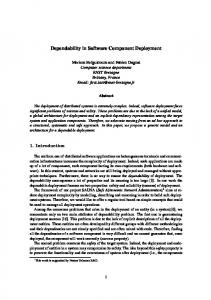
WYSIWYT provides a testing and debugging methodology [3]. As the user edits their spreadsheet they are provided with visual devices indicating the “testedness” (coverage relative to an underlying dataflow adequacy criterion) of the cells and the spreadsheet and the ability to mark the values in cells as correct or incorrect. If the user marks a cell’s value as correct, the testedness of the contributing cells is updated as is the testedness of the spreadsheet. If, instead, the user marks a cell’s value as incorrect, additional information is displayed to the user about the “fault likelihood” of cells based on the number of correct and incorrect values to which they contribute[4]. Figure 1 shows our visual devices in the Excel spreadsheet language. In addition to tracking testedness and fault likelihood, WYSIWYT includes a “Help-Me-Test” feature Dagstuhl Seminar Proceedings 07081 End-User Software Engineering http://drops.dagstuhl.de/opus/volltexte/2007/1088
Surprise-Explain-Reward
A key strategy in getting end users to effectively utilize the WYSIWYT methodology is SurpriseExplain-Reward [5]. Surprise-Explain-Reward relies on a user’s curiosity about features in the environment. According to research about curiosity, if the user is surprised by something, such as the checkboxes in the spreadsheet, the surprise can arouse the user’s curiosity, potentially causing the user to seek an explanation. All features and feedback must therefore be able to explain themselves. These explanations must do two things: first, make the user aware of why the item is worthy of further attention (i.e., make the rewards clear), and second, help the user make an informed judgment as to whether the reward is worthwhile. Users explore a feature by viewing its explanation, on demand, via tool tips and other low-cost mechanisms. 1
Figure 1: WYSIWYT Devices in the Excel Spreadsheet Environment
The reward in the explanation informs the user [2] M. Fisher II, G. Rothermel, D. Brown, M. Cao, C. Cook, and M. Burnett. Integrating automated when weighing costs, benefits, and risks in deciding how to complete a task. By providing users a projectest generation into the wysiwyt spreadsheet testing methodology. ACM Transactions on Softtion of future benefits, they can better assess if the ware Engineering and Maintenance, 15(2):150– cost of using the feature is worth their time. If all 194, April 2006. goes well, if the user follows up as advised in the explanation, rewards will ensue, such as an increase in [3] G. Rothermel, M. Burnett, L. Li, C. DuPuis, testing coverage or the discovery of an error. and A. Sheretov. A methodology for testing spreadsheets. ACM Transactions on Software Engineering and Maintenance, 27(1):110–147, Jan5 Future Work uary 2001. Our most recent research continues to investigate [4] J. Ruthruff, S. Prabhakararao, J. Reichwein, C. Cook, E. Creswick, and M. Burnett. InteracSurprise-Explain-Reward, focusing primarily on the tive, visual fault localization support for end-user explanations aspect. We are doing significant experiprogrammers. Journal of Visual Languages and mental prototyping and empirical work to understand Computing, 16(1-2):3–40, February/April 2005. what end-user programmers actually want to know when debugging, how explanations provided by the [5] A. Wilson, M. Burnett, L. Beckwith, O. Granatir, system can help them, and how they might be able L. Casburn, C. Cook, M. Durham, and G. Rotherto help each other. We are thus looking into stratemel. Harnessing curiosity to increase correctness gies end-user debuggers follow, whether the system in end-user programming. In Proceedings of the helps to support these strategies, and whether the exACM SIGCHI Conference on Human Factors in planations are helpful in improving their debugging Computing Systems, pages 305–312, April 2003. strategies. We are also interested in aspects of the end-user software engineering lifecycle beyond testing and debugging, and how to support them.
References [1] M. Burnett, C. Cook, and G. Rothermel. Enduser software engineering. Communications of the ACM, 47(9):53–58, September 2004. 2