A Mission-Oriented Citizen Science Platform for Efficient Flower Classification Based on Combination of Feature Descriptors Andréa Britto Mattos Ricardo Guimarães Herrmann Kelly Kiyumi Shigeno
Rogerio Schmidt Feris IBM TJ Watson Research
[email protected]
IBM Research - Brazil
{abritto,rhermann,kshigeno}@br.ibm.com ABSTRACT
analyzed for scientific purposes, has been active for generations, dating back to 1900, when the Christmas Bird Count (CBC)1 project started. It was a form of mass collaboration citizen science project that used paper forms sent by post to the responsible society or research group of scientists who requested the data. Nevertheless, it is noticeable that the power of crowdsourced science is growing intensely nowadays and such projects are becoming increasingly popular, even gaining the attention of major news media. For instance, projects such as eBird2 and Galaxy Zoo3 are able to engage hundreds of thousands of volunteers and are being broadly used for scientific and educational purposes. The citizen science’s popularity boost is given by the fact that data collection and analysis tasks became much easier to address. Even simple and low cost smartphones are equipped with GPS and high-resolution cameras that allow huge amounts of data to be collected with small effort. Also, the Internet brings together a high number of volunteers to work on this data remotely and simultaneously. However, there are still difficulties that prevent the further growth of this methodology. One challenge of citizen science projects is how to obtain high and constant engagement of the users. Although some volunteers are motivated by the scientific contribution on its own, it is possible to resort to “gamification”, the use of game elements in non-game contexts [7], to get others to further engage with the community and contribute more enthusiastically [8]. Project Noah4 , for instance, is a large scale project in which every report is assigned to a specific mission, whose goal is to monitor certain types of flora or fauna classes in a specific location. There are also many aspects that can increase user motivation, as observed in [28]. For instance, the volunteers must have confidence that the collected data is being used: therefore, they should have easy access to the visualization of the collected data. Also, it is important to notice that some users are not willing to modify their daily activities to report data, and providing training and mentoring for volunteers to increase their skills can be fundamental for valid data registration. This last point highlights an additional drawback of proje-
This paper describes a citizen science system for flora monitoring that employs a concept of missions, as well as an automatic approach for flower species classification. The proposed method is fast and suitable for use in mobile devices, as means to achieve and maintain high user engagement. Besides providing a web-based interface for visualization, the system allows the volunteers to use their smartphones as powerful sensors for collecting biodiversity data in a fast and easy way. The classification accuracy is increased by a preliminary segmentation step that requires simple user interaction, using a modified version of the GrabCut algorithm. The proposed classification method obtains good performance and accuracy, by combining traditional color and texture features together with carefully designed features, including a robust shape descriptor to capture fine morphological structures of the objects to be classified. A novel weighting technique assigns different costs to each feature, taking into account the inter-class and intra-class variation between the considered species. The method is tested on the popular Oxford Flower Dataset, containing 102 categories and we achieve state-of-theart accuracy while proposing a more efficient approach than previous methods described in the literature.
Categories and Subject Descriptors H.3 [Information Storage and Retrieval]: Online Information Services; I.4 [Image Processing and Computer Vision]: Scene Analysis; I.5 [Pattern Recognition]: Applications
Keywords Computer vision, fine-grained classification, flora classification, citizen science
1.
INTRODUCTION
Citizen science is not a new concept: the idea of conducting research by citizens, gathering crowdsourced data that is c by the paper’s authors. Copying permitted only for private Copyright and academic purposes. In: S. Vrochidis, K. Karatzas, A. Karpinnen, A. Joly (eds.): Proceedings of the International Workshop on Environmental Multimedia Retrieval (EMR 2014), Glasgow, UK, April 1, 2014, published at http://ceur-ws.org
1
http://birds.audubon.org/christmas-bird-count http://www.ebird.org/ 3 http://www.galaxyzoo.org/ 4 http://www.projectnoah.org/ 2
45
Table 1: Review of citizen science projects in the botanical field. Project
Goal
Reported data
Platform
Scope
Limitations
Conker Tree Science
Plague monitoring
Presence or absence of affected plants and severity of plague damage
Web, Android, iPhone
UK
Requires training to differentiate natural aging and plague effect
Plant Tracker
Monitor invasive plants (non-native)
Presence of 14 types of invasive plants
Web, Android, iPhone
UK
Requires training to differentiate native and invasive plants
The Great Sunflower Project
Monitor pollinators
Presence and quantity of pollinators (bees and hummingbirds), plant type
Web
US
Requires training to differentiate bees from wasps and flies
Melibee Project
Monitor sweetclover (invasive) effect in the pollination of blueberry and cranberry (native)
Phenology of blueberry, cranberry and sweetclover, monitoring 5 plants during a certain period
Web
Alaska
Requires repetitive work and training to differentiate the monitored species
Wildflowers count
Annual wildflowers count
Identify 99 species in a randomly chosen 1 km2 area
Web
UK
Requires training to identify 99 types of flowers, location chosen by the system
Virbunum Leaf Beetle
Monitor plagues in Viburnum species
Presence of infected plants
Web
NY
Requires training to identify Viburnum species
BudBurst
Study effects of climate change on plant phenology
Presence and quantity of flowers and fruits (single or regular reports)
Web, mobile
US
Requires training to identify the monitored flowers
E-Flora BC
Build flower catalog
Geo-located rare species
Web
British Columbia
Only monitors significant species
Project Noah
Build fauna and flora catalog
Geo-located pictures within a mission
Web, Android, iPhone
Worldwide
Not all species are identified
LeafSnap
Build plant catalog
Geo-located leaf pictures
iPhone
NY / Washington DC
Requires picture of a single leaf in a white background
Regarding automatic classification, the LeafSnap project5 offers a good differential with respect to other citizen science projects, since it runs a shape-based algorithm to classify plant species from their leaves automatically [15]. However, the user needs to extract (i.e., cut) the leaf and place it on a white background for the segmentation algorithm to work. The segmentation method proposed by LeafSnap might be considered harmful in an environmental aspect, once it requires the extraction of the leaves from their natural surroundings. Also, lighting variations can affect the background color and interfere in the segmentation result. Finally, it is hard to extend LeafSnap for additional domains other than leaf classification: besides taking shape information as the only feature for classification, a segmentation method based on a fixed background is only feasible for static species, once it is clear that, when photographing specimens that can move, there is no guarantee that they will remain in place. Table 1 shows a list of various citizen science projects in the botanical field. To the best of our knowledge, these are the most representative projects in this area. Their limitations highlights the previously discussed issues regarding the difficulty of species identification or adaptation of the volunteers routine, once the data upload requires a computer and/or Internet connection. Our goal is to develop a system similar to LeafSnap, but focusing on flowers, and replacing the user effort for segmentation by a simpler and less intrusive action taken in his own device. Since our study is part of the citizen science context, user interaction is accepted, once we assume there is always a volunteer operating the system in his smartphone or tablet. Our platform is developed with the concern of be-
cts monitoring biodiversity: relying on the users having the knowledge to classify, without further assistance, the specimens being reported. This can be a difficult task when one considers the large number of species that share similar morphology. Misclassified inputs can compromise the environmental research, and the impossibility to assure the quality of the analysis made by non-experts may be the bottleneck of such projects. In this regard, an algorithm to assist the user would be very useful. A system that could automatically recognize an input image with small effort, or at least retrieve a list of the most similar species, could make the user feel more confident, perhaps even engaging a larger number of volunteers, preventing errors and accelerating the identification process. If such a system could be deployed in a mobile device, the benefits would be even greater, once the classification could be executed at collection time. To assist non-expert classification, automatic works in the flora field – which is the domain of focus of this paper – are getting good attention, and recent studies were able to achieve good results in leaf and flower classification [1, 3, 18, 19]. This popularity is evident as we see efforts such as the recent Plant Identification Task, promoted by the widely popular ImageCLEF challenge [9]. Besides robustness, automatic or semi-automatic methods can reduce data collection time. For instance, as indicated by Zou and Nagy [33], for a dataset of 102 flower species, the time for a semi-automatic classification is much lower than that made by humans alone.
1.1 1.1.1
Related Work Citizen Science in the Flora Domain
5
46
http://leafsnap.com/
ing attractive to users so it can reach the largest number of volunteers as possible. Therefore, our flower classification algorithm must have high accuracy and also must be fast enough so that it can run in the web browser and also in mobile devices. Besides, we use missions to engage and entertain the volunteers, following gamification principles. In order to compare our classification results with a benchmark, we use the challenging Oxford Flower Dataset6 .
1.1.2
Using segmented images, the authors are able to achieve a more robust classification for this dataset, though none of the considered works is suitable for real time. Nilsback [21, 22] applies a multi-kernel SVM classifier using four different features (color in HSV space, HOG, and SIFT in foreground and boundary regions). Chai [5] proposes a robust approach for co-segmentation (segmenting images with similar background color distributions) and applies a SVM classifier based on color features in the Lab space and SIFT in foreground region. Angelova [1, 16] proposes a segmentation approach, followed by the extraction of HOG features at four different levels, encoded using LLC. The encoded features are subject to a max pooling and a SVM classifier is used. They mention future efforts in making a real time approach.
Flower Classification
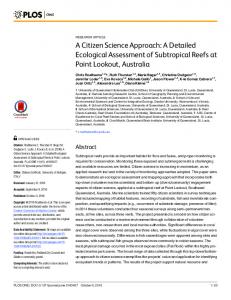
In the flower classification field, previous studies worked on small datasets of 10 to 17 flower species [10, 14, 20, 25], achieving accuracy rates of 81% - 96%. Most of these works rely on contour analysis and SIFT features [17], which is known to be a robust descriptor, but computationally inefficient. Using larger datasets, consisting of 30 to 79 flower species, accuracy rates vary from 63% - 94%, combining a variety of approaches such as histograms in HSV color space, contour features, co-occurrence matrix (GLCM) for texture features, RBF and probabilistic classification [6, 29, 30]. Qi [26] focuses on a fast environmental classification for flowers and leaves, using spatial co-occurrence features and a linear SVM, but accuracy is not reported. Works on the Oxford Flower Dataset, that contains 102 flower species, reported accuracy rates no greater than 80%. The dataset was introduced by Nilsback and Zisserman[21] and is used by many authors. It is considered an extremely challenging dataset, because it contains pictures with severe variations in illumination and viewpoint, and also, due to small inter-class variations and large intra-class variations between the considered flower species. See some examples of such cases in Fig. 1.
(a) Spear Thistle (left) and Artichoke (right).
(b) English Marigold (left) and Barbeton Daisy (right).
(c) Spring Crocus.
(d) Bougainvillea.
1.2 Contributions and Organization Our main goal is to develop a citizen science application for flower monitoring whose collection is oriented by missions. Also, to assist the volunteers, we propose an algorithm for classification of flower species that meets the following requirements: (i) Has high accuracy: We propose a novel approach that relies on efficient histogram-based feature descriptors that capture both global properties and fine shape information of objects. This is made while leveraging a learning-based distance measure to properly weight the feature contributions, which is a critical step for increasing accuracy as demonstrated in previous studies [4, 31, 32]. (ii) Is fast: Mobile-based applications have a challenge regarding connectivity: users can only submit requests and receive answers if their devices have access to the Internet. There are several locations in which this kind of service is not affordable or has poor quality, making image transference prohibitive. Our algorithm is fast enough to run directly in the devices (without transferring information to a server), so the user does not have to rely upon a network connection and wait too long for a response, considering additional time latency for uploading the image and retrieving the classification results. This paper is structured as follows. In Section 2, we describe the overall structure of our citizen science platform and, in Section 3, we describe the core approach for finegrained classification. In Section 4, we show and discuss the obtained classification results on the considered dataset and our conclusions and future work are described in Section 5.
2.
Figure 1: Samples of the Oxford Flower Dataset. On the top row, samples of different classes with small inter-class variations. On the bottom, samples of the same class, with large variations in color, texture and shape. Using the Oxford Dataset, studies working with unsegmented images demonstrate lower accuracy in classification and require powerful classifiers, that are computationally expensive [2, 11]. Khan’s work [13] relies on color and shape, using a SIFT based approach. Kanan [12] applies salience maps to extract a high-dimensional image representation that is used in a probabilistic classifier. Both works require high computation time due to their feature extraction methods. 6
SYSTEM
The system is comprised of two main parts: a web portal, organized toward data visualization and community organization, and a mobile application, aimed at data collection. Both components arrange user-contributed data around the concept of missions, which aggregate users with the common goal of collecting structured and unstructured data about a certain class of observations. The collected data is structured in a set of attributes, whose pre-established values are filled in by the user and refer to the domain being registered. This structure allows us to provide query-by-example features, which helps to avoid common input errors and establish a common vocabulary for user-contributed data. The unstructured data, on the other hand, is comprised of images only, since we are dealing with plants.
http://www.robots.ox.ac.uk/~vgg/data/flowers/ 47
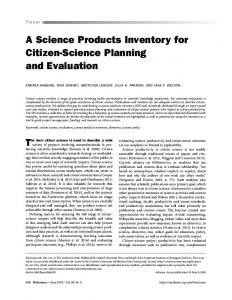
(a) Image upload
(b) Free-hand user marker (c) Classification of the (in white) segmented input
(d) Other results
(e) Screen for geo-analysis
Figure 2: System mobile interface for classification. The user uploads an image, inserts a marker for semi-automatic segmentation of the input image and retrieves a scrollable screen with the top similar classes for the uploaded image, sorted by highest probability. The observation is inserted in a map using the device’s location.
Missions are created by users and can be set as public or private, as determined by the mission’s owner, since some of them may contain sensitive geo-spatial data about observations belonging to endangered species. As the number of missions in the system may be rather large, the portal ranks them according to their activity, to make it easier for users to engage with the rest of the community. It is currently possible to collect geo-referenced photos with consumer-grade mobile devices, using their cameras and GPS receivers, as mentioned in Section 1. The steps the user has to go through in order to submit a contribution are highlighted in Fig. 2. For the purpose of submitting a report, the user first needs to join one mission. After the picture is taken, he must loosely delineate the region of interest in the image. This is used for a segmentation process that will be described int the next Section. This step can require user confirmation for proceeding with the next task, which is the automatic classification of the segmented input. The system retrieves the top 5 matches that are more similar to the uploaded image and the user can select the correct one or browse within a list of all the registered classes. In situations where there is no connectivity, the algorithms can be executed directly on the devices, as a significant range of current mobile processors have multiple cores and some of them have vector processing instructions, which are already supported by popular libraries for mobile platforms, such as OpenCV. After the report is submitted (and synchronized with the server, in situations of intermittent or no connectivity), other users can view and bookmark this report. The feedback is provided to the users as bookmarked reports. Additionally, the user may fill in a form containing values for the observable raw morphological attributes of the sample. The set of supported attributes is defined by the mission’s owner at the moment it is created, where he can define the required fields according to the mission’s needs. For the botanic field, some examples of attributes are stem diameter, leaf thickness and so on. In order to obtain more accurate classification results, we let the user choose the category of the image he is uploading. We currently only have trained classifiers for flowers, but the
overall concept of the system is generic for accepting data belonging to other categories. Since observations can be arbitrary, we need to load the corresponding classifier that was trained with the relevant data for the current category.
3.
ALGORITHM
This section describes the proposed algorithm for flower recognition that is divided in segmentation and classification steps. Both tasks are designed to be fast and precise and are generic enough to be used for classifying categories other than flowers.
3.1
Segmentation
We use the GrabCut algorithm [27] for a semi-manual segmentation using small user interaction. This method is also used in Qi’s work [26] due to its good performance. In our method, instead of defining a bounding box and control points, the user draws a free hand marker, which is more intuitive for a general user. The marker replaces the control points for a more refined boundary in a faster interaction. It must involve the whole object but does not have to be precise. A Gaussian Mixture Model is used to learn the pixel distribution in the background (outside the marker) and possible foreground regions and a graph is built from this pixel distribution. Edges’ weights are given according to pixel similarity (a large difference in pixel color generates a low weight). Finally, graph and image are segmented by a mincut algorithm. See an example in Fig. 2(b) of a user marker and corresponding segmented output in Fig. 2(c). The advantages of this approach are its simplicity in a user perspective, generation of good segmentations and that it is faster than the segmentation approaches proposed in Section 1.1.2, requiring average time of 1.5 second.
3.2
Classification
We compare multiple features (i.e. color, texture and shape-based features) with histogram matching, which is fast and invariant to rotation, scale and partial occlusion. For each class, a weight is assigned to each feature and 48
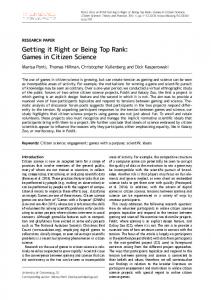
(a) Two classes that have similar color for (b) Species that can have many different col- (c) Two classes with similar shape and color, all samples, but variations in shape. ors, while having a similar shape. but with large variation in texture.
Figure 3: A few examples of intra-class and inter-class variation between features of different training samples of six of the considered classes.
the segmented images are matched by comparing their histograms, using a kNN classifier. The difference between two histograms is computed by a metric based on the Bhattacharyya distance that is described as follows. Consider histograms H1 and H2 , with n bins. Let H1 (i) denote the ith bin element of H1 , i ∈ 1 . . . n. H2 (i) is defined analogously. The distance between H1 and H2 is measured as:
elongated shapes are easily distinguished from round shapes. The angular descriptor computes the angles between p and its neighbors pi−1 and pi+1 , measuring the smoothness of the contour. The proposed descriptor becomes powerful by merging two simple features being able to represent, for instance, petals length, density and symmetry.
3.2.2
i=1
i=1
Note that low scores indicate best matches. Our algorithm compares histograms built on three features cues.
3.2.1
Metric Learning
In order to achieve higher accuracy, we assign different weights to the features when matching each class, as to contemplate the situations described in Fig. 3. Our idea is to find which features are more discriminative taking into account each feature variation inside a same class, but also, with respect to the global variation of all classes. We learn, for each class, one weight for each of the four feature descriptors. We estimate few weights due to the small number of training samples per class. We consider N classes, each containing M training samples, evaluated according to P features7 . p Let Hi,j denote, for a class i, the histogram of a sample j regarding feature p. We compute the mean histogram of a feature p for a class i as:
v Pn p u H1 (i) × H2 (i) u u d(H1 , H2 ) = 1 − s i=1 u n n P P t H1 (i) × H2 (i)
Features
Color. We build a histogram of the segmented image’s colors in the HSV space, which is known to be less sensitive to lighting variations, using 30 bins for hue and 32 bins for saturation. Image quantization is applied before computation and the histograms are normalized in order to be comparable with the proposed distance metric.
M P
¯p H i
Texture.
p Hi,j
j=1
=
M
Likewise, we define εpi as the mean distance per class i, regarding feature p, computing the distance from all the training samples to the mean histogram. This help us to evaluate intra-class variations, once we are considering the difference between all samples with respect to a histogram that estimates the overall structure of the class.
The texture operator applied in the segmented image is LBP (Local Binary Pattern) [23], that is commonly used in real time applications due to its computational simplicity. In LBP, pixels are represented as a binary number that is product from thresholding its neighbors against it. We use the extended version of LBP [24], that considers a circular neighborhood with variable radius and is able to detect details in images with different scales. Our method computes a single histogram with 255 bins, once the considered textures are mainly uniform and spatial texture information did not improve the classification in our tests.
M P
εpi =
p ¯ p) d(Hi,j ,H i
j=1
M
Also, we compute the mean distance per feature p (εp ) as follows:
Shape.
N P
We propose the use of two simple and fast descriptors that, when combined, are able to represent different shape characteristics. The shape contour is partitioned in 72 bins using fixed angles, resulting of m contour points. For each point pi , i ∈ 1 . . . m, we compute modular and angular descriptors, and both vectors are later represented as separate histograms. The modular descriptor is taken by computing the point distance from the shape centroid, normalized by the major distance dmax computed in this process. It measures the contour relation according to the shape mass center, and
p
ε =
εpi
i=1
N and we use this information to estimate inter-class variations between all types of species regarding each considered feature. Finally, the weight λ attributed to each of the considered features p in class i is given by: 7 In our tests, we use N = 102, M = 20 and P = 4, since we consider two histograms for shape information.
49
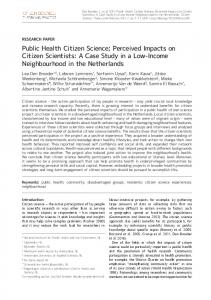
(a) Input belonging to Bearded Iris (BI) class, with large variation in color.
(b) Input belonging to Bishop of Llandaff (BoL) class, with small variation in color.
(c) Input belonging to Spring Crocus (SC) class, with large variation on texture.
(d) Input belonging to Blackberry Lily (BL) class, with small variation in texture.
Figure 4: Results for 4 different inputs. In each column, from left to right: input with user marker; segmented input and top 5 matches sorted by highest probability; respective weights λ(i, p) for the corresponding classes; 8 training samples of each class. In the graphics, columns indicate angular, modular, color and texture features.
λ(i, p) =
we can see that the system is able to achieve a very high accuracy rate for a very challenging dataset.
1 − x(i, p) , where x(i, p) = εpi − εp + min(εp ) P p P x(i, p)
Table 2: Algorithm’s accuracy when considering the top n matches for the test inputs.
p=1
and we are able to take into account intra-class and interclass variations between all training samples, estimating how each feature should be considered when evaluating each considered class. After the weights computation, we employ a kNN classifier in the test phase where the cost of matching an image I with an image IC of class C is computed as:
C(I, IC ) =
Metric Learning No Yes
n=3 83.13% 92.45%
n=5 88.72% 96.07%
n = 10 94.11% 98.33%
The results also show that weighting features can improve classification significantly (+15.3%) and we are able to achieve the best results reported on the state-of-the-art for this dataset, in terms of accuracy, as seen in Table 3.
P X λ(C, p) × d(HI , HIC ) maxi (εpi ) p=1
Table 3: Accuracy comparison with previous works using the Oxford Dataset.
and select the classes with the lowest costs. We choose the kNN classifier because it is robust and performs well with training sets whose dimension is similar to the ones we are dealing with.
4.
n=1 65.58% 80.88%
Ito and Kubota [11] Nilsback and Zisserman [21] Khan et al. [13] Kanan and Cottrell [12] Nilsback [22] Angelova et al. [2] Chai et al. [5] Angelova and Shenghuo [16] Ours
RESULTS
Our tests followed the specifications for using the Oxford Dataset as a benchmark, considering 20 training samples per class and computing the mean-per-class accuracy. In this dataset, the number of images in each class varies from 40 to 258. Fig. 4 shows the top 5 results for 4 different inputs. Every image is segmented as described in Section 3.1 and the used weights are given as described in our metric learning method. Note how the weights affect the classification results. Table 2 describes the algorithm’s accuracy for a variable number of top matches, with and without using metric learning. Once our platform returns the top 5 most likely classes,
53.9% 72.8% 73.3% 75.2% 76.3% 76.7% 80.0% 80.6% 80.8%
Efficiency can not be compared precisely, because this information is not reported in all the previous works. However, our average time for extracting and matching all features proved to be 4 times faster than running SIFT in the images’ foreground region. The baseline work of Angelova and Shenghuo [16] takes about 5 seconds for segmentation and 2 50
seconds for classification. Our classification runs in less than a second, and there is a tradeoff for segmentation: ours is semi-automatic, but requires 1.5 seconds on average. Finally, we replicated the training instances, and Table 4 shows that our method is still efficient for much larger training sets. Approximate nearest-neighbor methods based on hashing or kd-trees could also be used for obtaining even higher efficiency.
[6]
[7]
Table 4: Elapsed time (in seconds) for classifying a single input, with increasing number of training samples per class. # samples Elapsed time
5.
20 0.07
40 0.09
60 0.13
100 0.20
200 0.35
1000 1.3
[8]
CONCLUSIONS
This paper proposes a citizen science platform based on a novel approach for flower recognition. We introduce a strategy for comparing feature histograms for fine-grained classification, a robust shape descriptor and a metric learning approach that employs different weights to each feature, that can improve classification accuracy significantly. Our algorithm is extremely fast, being suitable for offline mobile applications and was able to outperform previous works using the popular Oxford Dataset. Our system is organized around missions, which in general will help us acquire more data due to gamification aspects. Also, besides engaging users, missions provide additional data external to the image, that may be useful for aiding classification in the future. Other future works include testing our algorithm in other species that contain large variations in the considered features (color, texture and shape), such as butterflies, fishes, birds and so on, and evaluating more efficient classifiers. We will also evaluate our system with real users analyzing how their behavior is affected with gamification and automatic classification techniques. Finally, we aim to use crowdsourcing for labeling training images, in order to build various datasets that should represent the local flora and fauna for diverse locations.
6.
[9]
[10]
[11]
[12]
[13]
REFERENCES
[14]
[1] A. Angelova and S. Zhu. Efficient object detection and segmentation for fine-grained recognition. In 2013 IEEE Conference on Computer Vision and Pattern Recognition, CVPR’13, pages 811–818, 2013. [2] A. Angelova, S. Zhu, Y. Lin, J. Wong, and C. Shpecht. Development and deployment of a large-scale flower recognition mobile app. In NEC Labs America Technical Report, 2012. [3] E. Aptoula and B. Yanikoglu. Morphological features for leaf based plant recognition. In IEEE International Conference on Image Processing, ICIP ’13, pages 1496–1499, 2013. [4] H. Cai, F. Yan, and K. Mikolajczyk. Learning weights for codebook in image classification and retrieval. In Computer Vision and Pattern Recognition, 2010 IEEE ˘ Z10, ´ Conference on, CVPRˆ aA pages 2320–2327, June 2010. [5] Y. Chai, V. Lempitsky, and A. Zisserman. BiCoS: A bi-level co-segmentation method for image
[15]
[16]
[17]
[18]
51
classification. In IEEE International Conference on Computer Vision, ICCV’11, pages 2579–2586, 2011. S.-Y. Cho. Content-based structural recognition for flower image classification. In IEEE Conference on Industrial Electronics and Applications, ICIEA’12, pages 541–546, 2012. S. Deterding, D. Dixon, R. Khaled, and L. Nacke. From game design elements to gamefulness: Defining ”gamification”. In Proceedings of the 15th International Academic MindTrek Conference: Envisioning Future Media Environments, MindTrek ’11, pages 9–15, New York, NY, USA, 2011. ACM. S. Deterding, M. Sicart, L. Nacke, K. O’Hara, and D. Dixon. Gamification. using game-design elements in non-gaming contexts. In CHI ’11 Extended Abstracts on Human Factors in Computing Systems, CHI EA ’11, pages 2425–2428, New York, NY, USA, 2011. ACM. H. Go¨eau, A. Joly, P. Bonnet, V. Bakic, D. Barth´el´emy, N. Boujemaa, and J.-F. Molino. The ImageCLEF plant identification task 2013. In Proceedings of the 2Nd ACM International Workshop on Multimedia Analysis for Ecological Data, MAED ’13, pages 23–28, New York, NY, USA, 2013. ACM. R.-G. Huang, S.-H. Jin, Y.-L. Han, and K.-S. Hong. Flower image recognition based on image rotation and DIE. In International Conference on Digital Content, Multimedia Technology and its Applications, IDC’10, pages 225–228, 2010. S. Ito and S. Kubota. Object classification using heterogeneous co-occurrence features. In European Conference on Computer Vision, ECCV’10, pages 27–30, 2010. C. Kanan and G. Cottrell. Robust classification of objects, faces, and flowers using natural image statistics. In IEEE Conference on Computer Vision and Pattern Recognition, CVPR’10, pages 2472–2479, 2010. F. S. Khan, J. van de Weijer, A. D. Bagdanov, and M. Vanrell. Portmanteau vocabularies for multi-cue image representation. In International Conference on Neural Information Processing Systems, 2011. J.-H. Kim, R.-G. Huang, S.-H. Jin, and K.-S. Hong. Mobile-based flower recognition system. In International Conference on Intelligent Information Technology Application, IITA’09, pages 580–583, 2009. N. Kumar, P. N. Belhumeur, A. Biswas, D. W. Jacobs, W. J. Kress, I. C. Lopez, and J. a. V. B. Soares. Leafsnap: A computer vision system for automatic plant species identification. In European Conference on Computer Vision, ECCV’12, pages 502–516, 2012. Y. Lin, S. Zhu, and A. Angelova. Image segmentation for large-scale subcategory flower recognition. In IEEE Workshop on Applications of Computer Vision, WACV ’13, pages 39–45, 2013. D. Lowe. Object recognition from local scale-invariant features. In International Conference on Computer Vision, ICCV ’99, pages 1150–1157, 1999. S. Mouine, I. Yahiaoui, and A. Verroust-Blondet. Plant species recognition using spatial correlation between the leaf margin and the leaf salient points. In IEEE International Conference on Image Processing, ICIP ’13, 2013.
[19] S. Mouine, I. Yahiaoui, and A. Verroust-Blondet. A shape-based approach for leaf classification using multiscaletriangular representation. In ACM Conference on International Conference on Multimedia Retrieval, ICMR ’13, pages 127–134, 2013. [20] M.-E. Nilsback and A. Zisserman. A visual vocabulary for flower classification. In IEEE Computer Society Conference on Computer Vision and Pattern Recognition, CVPR’06, pages 1447–1454, 2006. [21] M.-E. Nilsback and A. Zisserman. Automated flower classification over a large number of classes. In Indian Conference on Computer Vision, Graphics & Image Processing, ICVGIP’08, pages 722–729, 2008. [22] M.-E. Nilsback and A. Zisserman. An automatic visual Flora - segmentation and classification of flower images. PhD thesis, University of Oxford, UK, 2009. [23] T. Ojala, M. Pietik¨ ainen, and D. Harwood. A comparative study of texture measures with classification based on featured distributions. Pattern Recognition, 29(1):51 – 59, 1996. [24] T. Ojala, M. Pietikainen, and T. Maenpaa. Multiresolution gray-scale and rotation invariant texture classification with local binary patterns. Pattern Analysis and Machine Intelligence, IEEE Transactions on, 24(7):971–987, 2002. [25] W. Qi, X. Liu, and J. Zhao. Flower classification based on local and spatial visual cues. In IEEE International Conference on Computer Science and Automation Engineering, CSAE’12, pages 670–674, 2012. [26] X. Qi, R. Xiao, L. Zhang, C.-G. Li, and J. Guo. A rapid flower/leaf recognition system. In ACM International Conference on Multimedia, MM ’12,
pages 1257–1258, 2012. [27] C. Rother, V. Kolmogorov, and A. Blake. “Grabcut”: Interactive foreground extraction using iterated graph cuts. In ACM SIGGRAPH, SIGGRAPH’04, pages 309–314, 2004. [28] H. Roy, M. Pocock, C. Preston, D. Roy, J. Savage, J. Tweddle, and L. Robinson. Understanding citizen science and environmental monitoring: final report on behalf of UK Environmental Observation Framework. Technical report, Wallingford, NERC/Centre for Ecology & Hydrology, 2012. [29] T. Saitoh, K. Aoki, and T. Kaneko. Automatic recognition of blooming flowers. In International Conference on Pattern Recognition, ICPR’04, pages 27–30, 2004. [30] F. Siraj, M. Salahuddin, and S. Yusof. Digital image classification for malaysian blooming flower. In International Conference on Computational Intelligence, Modelling and Simulation, pages 33–38, 2010. [31] J. Wang, A. Kalousis, and A. Woznica. Parametric local metric learning for nearest neighbor classification. In Neural Information Processing Systems (NIPS), pages 1610–1618, 2012. [32] K. Q. Weinberger and L. K. Saul. Distance metric learning for large margin nearest neighbor classification. J. Mach. Learn. Res., 10:207–244, June 2009. [33] J. Zou and G. Nagy. Evaluation of model-based interactive flower recognition. In International Conference on Pattern Recognition, ICPR ’04, 2004.
52