BIOC-06796; No of Pages 7 Biological Conservation xxx (2016) xxx–xxx
Contents lists available at ScienceDirect
Biological Conservation journal homepage: www.elsevier.com/locate/bioc
Citizen science data as an efficient tool for mapping protected saproxylic beetles L. Zapponi a,b,1, A. Cini c,d,1, M. Bardiani b,c, S. Hardersen b, M. Maura c,e, E. Maurizi c,e, L. Redolfi De Zan b,c, P. Audisio f, M.A. Bologna e, G.M. Carpaneto e, P.F. Roversi c, G. Sabbatini Peverieri c, F. Mason b, A. Campanaro b,c,⁎ a
CNR, Consiglio Nazionale delle Ricerche, Istituto di Biologia Agroambientale e Forestale - Via Salaria Km 29,300, 00015 Monterotondo Scalo, RM, Italy CFS Centro Nazionale per lo Studio e la Conservazione della Biodiversità Forestale “Bosco Fontana” di Verona - Strada Mantova 29, 46045 Marmirolo, MN, Italy CREA ABP Consiglio per la Ricerca in Agricoltura e l'Analisi dell'Economia Agraria, Centro di Ricerca per l'Agrobiologia e la Pedologia - Via di Lanciola 12/a, 50125 Cascine del Riccio, FI, Italy d Università degli Studi di Firenze, Dipartimento di Biologia, Via Madonna del Piano 6, 50019 Firenze, Italy e Università Roma Tre, Dipartimento di Scienze – Viale Guglielmo Marconi 446, 00146 Roma, Italy f Sapienza Università di Roma, Dipartimento di Biologia e Biotecnologie C. Darwin - Via A. Borelli 50, 00161 Roma, Italy b c
a r t i c l e
i n f o
Article history: Received 16 October 2015 Received in revised form 22 February 2016 Accepted 28 April 2016 Available online xxxx Keywords: Community-based monitoring Invertebrates Saproxylic beetles Species distribution range IUCN Red List
a b s t r a c t Global change imposes rapid assessments to obtain reliable and updated distribution data to implement conservation measures. This task is undoubtedly unaffordable for numerous invertebrate species, both in terms of time and economic resources, because they are often elusive, detectable life stages are present for a restricted time and ecological data are scarce. Citizen science might be able to provide a large number of records and these data might facilitate the evaluation of extinction risks. Large saproxylic beetles represent an ideal group to assess the potential of citizen science to map distributions on a large scale geographic distribution. The data presented were collected during a citizen science program developed within the LIFE Project “Monitoring of Insects with Public Participation”, which used a website and a mobile app to involve citizens. We selected three pan European species protected under the Habitats Directive: Lucanus cervus, Morimus asper/funereus and Rosalia alpina, and we compared the data gathered by the citizen science project with distributional data from the official national species inventory. For all species we found a low overlap of occupied cells and the integration of the two datasets resulted in an increase in the distributional ranges of up to one third. Furthermore, taking into account the time frame of data collection, we found that the extent of occurrence obtained in 10 years of records present in the national dataset was comparable to data collected in only two years of the citizen science data project. Similar results were obtained for the estimates of spatial parameters for the IUCN Red List assessment. Our study shows the potential and the efficacy of citizen science projects as rapid tools to provide reliable distributional data for neglected species of high conservation priority. © 2016 Elsevier Ltd. All rights reserved.
1. Introduction Range shifts in the distribution of species are one of the main fields of research when dealing with the effects of global change (Bellard et al., 2012; Dormann, 2007; Hijmans and Graham, 2006). Extinction risk of species can be predicted by modelling habitat modification at different climate change scenarios, and the resulting effect on distribution (Dawson et al., 2011; Keith et al., 2008; Pereira et al., 2010). Thus, monitoring changes in the distribution of species could be used as early warning signals. Ideally, assessments of species distributions should be reliable, rapid, economic and up to date. While this seems feasible for a few, large and easily recognizable animal species, such as certain birds and mammals, this is undoubtedly much more difficult for the
⁎ Corresponding author at: CFS Centro Nazionale per lo Studio e la Conservazione della Biodiversità Forestale “Bosco Fontana” di Verona - Strada Mantova 29, 46045 Marmirolo, MN, Italy. E-mail address:
[email protected] (A. Campanaro). 1 These authors contributed equally to this work.
huge number of invertebrate species. The distribution of terrestrial invertebrates is far more finely patterned than is the case for either vertebrates or vascular plants (Oliver et al., 2000). Invertebrates constitute the large majority of biodiversity, accounting for N 80% of the species described. Indeed, among multicellular organisms, invertebrates are dominant in terms of richness, abundance and often biomass (Cardoso et al., 2011b) and occupy most niches and food-web nodes. Thanks to their species richness, diversity and ecological roles, invertebrate provide a full array of ecosystems services, which range from provisioning (e.g. food and pharmaceuticals) to regulating (e.g. pollination), cultural (e.g. tourists attraction of corals or butterflies) and supporting services (e.g. nutrient cycling and soil formation) (Cardoso et al., 2011b). These services have been estimated to value around US$33 trillion per year all over the world (Costanza et al., 2007). Unfortunately, invertebrates are experiencing high extinction rates and proportions of threatened species are higher than those of other better known taxa such as birds and mammals (Cardoso et al., 2011a; MacKinney, 1999; Moir et al., 2010; Stork and Lyal, 1993; Thomas and Morris, 1994).
http://dx.doi.org/10.1016/j.biocon.2016.04.035 0006-3207/© 2016 Elsevier Ltd. All rights reserved.
Please cite this article as: Zapponi, L., et al., Citizen science data as an efficient tool for mapping protected saproxylic beetles, Biological Conservation (2016), http://dx.doi.org/10.1016/j.biocon.2016.04.035
2
L. Zapponi et al. / Biological Conservation xxx (2016) xxx–xxx
Preserving invertebrates is of crucial importance to preserve biodiversity. Nonetheless, invertebrates are mostly underrepresented in international conservation measures and have largely been neglected in the literature on conservation, a result of a taxonomic bias (Cardoso, 2012; Clark and May, 2002; Kremen et al., 1993; New, 1999; Zamin et al., 2010). The Habitats Directive (European Union, 1992), which lists the protected species in the European Union, is dominated by vertebrates, with few arthropod species (Haslett, 2007) and is in need of an urgent revision, according to Cardoso (2012). Many impediments, from funding shortage to a lack of public awareness, can be identified as concurrent explanations for this underrepresentation of arthropods in conservation measures (see Cardoso et al., 2011b). Among these, one key limitation is the so called Wallacean shortfall, a reference to the biogeographer Alfred R. Wallace (Lomolino, 2004; Cardoso et al., 2011b), which indicates inadequate knowledge of the distribution of species. Compiling good distributional data is the first stage of any systematic conservation planning exercise (Margules and Pressey, 2000). Obviously, the lack of reliable information about where certain species live makes it impossible to assess their conservation status and to focus conservation efforts on the most appropriate sites. However, obtaining consistent distribution data for insect species can be particularly difficult. Even if for certain vertebrate species distributions have been correlated with habitat complexity (Coops and Catling, 1997), identifying attributes of habitat structure that act as surrogates for invertebrate biodiversity is feasible only at a very coarse level (Newell, 1997; York, 1999). Thus, obtaining specific information on the distribution of invertebrates requires direct monitoring. Public participation in ecological studies has recently become a pillar of research on biodiversity conservation (Dickinson et al., 2010). While reports from amateur naturalists played an important role already in past centuries, in recent years citizen science (CS) projects, where a non-expert “collects and/or processes data as part of a scientific enquiry” (Silvertown, 2009), emerged as a valuable tool for exploring and tracking spatial and temporal patterns of several taxa all over the world (Dickinson et al., 2010, 2012; Tulloch et al., 2013). A recent review quantified the potential of biodiversity-related CS projects and found that currently about 1.3 million volunteers participate, contributing up to $2.5 billion in-kind annually, exceeding most federally-funded studies in both spatial and temporal extent (Theobald et al., 2015). The experience accumulated so far, especially on large, common and charismatic species, showed that most CS projects 1) are feasible (i.e. a project manages to engage with a large number of citizens in the scientific activity), and 2) allow to quickly gather a large amount of data which are reliable and novel (reviewed in Devictor et al., 2010; Dickinson et al., 2010; Dickinson et al., 2012). CS projects may thus present an important new tools for gathering data that would be too expensive or time consuming to be collected relying solely on paid expert personnel (Braschler, 2009; Cohn, 2008). The adoption of CS projects aimed at monitoring the distribution of invertebrates may have the potential to fill the gaps left by traditional scientific endeavour that hamper the evaluation of extinction risk for neglected and hard to assess taxa. A key question is however whether CS is also able to provide fast, reliable and informative data also for invertebrate species, such as saproxylic insects, less attractive than the commonly targeted taxa by CS projects. Several characteristics make saproxylic beetles, i.e. species that depend on deadwood in at least one phase of their life cycle (Stokland et al., 2012), especially difficult to be monitored exclusively by experts on a large scale. Therefore this ecological group might be suitable for a citizen science program. Saproxylic beetles show a high ecological diversity in terms of trophic attitudes (xylophagous, mycetophagous, predators, parasites, parasitoids, detritivorous, etc.) and habitats (Speight, 1989). The elusive larval stages are generally poorly known and associated with specific microhabitats, that are often localized, rare and isolated (Stokland et al., 2012). In contrast, the adults of some species are easily observed during specific times of the year and the majority of faunistic data generally is
gathered by observing adults. Here we test if the data gathered in two years during a citizen science project (Project LIFE NAT11/IT/000,252 MIPP Monitoring of Insects with Public Participation, Mason et al., 2015) provide accurate information on the Italian distribution of three pan European saproxylic beetle species protected under the Habitats Directive: Lucanus cervus, Morimus asper/funereus and Rosalia alpina. In this paper we test if a CS project can provide reliable data on the distribution of saproxylic beetles, by quantifying the effort of participation by citizens and by estimating the accuracy of identification of the species. Moreover, we test if the data collected during two years by a citizen science project (CSD) allows to reliably draw distribution maps, when compared to national inventory data (NID) gathered over longer periods (10–25 years). We also analysed if the CSD added new information on the distribution of the species. Finally, we explore if CSD are suitable for assessing the Red List Status of species by comparing the extent of occurrence and the area of occupancy obtained with CSD and NID. 2. Materials and methods 2.1. Species selection We selected three pan European beetle species (L. cervus, M. asper/ funereus and R. alpina) that are charismatic representatives of the saproxylic guild (Drag et al., 2011). Solano et al. (2013) found that the 2 species M. asper and M. funereus actually belong to the same species, thus here we adopted the name M. asper/funereus and we considered the distribution of the species as defined by Solano et al. (2013). The three target species are easily recognizable, relatively large (15– 83 mm), appealing, and have been considered flagship species (Duelli and Wermelinger, 2005; Lachat et al., 2013; Rink and Sinsch, 2007; Russo et al., 2015). Furthermore the conservation of these species is enforced by the Habitats Directive, which lists them in the Annexes II (L. cervus, M. funereus, R. alpina), IV (R. alpina) and as priority species (R. alpina). Additionally, they are classified as Least Concern (L. cervus, M. asper), Near Threatened (R. alpina) and Vulnerable (M. funereus) in the national IUCN Red List (Carpaneto et al., 2015). Habitats of the above species range from urban remnants of historic woodland (L. cervus) to well preserved old-growth forests (R. alpina). The distribution of these saproxylic beetles depends on the availability of dead wood, a resource which has been dramatically reduced by forestry (Müller and Bütler, 2010). 2.2. Data collection We compared two Italian datasets. CSD were collected during two years (2014–2015) within the MIPP project (Mason et al., 2015). This project represents the first attempt to collect records of saproxylic beetles listed in the Annexes of the Habitats Directive (European Union, 1992) by employing a website and a mobile app. Citizens used these tools to send records of the target species, which were accompanied by a photograph that allowed validation by experts. Coordinates were specified using GPS data (mobile app) or online mapping tools (website). We considered all records received before the 27th September 2015. NID was derived from the dataset CKmap (Stoch, 2005), based on data collected by experts on more than 10,000 terrestrial and freshwater species, mapped on the UTM 10 km2 grid. CKmap is a database developed to study national distributions, allowing the identification of biodiversity hotspots (Ruffo and Stoch, 2006). For our study, we selected the records for the three target species, retaining only those that had precise coordinates (precision A). 2.3. Data analysis For the three species, we compared the distributions obtained by means of CSD and NID (all records, no time restrictions), using the
Please cite this article as: Zapponi, L., et al., Citizen science data as an efficient tool for mapping protected saproxylic beetles, Biological Conservation (2016), http://dx.doi.org/10.1016/j.biocon.2016.04.035
L. Zapponi et al. / Biological Conservation xxx (2016) xxx–xxx
3
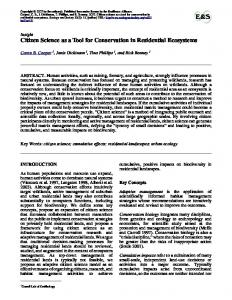
Fig. 1. Range maps for the three species L. cervus, R. alpina and M. asper/funereus, showing the records of the CSD (citizen science data, white) and the NID (national inventory data, grey) and the grid cells with shared data (black).
UTM 10 km2 grid. The difference between the number of occupied cells obtained with the two sets was tested with the chi-squared test (with Holm adjustment for multiple comparisons). We calculated the number of shared cells and how much CSD expanded the range of the species when compared to the NID. Furthermore, we used the species with the most complete set of NID, L. cervus, to investigate the potential of CS to gather distributional data in the short term. To do so we compared CSD (2014–2015) with NID (total) and with two subsets of NID: data gathered during 25 years (1979–2003) and during 10 years (1994– 2003). To estimate the area occupied by the species according to these data sets, we calculated the α-hulls with the R package alphahull (Pateiro-López and Rodriguez-Casal, 2010). Compared to traditional convex hulls, α-hulls provide an explicit means for excluding discontinuities within a species range, allowing more robust estimates (Burgman and Fox, 2003). As suggested by the IUCN Standards and Petitions Subcommittee (2014), we fixed the parameter α = 2. Finally, to verify how effectively CSD might be used for range estimations for the Red List threat assessment, we used the open source tool GeoCAT (Bachman et al., 2011) to derive the extent of occurrence (EOO) and the area of occupancy (AOO), measures on which the criterion B of the IUCN assessment is based. GeoCAT uses the quickhull algorithm (Bykat, 1978) to derive the convex hull (minimum convex polygon with no internal angle exceeding 180°) that determined the EOO, while AOO is obtained as the sum of 2 km2 cells (unit recommended by the IUCN guidelines) occupied by the species (AOO = number of occupied cells ∗ area of individual cell).
saproxylic beetle species considered in this paper, for which a total of 607 records were gathered (L. cervus = 302; M. asper/funereus = 240; R. alpina = 65) from a total of 236 citizens. Participation increased over the two years both in terms of the number of citizens involved (2014 = 99; 2015 = 157) and records sent (2014 = 248; 2015 = 359) and this trend held for all three species (citizens involved: L. cervus = 58 in 2014, 69 in 2015; M. asper/funereus = 53 in 2014, 91 in 2015; R. alpina = 14 in 2014, 31 in 2015; records sent: L. cervus = 143 in 2014, 159 in 2015; M. asper/funereus = 87 in 2014, 153 in 2015; R. alpina = 18 in 2014, 47 in 2015). The efficacy of the tools was confirmed by the high number of correct species identifications (L. cervus = 82.1%; M. asper/funereus = 83.8%; R. alpina = 96.9%) and remained stable over time for M. asper/funereus (2014 = 85.1%; 2015 = 83.0%, Χ2 = 0.171, df = 1, p = 0.679) and R. alpina (2014 = 94.4%; 2015 = 97.9%, Χ2 = 513, df = 1, p = 0.474), while this value decreased slightly for L. cervus (2014 = 87.4%; 2015 = 77.4%, Χ2 = 5.183, df = 1, p = 0.023). The range maps obtained with the two datasets (CSD and NID, Fig. 1) showed a low overlap of occupied cells for all three species (Table 1). The two most widespread species (L. cervus and M. asper/funereus) showed the lowest number of shared cells (8–9%) and the difference between the number of occupied cells for CSD and NID was statistically significant (Χ2 = 13.811, df = 1, p b 0.001 for L. cervus and Χ2 = 11.639, df = 1, p = 0.001 for M. asper/funereus). For the old-growth forest specialist species (R. alpina) the number of occupied cells obtained
3. Results During 2014–2015, 374 citizens participated in the MIPP project, contributing 1089 records for the nine target species (Osmoderma eremita, L. cervus, Cerambyx cerdo, R. alpina, M. asper/funereus, Zerynthia polyxena/cassandra, Parnassius apollo, Lopinga achine and Saga pedo). The number or records received was particularly high for the three
Table 1 Number of grid cells (10 × 10 km grid) with presence data for the three species with the percentage of shared cells and the range expansion resulting from joining CSD (citizen science data) and NID (national inventory data). Species
CSD
NID
Shared
Range expansion
Lucanus cervus Morimus asper/funereus Rosalia alpina
147 139 31
218 202 47
8% 9% 15%
24% 36% 31%
Fig. 2. Number of grid cells where presence of L. cervus is recorded, for the CSD (citizen science data) and for the NID (national inventory data) considering the following time intervals: one year of CSD (CSD 2014 and CSD 2015), two years of CSD (CSD Total), 10 years (NID 1994–2003), 25 years (NID 1979–2003) and all the NID (NID Total). Total number of cells (Total, dark grey) and number of cells not shared with the other datasets (Unique, light grey).
Please cite this article as: Zapponi, L., et al., Citizen science data as an efficient tool for mapping protected saproxylic beetles, Biological Conservation (2016), http://dx.doi.org/10.1016/j.biocon.2016.04.035
4
L. Zapponi et al. / Biological Conservation xxx (2016) xxx–xxx
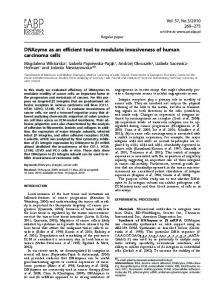
Fig. 3. L. cervus α-hulls for the different sets of data: a) all NID (national inventory data) (19,761 km2), b) 25 years of NID 1979–2003 (16,370 km2), c) 10 years of NID 1994–2003 (12,926 km2) and d) two years of CSD (citizen science data) 2014–2015 (12,623 km2).
with the two datasets did not significantly differ (Χ2 = 3.282, df = 1, p = 0.071) and the number of shared cells was higher (15%). For all three species, joining the two datasets resulted in a considerable increase in the number of cells where the presence of these species is known and their ranges increased by 24% to 36% (Table 1). The comparison of the four data sets for L. cervus confirmed the low number of shared cells. The number of cells present uniquely in the dataset considered varied between 82 and 85% for NID and between 42%–73% for CSD (Fig. 2). The range extension estimated with the αhulls was maximum for the total NID (19,761 km2). The area derived with the α-hulls based on 10 years NID (12,926 km2) and CSD (12,623 km2) was comparable (Fig. 3). When analysing the parameters used for the assessment of the Red List threat status (criteria B) with the different data sets for L. cervus (Fig. 4), the categories associated with the AOO obtained with only one year of CSD and 10 years of NID (Table 2) resulted in a misleading increase in the extinction risk, placing the species in the category Endangered (EN). However, the AOO obtained when analysing CSD from two years resulted in the category Vulnerable (VU), which was also obtained when using the total NID and 25 years of NID.
4. Discussion In an era of global change, rapid assessments are necessary to obtain reliable and up to date data of spatial distributions for large geographic ranges, which are crucial to implement conservation measures (Mücher et al., 2009; Ricciardi et al., 2000). Unfortunately, appropriate intense monitoring is often impossible because of resource limitations, in particular the paucity of funding and the low number of personnel. As a consequence, most databases are incomplete and often out-dated especially for rare and protected species. This applies particularly to many invertebrate species, for which reliable and up to date distributional
data are dramatically lacking, despite their ecological importance and often poor conservation status. In the new millennium CS emerged as a promising solution to this issue and has the potential to supplement scarce resources (Delaney et al., 2008; Fore et al., 2001; Lodge et al., 2006). Comparing NID data with CSD data collected for three saproxylic beetles during the MIPP project we demonstrate that CS may represent a fast, reliable and informative tool to map distributional ranges of protected insect species. In the short time frame of only two years, CS supplied range size estimates comparable (in terms of α-hull area) to those obtained with 10 years of NID. This result not only corroborates the efficacy of the CS method, but also its reliability. Moreover, the lack of shared cells between the two datasets and the high amount of cells present exclusively in the CSD highlights the importance of the records provided by citizens. Citizen might find the target species in areas which would not have been considered by experts. Another important aspect of our analysis is the fact that CSD were found to be effective in evaluating the criteria B of the Red List assessment. These criteria are used together with others to establish the final classification into threat categories. The use of CSD requires great care and good knowledge of the limitation of the data. In particular, quality assurance and data validation, through compliance with rigorous scientific methodology, are necessary steps for the scientific community to accept and utilize the data collected by citizen scientists (Boudreau and Yan, 2004; Delaney et al., 2008). We found that photographic documentation was sufficient to validate the correctness of the species identity. This allowed the general public to confidently and actively participate in conservation research. This approach provided sufficient CSD to obtain reliable, fast and informative distribution maps even for elusive saproxylic insect species. The accuracy of citizen reports was overall high, with very high values for the most distinctive species, such as R. alpina, where b5% of reports were invalid. The slightly decrease observed in accuracy for L. cervus over two years (from 87 to 77%) is likely due to the increase of dissemination activities
Please cite this article as: Zapponi, L., et al., Citizen science data as an efficient tool for mapping protected saproxylic beetles, Biological Conservation (2016), http://dx.doi.org/10.1016/j.biocon.2016.04.035
L. Zapponi et al. / Biological Conservation xxx (2016) xxx–xxx
5
Fig. 4. Extent of occurrence (EOO) for L. cervus, obtained using CSD (citizen science data) and NID (national inventory data): a) all NID; b) 25 years (1979–2003) of NID; c) 10 years (1994–2003) of NID; d) two years (2014–2015) of CSD; e) one year (2014) of CSD; f) one year (2015) of CSD.
in Central and Southern Italy, where the sister species Lucanus tetraodon occurs. Thus, the increase in dissemination activities allowed to recruit more citizen scientists but also resulted in a slight decrease in accuracy for one species. Invertebrates have been monitored by volunteers since the second half of the last century but the CS approach has been widely used only recently (van Swaay et al., 2013; Gustafsson et al., 2015). Many projects have been able to collect large amounts of data on invertebrates, thanks also to new technologies (e.g. van Swaay et al., 2013; Riservato et al., 2014) and were able to address conservation issues (van Swaay et al., 2013; Termaat et al., 2015). These technologies, such as mobile apps, are giving a new impulse to citizen science in terms of volunteers reached, motivation, data management, speed of data delivering, and feedbacks (Newman et al., 2012; Roy et al., 2012; Teacher et al., 2013). Our results corroborate these points and underline the efficacy of the approach used in the MIPP project, which employs a dedicated homepage and mobile apps for the data collection process by means of citizen scientists. Table 2 Extent of Occurrence (EOO) and Area of Occupancy (AOO) for L. cervus obtained from the different sets of data. IUCN categories of threat: least concern (LC), vulnerable (VU), endangered (EN).
CSD 2014 CSD 2015 CSD total NID 10 years NID 25 years NID total
EOO (km2)
EOO Category
AOO (km2)
AOO category
140,560.75 133,657.90 144,720.61 156,179.15 174,395.39 219,933.17
LC LC LC LC LC LC
372.000 324.000 656.000 260.000 544.000 980.000
EN EN VU EN VU VU
4.1. Limits and potential of NID and CSD in supporting conservation measures The NID used in the present study represents the only and most complete database of animal distributional data in Italy. It consists of records from museum specimens and sightings by experts: two sources that tend to include data collected opportunistically. The limits associated with using data from collections to develop distribution ranges are that: they may include mainly easy-to-study species (i.e. taxonomical bias), be the result of only one survey (i.e. temporal bias) and favour easily accessible areas (i.e. geographical bias) (Funk and Richardson, 2002). The latter bias may affect CSD as well: if the CS program does not include an appropriate geographical protocol, data collection might be biased because of uneven distributions of data in space and time (Hochachka et al., 2012). The opportunistic data derived from museum collections may contain false presences, and the derived ranges would ignore the fact that distributions are dynamic because of species' dispersal and changed environmental conditions (Rondinini and Boitani, 2012). Furthermore, the NID for two of the species considered (M. asper/funereus and R. alpina) did not contain precise information on the year of the observation, possibly because in the data base the year of observation and the year of data entry were confused. This error limits the usefulness of the data. Even if our critics on NID describe a local scenario, the presented application of CSD could have a global relevance. The strengths of CS approaches are: (1) the collection of data over a broad geographical range and with small grain and (2) the scale of projects can become global by combining individual programs (Hochachka et al., 2012). The fine-scale data obtained with CS programs could be effectively
Please cite this article as: Zapponi, L., et al., Citizen science data as an efficient tool for mapping protected saproxylic beetles, Biological Conservation (2016), http://dx.doi.org/10.1016/j.biocon.2016.04.035
6
L. Zapponi et al. / Biological Conservation xxx (2016) xxx–xxx
used to build models of (meta) population persistence for insects (Cabeza et al., 2010). If CS programs entail properly designed surveys, they have the potential of gathering stratified and precise data (e.g. Bird et al., 2014; Sequeira et al., 2014), that would allow to reliably cover species ranges, fundamental for the development of conservation strategies (Boitani et al., 2011). If supported by appropriate communication, coordination and data validation, CS programs can provide data with a reasonable economic investment (Tulloch et al., 2013). Our data collection was supported by LIFE, a financial instrument of the European Union. Therefore the MIPP project has a limited duration. However we will apply for other funding in order to continue this CS project, to include more target species and to implement conservation measures in areas identified by the CSD. Updated, reliable and comparable biodiversity data is necessary to implement international conservation policy (Schmeller et al., 2015). However, the paucity of data and the lack of standardised surveys reduce the potential of spatial prioritization (Boitani et al., 2011). Schmeller et al. (2015) note that even extensive infrastructures, such as the Global Biodiversity Information Facility (GBIF), can only provide raw occurrence records without a timeframe or habitat description of where the observation took place. The Target 11 of the Convention on Biological Diversity's (CBD's) Strategic Plan for Biodiversity 2011–2020 (UNEP/CBD, 2010) states that “By 2020, at least 17 per cent of terrestrial and inland water areas, and 10% of coastal and marine areas (…) are conserved through effectively and equitably managed, ecologically representative and well connected systems of protected areas and other effective area-based conservation measures, and integrated into the wider landscapes and seascapes”. This ambitious goal would require the integration of national and international priorities to ensure the effectiveness of conservation efforts (Moilanen et al., 2013). CS could contribute to gathering the data needed to establish such priorities and to monitoring the conservations status of the protected species. Thus, the challenge for the future is the establishment of well coordinated and statistically sound CS programs which complement other monitoring programs, especially for assessing elusive insect species of conservation concern. Last but not least, these CS initiatives are valuable not only because they allow to collect many records for scientific analysis, but they also give a positive feedback to the public. The people involved benefit from the hands-on learning experiences (Bonney and Dhondt, 1997; Fore et al., 2001) and public awareness is amplified by the CS approach (Gustafsson et al., 2015). Our project, which focused on saproxylic beetles, not only increased awareness on the status of these flagship species, but also lead to appreciate the importance of the resources on which these species rely, dead wood and old-growth forests. Acknowledgements Present work was developed within the EU project LIFE11 NAT/ IT/000252 MIPP “Monitoring Insects with Public Participation”, with the contribution of the LIFE financial instrument of the European Union. The authors thank citizen scientists that participated in the project and all the MIPP staff. We are grateful to two anonymous reviewers who provided valuable comments on an earlier version of the manuscript. References Bachman, S., Moat, J., Hill, A., de la Torre, J., Scott, B., 2011. Supporting red list threat assessments with GeoCAT: geospatial conservation assessment tool. Zookeys 150, 117–126. http://dx. doi.org/10.3897/zookeys.150.2109. Bellard, C., Bertelsmeier, C., Leadley, P., Thuiller, W., Courchamp, F., 2012. Impacts of climate change on the future of biodiversity. Ecol. Lett. 15, 365–377. http://dx.doi.org/10.1111/j. 1461-0248.2011.01736.x. Bird, T.J., Bates, A.E., Lefcheck, J.S., Hill, N.A., Thomson, R.J., Edgar, G.J., Stuart-Smith, R.D., Wotherspoon, S., Krkosek, M., Stuart-Smith, J.F., Pecl, G.T., Barrett, N., Frusher, S., 2014. Statistical solutions for error and bias in global citizen science datasets. Biol. Conserv. 173, 144–154. http://dx.doi.org/10.1016/j.biocon.2013.07.037.
Boitani, L., Maiorano, L., Baisero, D., Falcucci, A., Visconti, P., Rondinini, C., 2011. What spatial data do we need to develop global mammal conservation strategies? Philos. Trans. R. Soc. B Biol. Sci. 366, 2623–2632. http://dx.doi.org/10.1098/rstb.2011.0117. Bonney, R., Dhondt, A., 1997. FeederWatch. In: Cohen, K. (Ed.), Internet Links for Science Education SE - 4Innovations in Science Education and Technology. Springer, US, pp. 31–53 http:// dx.doi.org/10.1007/978-1-4615-5909-2_4. Boudreau, S.A., Yan, N.D., 2004. Auditing the accuracy of a volunteer-based surveillance program for an aquatic invader bythotrephes. Environ. Monit. Assess. 91, 17–26. http://dx.doi.org/10. 1023/B:EMAS.0000009228.09204.b7. Braschler, B., 2009. Successfully implementing a citizen-scientist approach to insect monitoring in a resource-poor country. Bioscience 59, 103–104. http://dx.doi.org/10.1525/bio.2009.59.2.2. Burgman, M.A., Fox, J.C., 2003. Bias in species range estimates from minimum convex polygons: implications for conservation and options for improved planning. Anim. Conserv. 6, 19–28. http://dx.doi.org/10.1017/S1367943003003044. Bykat, A., 1978. Convex hull of a finite set of points in two dimensions. Inf. Process. Lett. 7, 296–298. http://dx.doi.org/10.1016/0020-0190(78)90021-2. Cabeza, M., Arponen, A., Jäättelä, L., Kujala, H., van Teeffelen, A., Hanski, I., 2010. Conservation planning with insects at three different spatial scales. Ecography (Cop.) 33, 54–63. http:// dx.doi.org/10.1111/j.1600-0587.2009.06040.x. Cardoso, P., 2012. Habitats directive species lists: urgent need of revision. Insect Conserv. Diver. 5, 169–174. http://dx.doi.org/10.1111/j.1752-4598.2011.00140.x. Cardoso, P., Borges, P.A.V., Triantis, K.a., Ferrández, M.a., Martín, J.L., 2011a. Adapting the IUCN Red List criteria for invertebrates. Biol. Conserv. 144, 2432–2440. http://dx.doi.org/10. 1016/j.biocon.2011.06.020. Cardoso, P., Erwin, T.L., Borges, P.A.V., New, T.R., 2011b. The seven impediments in invertebrate conservation and how to overcome them. Biol. Conserv. 144, 2647–2655. http://dx.doi.org/ 10.1016/j.biocon.2011.07.024. Carpaneto, G.M., Baviera, C., Biscaccianti, A.B., Brandmayr, P., Mazzei, A., Mason, F., Battistoni, A., Teofili, C., Rondinini, C., Fattorini, S., Audisio, P., 2015. A Red List of Italian Saproxylic Beetles: taxonomic overview, ecological features and conservation issues (Coleoptera). Fragm. Entomol. 47, 53–126. http://dx.doi.org/10.4081/fe.2015.138. Clark, J.A., May, R.M., 2002. Taxonomic bias in conservation research. Science 297, 191–192. Cohn, J.P., 2008. Citizen science: can volunteers do real research? Bioscience 58, 192. http://dx. doi.org/10.1641/B580303. Coops, N.C., Catling, P.C., 1997. Utilising airborne multispectral videography to predict habitat complexity in eucalypt forests for wildlife management* further information about this research can be found on the world wide web at http://www.ffp.csiro.au/nfm/mdq. Wildl. Res. 24, 691–702. Costanza, R., d'Arge, R., de Groot, R.S., Farber, S., Grasso, M., Hannon, B., Limburg, K., Naeem, S., O'Neill, R.V., Paruelo, J., Raskin, R.G., Sutton, P., van den Belt, M., 2007. The value of the world's ecosystem services and natural capital. Nature 387, 253–260. Dawson, T.P., Jackson, S.T., House, J.I., Prentice, I.C., Mace, G.M., 2011. Beyond predictions: biodiversity conservation in a changing climate. Science 332, 53–58. http://dx.doi.org/10.1126/ science.1200303. Delaney, D.G., Sperling, C.D., Adams, C.S., Leung, B., 2008. Marine invasive species: validation of citizen science and implications for national monitoring networks. Biol. Invasions 10, 117–128. http://dx.doi.org/10.1007/s10530-007-9114-0. Devictor, V., Whittaker, R.J., Beltrame, C., 2010. Beyond scarcity: citizen science programmes as useful tools for conservation biogeography. Divers. Distrib. 16, 354–362. http://dx.doi.org/ 10.1111/j.1472-4642.2009.00615.x. Dickinson, J.L., Zuckerberg, B., Bonter, D.N., 2010. Citizen science as an ecological research tool: challenges and benefits. Annu. Rev. Ecol. Evol. Syst. 41, 149–172. http://dx.doi.org/10.1146/ annurev-ecolsys-102209-144636. Dickinson, J.L., Shirk, J., Bonter, D., Bonney, R., Crain, R.L., Martin, J., Phillips, T., Purcell, K., 2012. The current state of citizen science as a tool for ecological research and public engagement. Front. Ecol. Environ. 10, 291–297. http://dx.doi.org/10.1890/110236. Dormann, C.F., 2007. Promising the future? Global change projections of species distributions. Basic Appl. Ecol. 8, 387–397. http://dx.doi.org/10.1016/j.baae.2006.11.001. Drag, L., Hauck, D., Pokluda, P., Zimmermann, K., Cizek, L., 2011. Demography and dispersal ability of a threatened saproxylic beetle: a mark-recapture study of the Rosalia Longicorn (Rosalia alpina). PLoS One 6, e21345. http://dx.doi.org/10.1371/journal.pone.0021345. Duelli, P., Wermelinger, B., 2005. Der Alpenbock (Rosalia alpina), Einseltener BockkäferalsFlaggschiff-Art, Eidg. Forschungsanstalt WSL, CH-8903 Birmensdorf (ISSN 1422-2876). European Union, 1992. Council directive 92/43/EEC 1992 on the conservation of natural habitats and of wild flora and fauna. Int. J. Eur. Communities L206, 7–49. Fore, L.S., Paulsen, K., O'Laughlin, K., 2001. Assessing the performance of volunteers in monitoring streams. Freshw. Biol. 46, 109–123. http://dx.doi.org/10.1046/j.1365-2427.2001.00640.x. Funk, V. a, Richardson, K.S., 2002. Systematic data in biodiversity studies: use it or lose it. Syst. Biol. 51, 303–316. http://dx.doi.org/10.1080/10635150252899789. Gustafsson, K.M., Agrawal, A.A., Lewenstein, B. V, Wolf, S.A., 2015. The monarch butterfly through time and space: the social construction of an icon. Bioscience (biv045). Haslett, J.R., 2007. European Strategy for the Conservation of Invertebrates. Council of Europe. Hijmans, R., Graham, C., 2006. The ability of climate envelope models to predict the effect of climate change on species distributions. Glob. Chang. Biol. 12, 2272–2281. http://dx.doi.org/ 10.1111/j.1365-2486.2006.01256.x. Hochachka, W.M., Fink, D., Hutchinson, R. a, Sheldon, D., Wong, W.-K., Kelling, S., 2012. Dataintensive science applied to broad-scale citizen science. Trends Ecol. Evol. 27, 130–137. http://dx.doi.org/10.1016/j.tree.2011.11.006. IUCN Standards and Petitions Subcommittee, 2014. Guidelines for Using the IUCN Red List Categories and Criteria, Version 11.0. IUCN, Gland, Switzerland, and Cambridge, United Kingdom (Available at http://www.iucnredlist.org/documents/RedListGuidelines.pdf). Keith, D.A., Akçakaya, H.R., Thuiller, W., Midgley, G.F., Pearson, R.G., Phillips, S.J., Regan, H.M., Araújo, M.B., Rebelo, T.G., 2008. Predicting extinction risks under climate change: coupling stochastic population models with dynamic bioclimatic habitat models. Biol. Lett. 4, 560–563. Kremen, C., Colwell, R.K., Erwin, T.L., Murphy, D.D., Noss, R.F., Sanjayan, M.a., 1993. Terrestrial arthropod their use in assemblages: conservation planning. Conserv. Biol. 7, 796–808. Lachat, T., Ecker, K., Duelli, P., Wermelinger, B., 2013. Population trends of Rosalia alpina (L.) in Switzerland: a lasting turnaround? J. Insect Conserv. 17, 653–662. http://dx.doi.org/10. 1007/s10841-013-9549-9.
Please cite this article as: Zapponi, L., et al., Citizen science data as an efficient tool for mapping protected saproxylic beetles, Biological Conservation (2016), http://dx.doi.org/10.1016/j.biocon.2016.04.035
L. Zapponi et al. / Biological Conservation xxx (2016) xxx–xxx Lodge, D.M., Williams, S., MacIsaac, H.J., Hayes, K.R., Leung, B., Reichard, S., Mack, R.N., Moyle, P.B., Smith, M., Andow, D.A., Carlton, J.T., McMichael, A., 2006. Biological invasions: recommendations for U.S. policy and management. Ecol. Appl. 16, 2035–2054. http://dx.doi.org/10.1890/ 1051-0761(2006)016[2035:BIRFUP]2.0.CO;2. Lomolino, M.V., 2004. Conservation biogeography. In: Lomolino, M.V., Heaney, L.R. (Eds.), Frontiers of Biogeography: New Directions in the Geography of Nature. Sinauer Associates, Sunderland, Massachusetts, pp. 293–296. MacKinney, M.L., 1999. High rates of extinction and threat in poorly studied taxa. Conserv. Biol. 13, 1273–1281. Margules, C.R., Pressey, R.L., 2000. Systematic conservation planning. Nature 405 (6783), 243–253. http://dx.doi.org/10.1038/35012251. Mason, F., Roversi, P.F., Audisio, P., Bologna, M.A., Carpaneto, G.M., Antonini, G., Mancini, E., Sabbatini Peverieri, G., Mosconi, F., Solano, E., Maurizi, E., Maura, M., Chiari, S., Sabatelli, S., Bardiani, M., Toni, I., Redolfi De Zan, L., Rossi de Gasperis, S., Tini, M., Cini, A., Zauli, A., Nigro, G., Bottacci, A., Hardersen, S., Campanaro, A., 2015. Monitoring of insects with public participation (MIPP; EU LIFE project 11 NAT/IT/000252): overview on a citizen science initiative and a monitoring programme (Insecta: Coleoptera; Lepidoptera; Orthoptera). Fragm. Entomol. 47 (1), 51–52. Moilanen, A., Anderson, B.J., Arponen, A., Pouzols, F.M., Thomas, C.D., 2013. Edge artefacts and lost performance in national versus continental conservation priority areas. Divers. Distrib. 19, 171–183. http://dx.doi.org/10.1111/ddi.12000. Moir, M.L., Vesk, P.A., Brennan, K.E.C., Keith, D.A., Hughes, L., MacCarthy, M.A., 2010. Current constraints and future directions in estimating coextinction. Conserv. Biol. 24, 682–690. Mücher, C.a., Hennekens, S.M., Bunce, R.G.H., Schaminée, J.H.J., Schaepman, M.E., 2009. Modelling the spatial distribution of Natura 2000 habitats across Europe. Landsc. Urban Plan. 92, 148–159. http://dx.doi.org/10.1016/j.landurbplan.2009.04.003. Müller, J., Bütler, R., 2010. A review of habitat thresholds for dead wood: a baseline for management recommendations in European forests. Eur. J. For. Res. 129, 981–992. http://dx.doi.org/10. 1007/s10342-010-0400-5. New, T.R., 1999. Untangling the web: spiders and the challenges of invertebrate conservation. J. Insect Conserv. 3, 251–256. Newell, G.R., 1997. The abundance of ground-dwelling invertebrates in a Victorian forest affected by “dieback” (Phytophthora cinnamomi) disease. Aust. J. Ecol. 22, 206–217. http:// dx.doi.org/10.1111/j.1442-9993.1997.tb00660.x. Newman, G., Wiggins, A., Crall, A., Graham, E., Newman, S., Crowston, K., 2012. The future of citizen science: emerging technologies and shifting paradigms. Front. Ecol. Environ. 10, 298–304. http://dx.doi.org/10.1890/110294. Oliver, I., Pik, A., Britton, D., Dangerfield, J.M., Colwell, R.K., Beattie, A.J., 2000. Virtual biodiversity assessment systems. Bioscience 50, 441–450. http://dx.doi.org/10.1641/0006-3568(2000) 050[0441:VBAS]2.0.CO;2. Pateiro-López, B., Rodriguez-Casal, A., 2010. Generalizing the convex hull of a sample: the R package alphahull. J. Stat. Softw. 34, 1–28. Pereira, H.M., Leadley, P.W., Proença, V., Alkemade, R., Scharlemann, J.P.W., FernandezManjarrés, J.F., Araújo, M.B., Balvanera, P., Biggs, R., Cheung, W.W.L., Chini, L., Cooper, H.D., Gilman, E.L., Guénette, S., Hurtt, G.C., Huntington, H.P., Mace, G.M., Oberdorff, T., Revenga, C., Rodrigues, P., Scholes, R.J., Sumaila, U.R., Walpole, M., 2010. Scenarios for global biodiversity in the 21st century. Science 330, 1496–1501. http://dx.doi.org/10.1126/ science.1196624. Ricciardi, A., Steiner, W.W., Mack, R.N., Simberloff, D., 2000. Toward a global information system for invasive species. Bioscience 50 (3), 239–244. Rink, M., Sinsch, U., 2007. Radio-telemetric monitoring of dispersing stag beetles: implications for conservation. J. Zool. 272, 235–243. http://dx.doi.org/10.1111/j.1469-7998.2006.00282.x. Riservato, E., Festi, A., Fabbri, R., Grieco, C., Hardersen, S., La Porta, G., Landi, F., Siesa, M.E., Utzeri, C., 2014. Odonata – Atlante delle libellule italiane – Preliminare. Società Italiana per lo Studio e la Conservazione delle Libellule, Edizione Belvedere, Latina. Rondinini, C., Boitani, L., 2012. Mind the map: trips and pitfalls in making and reading maps of carnivore distribution. Carniv. Ecol. Conserv. A Handb. Tech.Oxford Univ. Press, New York, pp. 31–46
7
Roy, H.E., Pocock, M.J.O., Preston, C.D., Savage, J., Tweddle, J.C., L.D.R., 2012. Understanding Citizen Science and Environmental Monitoring. p. 170. Ruffo, S., Stoch, F., 2006. Checklist and distribution of the Italian fauna Memorie del Museo Civico di Storia Naturale di Verona. Scienze della Vita 17, 1–301. Russo, D., Di Febbraro, M., Cistrone, L., Jones, G., Smeraldo, S., Garonna, A.P., Bosso, L., 2015. Protecting one, protecting both? Scale-dependent ecological differences in two species using dead trees, the rosalia longicorn beetle and the barbastelle bat. J. Zool. http://dx.doi. org/10.1111/jzo.12271 (n/a–n/a). Schmeller, D.S., Julliard, R., Bellingham, P.J., Böhm, M., Brummitt, N., Chiarucci, A., Couvet, D., Elmendorf, S., Forsyth, D.M., Moreno, J.G., Gregory, R.D., Magnusson, W.E., Martin, L.J., McGeoch, M.A., Mihoub, J.-B., Pereira, H.M., Proença, V., van Swaay, C.a.M., Yahara, T., Belnap, J., 2015. Towards a global terrestrial species monitoring program. J. Nat. Conserv. 25, 51–57. http://dx.doi.org/10.1016/j.jnc.2015.03.003. Sequeira, A.M.M., Roetman, P.E.J., Daniels, C.B., Baker, A.K., Bradshaw, C.J.A., 2014. Distribution models for koalas in South Australia using citizen science-collected data. Ecol. Evol. 4, 2103–2114. http://dx.doi.org/10.1002/ece3.1094. Silvertown, J., 2009. A new dawn for citizen science. Trends Ecol. Evol. 24, 467–471. http://dx. doi.org/10.1016/j.tree.2009.03.017. Solano, E., Mancini, E., Ciucci, P., Mason, F., Audisio, P., Antonini, G., 2013. The EU protected taxon Morimus funereus Mulsant, 1862 (Coleoptera: Cerambycidae) and its western Palaearctic allies: systematics and conservation outcomes. Conserv. Genet. 14, 683–694. http://dx. doi.org/10.1007/s10592-013-0461-3. Speight, M.C.D., 1989. Saproxylic Invertebrates and their Conservation. Nature and Environment Series 46Council of Europe, Strasbourg. Stoch, F., 2005. Checklist of the Species of the Italian Fauna. Italian Minisry of Environment, Territory Protection and Sea (Version 5.3.8, available online http://www.ckmap.faunaitalia.it/). Stokland, J.N., Siitonen, J., Jonsson, B.G., 2012. Biodiversity in Dead Wood. Cambridge University Press. Stork, N.E., Lyal, C.H.C., 1993. Extinction or ‘co-extinction’ rates? Nature 366 (6453), 307. Teacher, A.G.F., Griffiths, D.J., Hodgson, D.J., Inger, R., 2013. Smartphones in ecology and evolution: a guide for the app-rehensive. Ecol. Evol. 3, 5268–5278. http://dx.doi.org/10.1002/ece3.888. Termaat, T., van Grunsven, R.H.A., Plate, C.L., van Strien, A.J., 2015. Strong recovery of dragonflies in recent decades in The Netherlands. Freshw. Sci. 34, 1094–1104. Theobald, E.J., Ettinger, A.K., Burgess, H.K., DeBey, L.B., Schmidt, N.R., Froehlich, H.E., Wagner, C., HilleRisLambers, J., Tewksbury, J., Harsch, M.a., Parrish, J.K., 2015. Global change and local solutions: tapping the unrealized potential of citizen science for biodiversity research. Biol. Conserv. 181, 236–244. http://dx.doi.org/10.1016/j.biocon.2014.10.021. Thomas, J.A., Morris, M.G., 1994. Patterns, mechanisms and rates of extinction among invertebrates in the United Kingdom. Philos. Trans. R. Soc. Lond. B 344, 47–54. Tulloch, A.I.T., Possingham, H.P., Joseph, L.N., Szabo, J., Martin, T.G., 2013. Realising the full potential of citizen science monitoring programs. Biol. Conserv. 165, 128–138. http://dx.doi.org/ 10.1016/j.biocon.2013.05.025. UNEP/CBD, 2010. Decision adopted by the conference of parties to the convention on biological diversity at its tenth meeting. The Strategic Plan for Biodiversity 2011–2010 and the Aichi Biodiversity Targets (Available at: http://www.cbd.int/doc/decisions/COP-10/cop-10-dec02-en.pdf). van Swaay, C.A.M., Van Strien, A.J., Harpke, A., Fontaine, B., Stefanescu, C., Roy, D., Maes, D., Kühn, E., Õunap, E., Regan, E., Švitra, G., Heliölä, J., Settele, J., Pettersson, L.B., Botham, M., Musche, M., Titeux, N., Cornish, N., Leopold, P., Julliard, R., Verovnik, R., Öberg, S., Popov, S., Collins, S., Goloshchapova, S., Roth, T., Brereton, T., Warren, M.S., 2013. The European Butterfly Indicator for Grassland Species 1990–2011. European Environment Agency, Copenhagen. York, A., 1999. Ecologically sustainable management: the utility of habitat surrogates for assessing terrestrial invertebrate diversity in temperate forests. In: Ponder, W., Lunney, D. (Eds.), The Other 99%. The Conservation and Biodiversity of Invertebrates. Transactions of the Royal Society of New South Wales, Mosman, pp. 34–39. Zamin, T.J., Baillie, J.E.M., Miller, R.M., Rodríguez, J.O.N.P., Ardid, A.N.A., Collen, B.E.N., 2010. National red listing beyond the 2010 target. Conserv. Biol. 24 (4), 1012–1020. http://dx. doi.org/10.1111/j.1523-1739.2010.01492.x.
Please cite this article as: Zapponi, L., et al., Citizen science data as an efficient tool for mapping protected saproxylic beetles, Biological Conservation (2016), http://dx.doi.org/10.1016/j.biocon.2016.04.035