A Model for Matching and Integrating Heterogeneous Relational Biomedical Databases Schemas Yaser Karasneh1 Hamidah Ibrahim2 Mohamed Othman3 Razali Yaakob4 Department of Computer Science Faculty of Computer Science and Information Technology Universiti Putra Malaysia 43400 Serdang Selangar D. E., Malaysia 1
[email protected],
[email protected],
[email protected],
[email protected]
ABSTRACT
Keywords
Database integration aims at providing a uniform and consistent view called global schema, over a set of autonomous and heterogeneous data sources, so that data residing in different sources can be accessed as if it was in a single schema. The integration of data sources can be performed in two steps, a matching and a data transformation step. Schema matching, the focus of this paper, is a fundamental operation in the manipulation of schema in formatting match, which takes two schemas that correspond semantically to each other. Manually specifying schema matches is a tedious, time consuming, error-prone, and therefore expensive process, which is a growing problem given the rapidly increasing number of data sources to integrate. As systems become able to handle more complex databases and applications such as biomedical databases schemas, their schemas become large, further increasing the number of matches to be performed. Several solutions in solving the issues of schema matching have been proposed. However, these solutions are still limited as (i) they do not explore most of the available information related to schemas, (ii) the approaches rely strictly on the assumption that the schemas to be matched are from the same application domain, and (iii) the approaches either match schemas by comparing the strings of the elements’ names or by checking if those names are synonyms. This paper addresses the above limitations by proposing a model for matching heterogeneous relational biomedical databases’ schemas that further improves the results of the integration.
Database integration, Biomedical database.
1.
Schema
matching,
Heterogeneous,
INTRODUCTION
A database schema comprises the gross structure and constraints on the database. Database heterogeneities, or differences, can make access to information intricate. Thus, a heterogeneous database that unites various existing databases, which support different schemas and technologies, by providing a uniform database schema and querying capabilities is critically required. The process of integrating data from multiple, heterogeneous sources are called heterogeneous database integration [22]. This process is more tedious and difficult in biomedical databases due to the characteristics of biomedical data that are often scattered among multiple databases, have different schemas and are implemented with diverse technologies [12]. Schemas support declarative access to and manipulation of data, thus they represent the prime interface for establishing interoperability between tools that depend on shared data. The heterogeneous database integration, or simply database integration, aims at providing a uniform and consistent view, the so-called global schema, over a set of autonomous and heterogeneous data sources, so that data residing in different sources can be accessed as if it was in a single schema. In practice, data integration is often done incrementally by starting with a simple global schema and adding new data sources when needed. The integration of a new data source into an existing global schema can be performed in two steps, a matching and a data transformation step. In the first step, the source schemas are compared against each other to discover their similar and distinct elements. While the distinct elements and their instances can be taken over from the data source, the correspondences between the similar elements are needed in the second step to generate queries for transforming their instances from the source schema into the global schema [22].
Categories and Subject Descriptors H.2.4 [Database Management]: Systems – relational databases, transaction processing.
General Terms Algorithms, Management, Measurement, Performance. Permission to make digital or hard copies of all or part of this work for personal or classroom use is granted without fee provided that copies are not made or distributed for profit or commercial advantage and that copies bear this notice and the full citation on the first page. To copy otherwise, or republish, to post on servers or to redistribute to lists, requires prior specific permission and/or a fee. IDEAS 2009, September 16-18, Cetraro, Calabria [Italy] Editor: Bipin C. DESAI Copyright @2009 ACM 978-1-60558-402-7/09/09 $5.00
Schema matching is a basic problem in many database application domains, such as data integration. Schema matching is a fundamental operation in the manipulation of schema in formatting match, which takes two schemas that correspond semantically to each other. Schema matching is typically performed manually, perhaps supported by a graphical user interface. Manually specifying schema matches is a tedious, time
242
consuming, error-prone, and therefore expensive process, this is a growing problem given the rapidly increasing number of data sources to integrate. As systems become able to handle more complex databases and applications such as biomedical databases schemas, their schemas become large, further increasing the number of matches to be performed. The level of effort is at least linear in the number of matches to be performed, maybe worse than linear of one need to evaluate each match in the context of other possible matches of the same elements.
performance of the schema matching process. While research works such as [3, 8, 11] utilized auxiliary sources, for instance DBMS catalog, to get further descriptions of the entity/attribute names. To the best of our knowledge, [3] and [8] employed the most available information (name of element, description, instances, domain [3], data type [3], and key constraints [8]) compared to the others. Table 1 summarizes the previous works, based on the taxonomy proposed by [20]. Here, only those works focusing on relational model are presented.
This paper presents a model for matching heterogeneous relational biomedical databases’ schemas that further improves the results of the integration. We are more concerned in matching and integrating schemas of relational model since this model is the most dominant model and many database applications, especially applications for distributed environment are still adopting this model [7]. Due to its simple structure (table form), many users preferred to use this model such as the biomedical scientists where many existing biomedical databases for instance GeneCards, Health Information Resource Database, Stanford HIV Drug Resistance Database (HIV DB), and Chronus are developed based on this model [16].
From the Table 1, it is obvious that the previous studies are still limited due to the following reasons: (i) They do not explore most of the available information related to schemas. (ii) Their approaches rely strictly on the assumption that the schemas to be matched are from the same application domain. (iii) The method that they used to match schemas is either by comparing the strings of the elements’ names or by checking if those names are synonyms. This paper takes the challenge to address the above limitations in matching biomedical schemas where different biologists have the tendency to use different names in naming the elements of the schemas (schema names, attribute names) as well as assigning different data types and roles to an attribute of a schema.
The rest of the paper is organized as follows. Section 2 highlights the previous works related to the research. Emphasis is given to those research works focusing on relational model. Section 3 presents our proposed model while the achievement of the model is discussed in Section 4. Conclusions are presented in the final section, 5.
2.
3.
THE PROPOSED MODEL
Figure 1 presents our proposed model that consists of 3 main phases, namely: importing, matching, and integrating. The process of integrating multiple databases, D1, D2, …, DN, involves matching and integrating S1, S2, …, SN schemas where Si denotes the set of relation schemas of the database Di. The first phase imports these S1, S2, …, SN relation schemas into an internal dataset (internal database) with several random tuples, hence the next phases can be performed internally in the system.
RELATED WORK
The problem of schema matching can be formulated as follows, “given two schemas, S1 and S2, find the most plausible correspondences between the elements of S1 and S2, exploiting all available information, such as the schemas, instance data, and auxiliary sources” [24]. Schema matching has been explored by various researchers in various data models such as ER [17, 18], relational model [2, 3, 8, 11, 13, 19], and XML model [4, 5, 6, 9, 10, 15, 20, 21, 23].
The second phase is the matching phase. Exploring and using as much as possible the available information during the process of matching the schemas is important as mentioned in [20, 24]. This is because, the more information is utilized, the more accurate the results of the schema matching process. This can be seen in Dhamankar’s work [3], which achieved 43-92% accuracy on several real-world domains, thus demonstrating the promise of the approach as compared to the others.
Several solutions in solving the issues of schema matching have been proposed. In relational model, most of the approaches that concentrate on contributing solutions to the issues of schema matching exploit the element name of the schemas that include name of relation and name of attribute [2, 3, 8, 11, 13, 19]. Some of these research works such as [3, 11, 19] use the data type and the domain (constraint) of the attribute to improve the
Table 1. Summarization of Previous Schema Matching Approaches Element
Structure Linguistic Name Description
Data Type
Constraint Foreign Primary Key Key
Domain
DBMS Catalog √
-
√
√
-
√
-
-
√
-
-
√
√
-
-
[8]
Relational
1:1
-
Attribute
[3]
Relational
-
√
[19]
Relational, XML
m:n 1:1 and m:n
-
√ Attribute
-
√
-
-
-
√
1:1
-
√
-
-
-
-
-
√ (tuple)
-
Synonyms
√
√
-
-
-
-
-
-
-
-
√ (name of nodes)
√
Thesaurus
√
-
-
-
√
√
Synonyms, abbreviations
[2] [13]
[11]
Relational, RDF Relational, RDF and XML XML and Relational
1:1 and m:n 1:1 and m:n
243
Input N Databases
Matching Process
Importing Process Import N databases schemas
Integration Process
1. Domain application name. 2. Relation name. 3. Element name. 4. Instance data. 5. Data type. 6. Key constraints.
Integrate into global schema
DB1 DB 1R1
DB 1R2
Inter nal D atabase ( dataset)
...
DB 1
DB 2
DB 1
DB 3
DB 1
DB n
DB 2
DB 3
DB 1Rx DB 1 R1
DB2 DB 2R1
DB 1
DB 2
DB 1 R2
DB 1 Rx
DB 2 R1
DB 2 R2
DB 1& DB n DB 1
Db1& Db2
DB 2
DB 1& DB 3
70.69%
DB 2& DB n
...
DB 3
DB 3 R1
DB 3
DB 3& DB n
DB 3 R2 DB 3 Rz
DB3 DB 3R1
DB n R1
DB n
DB n R2
DB 2
...
DBn DB nR1
DB 3
DB n
A B’
A B’
D
E
C
DB n
DB n Rk
DB 3R2 DB 3Rz
DB 2
A’ B
DB 2 Ry
DB 2R2 DB 2Ry
DB 2& DB 3
DB 1
A B
DB 1& DB n
DB n
G lobal Schem a D B1
D B2
D B3
D Bn
D3
DB 2& DB 3 DB 1 & DB 2
68%
DB 1 & DB 3
60. 5%
...
...
A B
A’ B’
A B
C D
C’ D’
C D
DB n
DB nR2
G lobal D chem a
A
B
C
D
E
...
DB nRk
G lobal D atabase G S1
G S2 ... GS i
Figure 1. Schema Matching and Database Integration synonym method, which is the main idea of this process. Blending both methods produce correct results as opposed to applying either method as suggested by previous works. This benefit is clearly illustrated below.
With this argument, our model attempts to explore the various elements of relational database schemas during the matching process before the integration process can be realized. The matching process is divided into three main levels, namely matching the databases’ schemas based on the (i) application domain, (ii) name of schemas, and (iii) elements that include the name of attributes, data type, role of attributes, and instance data. At the second and third levels, the percentage of similarities and percentage of matched attributes are recorded.
(i)
Matching the databases’ schemas based on the application domain:
None of the previous works discover correspondences between schemas by comparing their application domain. As they depend on the assumption that the schemas to be matched are from the same application domain, thus their approaches are not general enough and are not fully automatic, i.e. user intervention is required to determine whether the schemas are from the same application domain or not before the schema matching process can take place. Otherwise, the matching process will produce incorrect results. Consequently, these results (matched schemas), which are the input to the integration process to derive global schemas, will influence the result of the integration, which undoubtedly are incorrect global schemas. This occurs when two schemas have almost the same attributes’ names but they are actually from different application domains.
Matching the databases’ schemas based on the application domain, the name of schemas and the name of attributes (element level) are accomplished using the following methods: (i) n-gram: strings compared according to their set of n-grams, i.e. sequences of n characters. An n-gram is sub-sequence of n items from a given sequence. The items in question can be letters, words or base pairs according to the application. The percentage of similarities between two elements, E1 and E2, is calculated based on the following formula, |2 x ∑t ∈ n-gram(E1) ∩ n-gram(E2)log P(t)| |∑t ∈ n-gram(E1)log P(t)| + |∑t ∈ n-gram(E2) log P(t)| where n-gram(E1) and n-gram(E2) are the sets of n-gram in E1 and E2, respectively, and P(t) is the probability of a ngram occurring in a word. (ii) synonym: words in different spelling but have the same meaning were known as synonym, which is part of an ontology. To search for the synonyms of words, a relative word table is used and it is created as sample in our model to show how the matching process is performed. This table includes biomedical terms and other general words in different vocabularies that are similar in meaning. The percentage of similarities is 100 if the terms compared exist as synonyms in the relative word table, 0 if the terms compared exist in the relative word table but not as synonyms, and ‘-‘ if one or both of the terms are not in the relative word table. After applying the n-gram method, the percentage of similarities between two words possibly will be improved using the
In our model, before the databases’ schemas are being integrated, it is important to ensure that the databases are from the same application domain. The databases to be integrated, D1, D2, …, DN, are compared to each other based on the name of the database schema. Here, we assume that the database creator has given meaningful name to the database as usual practice in database design. In analyzing the similarities between these databases’ schemas both the n-gram and synonym methods are applied. The results from each method (% of similarities) are analyzed. We observed that in some cases both methods produce the same results while in some cases they produce results that are contradict. Thus, rules to decide the final outcome are required, as shown in Table 2.
244
Table 2. Rules when Blending both n-gram and Synonym Methods Rul e
% of similarities based on n-gram
1 2 3 4 5 6 7
0 0 0 100 ≠ 100, ≠ 0 ≠ 100, ≠ 0 ≠ 100, ≠ 0
% of similarities based on synonym
Results
0 100 100 (by default) 0 100
Not match Check the relation schemas Match Match Not match Check the relation schemas Match
Our approach which blends both n-gram and synonym applies the rules as shown in Table 2 in order to decide whether two databases’ schemas are from the same application domain or not. The results of previous matches are also used before further matching is performed to reduce the number of comparisons. Those schemas that are identified to be in the same application domain are grouped into the same group. This is further elaborated in the following table.
% of similaritie s based on n-gram
% of similaritie s based on synonym
Result s based on n-gram
Results based on synonym
Gene and Gene_Produc t Gene and Genome Gene and Student Gene and Employee Gene and Cistron Cistron and Gene_Produc t Cistron and Genome Cistron and Employee Cistron and Student Gene_Produc t and Genome Gene_Produc t and Employee Gene_Produc t and Student Genome and Employee Genome and Student Employee and Student
46
-
Match
Not match
50
100
Match
Match
Match
16
0
Match
Not match
0
0
0
100
12
-
Not match Not match Match
Not match Not match Match Not match
Match
0
100
Match
Match
0
0 0
27
-
Match
0
-
Not match
Not match Not match Not match Not match
Not match
16
Not match Not match Match
10
-
Match
0
0
14
0
Not match Match
0
0
Not match
Not match Not match Not match Not match
% of similarities based on synonym
Rule applie d
Gene and Gene_Produc t Gene and Genome
46
-
6
50
100
7
Gene Student
and
16
0
5
Gene and Employee
0
0
1
Gene Cistron
0
100
3
Database schema
Furthermore, to reduce the number of comparisons, the databases that are identified to be from the same application domain are grouped together. Hence, if it is known that A and B are in the same group and comparing C and A results in C belonging to the same group as A, thus it is not wise to compare C to B. A database, which is not related to any of this group of databases, is discarded from the integration process. To clarify our argument, consider the following example. Assume that the following databases’ schemas are imported to the model: Gene, Gene_Product, Genome, Cistron, Student, and Employee. The results of applying the n-gram, synonym and combining both methods are depicted in the following table. From the results, we noticed that utilizing n-gram alone produces incorrect results for some cases, for example Gene and Student are considered as matched, while utilizing synonym alone will also produce incorrect results for some cases for instance Gene and Gene_Product are not considered as matched since the word Gene_Product does not exist in the dictionary (denoted by the symbol ‘-‘). Database schema
% of similarities based on n-gram
Results based on n-gram and synonym Match
and
Group
{Gene, Gene_Product } {Gene, Gene_Product, Genome} {Gene, Gene_Product, Genome} {Student} {Gene, Gene_Product, Genome} {Student} {Employee} {Gene, Gene_Product, Genome, Cistron} {Student} {Employee}
Results based on n-gram and synony m Match Match Not match Not match
Match
From the above results, our approach is able to identify that Gene, Gene_Product, Genome, and Cistron are from the same application domain while Employee and Student are considered not related to the biomedical domain. Note that only 5 comparisons are performed since based on the previous matches and the groups that have been generated, no further comparison is required. (ii) Matching the databases’ schemas based on the name of schemas:
Not match
Given p databases, D1, D2, …, Dp, that are from the same application domain, this level takes two databases at a time and compares each relation schema SkDi, of the database Di to each relation schema, SlDj, of the database Dj to identify the possible pair of schemas before they are integrated. Subsequently there are Ni × Nj comparisons where Ni (Nj, respectively) denotes the number of relation schemas in Di (Dj, respectively) between two databases. The comparison is based on the name of the relation schemas by utilizing both the n-gram and synonym methods. The percentage of similarities is calculated and the pair with the highest percentage is considered as the candidate for integration. The following table illustrates this idea. Here, we assume the database Gene consists of two relations, namely: Gene and Organism while the database Gene_Product consists of three relations, namely: GeneProduct, Chromo, and Species. Notice that six comparisons are performed as presented in Figure 2.
Match
Not match Match Not match Not match Not match Not match Not match
245
Schema A: Gene
Schema B: Gene_Product
Relation 1: Gene
Relation 1: GeneProduct
Relation 2: Organism
Relation 2: Chromo
Attributes of Gene
GID Ref Strend Organism Name Comments
Relation 3: Species
Figure 2. Matching the Gene and Gene_Product Databases Schemas of Gene database Relation 1: Gene Relation 1: Gene Relation 1: Gene Relation 2: Organism Relation 2: Organism Relation 2: Organism
Schemas of Gene_Product database Relation 1: GeneProduct Relation 2: Chromo Relation 3: Species Relation 1: GeneProduct Relation 2: Chromo Relation 3: Species
% of similarities based on n-gram
% of similarities based on synonym
46.5
0
% of similarities based on n-gram and synonym 46.5
0
0
0
0
0
0
0
0
0
0
0
0
0
100
100
Attributes of GeneProduct
% of similarities based on n-gram
ID DBxref DBxref Species Full_Name Full_Name
66 57 20 0 60 14
% of similarities based on synonym 0 0 0 100 0 0
% of similarities based on n-gram and synonym 66 57 20 100 60 14
Once a pair of attributes has been identified to have some similarities based on the attribute name matcher, it is not convinced enough to conclude that the pair of attributes should be merged as a single attribute. This is due to the fact that the attributes might have different data types or even different roles which prohibit both attributes to be merged as a single attribute even if the percentage of similarities identified by the attribute name matcher is 100. For this reason, the data type matcher is then applied to the pair of attributes followed by the constraint matcher. Data type matcher uses a synonym table specifying the degree of compatibility between a set of predefined generic data types. Table 3 presents the synonym table [25].
From the above example, utilizing only the n-gram method results in a single pair (Gene, GeneProduct) as the candidate for integration, while applying the synonym method alone produces the following pair (Organism, Species) as the candidate for integration. In our approach the pair (Gene, GeneProduct) and (Organism, Species) are candidate pairs for integration.
Table 3. Data Type Synonyms Binary varying char varying Character Character character( n ) character varying( n ) Dec Double precision float[(n)] for n = 1-7 float[(n)] for n = 8-15 Integer national character( n )
(iii) Matching the databases’ schemas based on the elements: Once two relation schemas are identified as similar, identifying the correspondences between these schemas at the attribute level is then performed. This level is responsible to identify whether two attributes from two different schemas are similar or not. If they are similar, they should be merged as a single attribute. This is important as it reduces the number of repeated attributes as well as the number of null values in the global schemas. Three types of matchers are applied, namely: attribute name matcher, data type matcher, and constraint matcher.
= = = = = = = = = = = =
Varbinary Varchar Char char(1) char(n) varchar(n) Decimal Float Real Float Int nchar(n)
The following table presents the results of applying the data type matcher to the above example. Here, the percentage of similarities is 100 if the pair of attributes is matched based on data type and 0 otherwise. Gene Relation Attribute Data Type GID Integer Organism Int Name Char Comments Varchar2 Ref Varchar2
The attribute name matcher takes two attributes at a time and calculates the percentage of similarities by utilizing the n-gram and synonym methods. The following example illustrates this process. Based on the results of the previous step, the attributes of the relation Gene, namely: GID, Organism, Name, CHRO, Ref, Nucl, Comments, and Strend are compared against the attributes of the relation GeneProduct, namely: ID, Symbol, DBxref, Species, Type, and Full_Name. Altogether there are 48 comparisons for this example but due to space limitation only those comparisons that indicate the existence of similarities between the attributes are shown in the following table. The pairs that are identified as similar are (GID, ID), (Ref, DBxref), (Strend, DBxref), (Organism, Species), (Name, Full_Name), and (Comments, Full_Name).
GeneProduct Relation Attribute Data Type ID Integer Species Integer Full_Name Char DBxref
Varchar2
Results
Match Match Match Not Match Match
From the above example, notice that although the pair (Strend, DBxref) is 20% similar as indicated by the attribute name matcher but since they have different data types, then they are considered as not matched. This reduces the number of pairs to be verified by the constraint matcher. The constraint matcher compares the roles of two similar attributes to check whether these attributes share the same constraints or not. Similar to the previous matcher, a pair of
246
attributes should be merged or not. None of the previous research works have considered these four elements together in their approach and this analysis is to confirm that it is important to consider these elements during the schema matching process. (ii) The second analysis presents the percentage of reduction in the number of attributes gained by our model as compared to previous approaches. (iii) The third analysis highlights the performance of our model with respect to the percentage of reduction in the number of null values in the databases.
attributes is matched if they have the same role (100% similarities) and not otherwise (0% similarities). This is shown by the following example. Gene Relation Attribute Constraint GID Primary Key Organism Foreign Key Name Ref Foreign Key
GeneProduct Relation Attribute Constraint ID Primary Key Species Foreign Key Full_Name DBxref Foreign Key
Results Match Match Match Match
As a result, the pairs that are identified as matched by the constraint matcher are the pairs that will be merged into a single attribute, while other attributes will remain in the original form.
4.1
The data type and constraint matchers introduced above are applied accordingly to the pairs of attributes that have been identified as similar by the attribute name matcher. There are also cases where a pair of attributes is detected as not similar by the attribute name matcher but these attributes have similarities with respect to the populated data in their columns. Here, the instance data matcher is applied to identify similarities of attributes based on their populated data. If it is found that there are similarities between the populated data then the pair of attributes are submitted to the data type and constraint matchers. The final decision as whether to merge the pair of attributes depends on the results from each of this matcher as discussed earlier. Figure 3 generalized the processes that we have discussed in this phase. Attribute Name Matcher (Ai, Aj) If matched then Data Type Matcher (Ai, Aj) Begin If matched then Constraint Matcher (Ai, Aj) If matched then merge (Ai, Aj) End Else Begin Instance Data Matcher (Ai, Aj) If matched then Data Type Matcher (Ai, Aj) Begin If matched then Constraint Matcher (Ai, Aj) If matched then merge (Ai, Aj) End End
4.2
Percentage of Reduction Number of Attributes
in
the
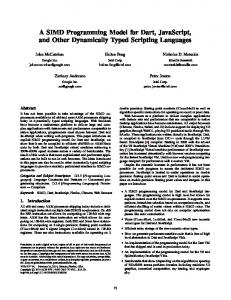
Figure 6 presents the performance of our model with respect to the percentage of reduction in the number of attributes as opposed to the other approaches. The percentage of reduction in the number of attributes for the relation schemas S1 and S2 is calculated by the following formula: ((number of attributes (S1) + number of attributes (S2)) – number of attributes in the integrated schema)/(number of attributes (S1) + number of attributes (S2)) × 100. From the figure it is found that our model has higher percentage of reduction (34%) compared to the other approaches (ranges between 13% to 32%). This is due to the fact that our model utilized various matchers to identify similarities between the schemas.
Figure 3. Flows of Matching Elements of Relation Schemas The final phase, integration, merges those pairs of attributes that are identified as matched, while those attributes that are not matched remain as they are. As an example, the result of integrating the relation schemas Gene(GID, Organism, Name, CHRO, Ref, Nucl, Comments, Strend) and GeneProduct(ID, Symbol, DBxref, Species, Type, Full_Name) is Gene(GID, Organism, Name, CHRO, Ref, Nucl, Comments, Strend, Symbol).
4.
Elements Considered in the Model
Figures 4 and 5 show the percentage of similarities and percentage of matched attributes, respectively, achieved when different elements are considered. The percentage of matched attributes between two relation schemas, S1 and S2, is calculated by the following formula: (number of matched attributes (S1) + number of matched attributes (S2))/(number of attributes (S1) + number of attributes (S2)) × 100. From the figures we observed that (i) in most cases the percentage of similarities (the percentage of matched attributes) changed whenever a different element is considered. For example the percentage of similarities between Gene and Cistron when n-gram and synonym are applied is 77% and this percentage increased to 84% and 88% (Figure 4) when data type and role of the attributes, respectively are considered. This shows that these elements have effect on the percentage of similarities and the percentage of matched attributes and thus affect the final result of integration; (ii) it is important to note also that utilizing more elements does not mean that the percentage of matched attributes will increase. This is shown clearly in Figure 5. This is because two attributes might have some similarities in terms of their names but they might have different data types or even roles that caused the percentage of matched attributes to decrease.
4.3
RESULT AND DISCUSSION
Percentage of Reduction Number of Null Values
in
the
Figure 6 also presents the percentage of reduction in the number of null values gained by our model as compared to the previous works. From the figure it is observed that our approach has smaller amount of null values (higher percentage of reduction, 80%) since similar attributes are merged. The figure also shows that our approach achieved higher percentage of similarities and percentage of matched attributes compared to the previous approaches.
Several analyses have been performed to evaluate the performance of the proposed model. Below we present the aims of each of the analysis and then provide the results of the analysis. (i) The first analysis is to show that the elements consider in this paper namely: attribute name, data type, role of an attribute, and instance data can effect the decision whether
247
120
% of Similarities
100 80 60 40 20 0
A, B, and Instance Data
A, B, C, and Data Type
A, B, C, D, and Key
(C)
(D)
Constr ai nt (E)
77
77
84
88
71
71
71
86
90
100
62
81
85
89
91
Gene and Gene_Pr oduct: Or gani smand Speci es
100
43
72
72
81
86
Gene and Genome: Gene and Genome
100
64
82
82
88
91
0
77
77
77
89
92
100
68
84
84
89
92
Ci str on and Genome: Ci str on and Genome
0
57
57
57
79
86
Gene Pr oduct and Genome: GenePr oduct and Genome
0
48
48
48
74
83
Synonym(A)
n-gr am(B)
A and B
100
53
0
Gene and Gene_Pr oduct: Gene and GenePr oduct
Gene and Ci str on: Gene and Ci str on Gene and Ci str on: Or gani smand Or gani sm
Ci str on and Gene_Pr oduct: Ci str on and GenePr oduct Ci str on and Gene_Pr oduct: Or gani smand Speci es
Matcher s
Figure 4. Percentage of Similarities with Different Matchers
% of Matched Attributes
100 90 80 70 60 50 40 30 20 10 0 Synonym(A)
n-gr am(B)
A and B
A, B, and Instance Data (C)
A, B, C, and Data Type (D)
A, B, C, D, and Key Constr ai nt (E)
Gene and Ci str on: Gene and Ci str on
14
38
52
52
52
52
Gene and Ci str on: Or gani smand Or gani sm
0
80
80
80
80
60
Gene and Gene_Pr oduct: Gene and GenePr oduct
14
44
58
72
72
72
Gene and Gene_Pr oduct: Or gani smand Speci es
44
22
66
66
66
66
Gene and Genome: Gene and Genome
25
50
75
75
75
75
Ci str on and Gene_Pr oduct: Ci str on and GenePr oduct
0
83
83
83
83
83
Ci str on and Gene_Pr oduct: Or gani smand Speci es
44
44
88
88
88
88
Ci str on and Genome: Ci str on and Genome
0
57
57
57
57
57
Gene Pr oduct and Genome: GenePr oduct and Genome
0
59
59
59
44
44
Matcher s
Figure 5. Percentage of Matched Attributes with Different Matchers
248
100 90 80 70 60 50 40 30 20 10 0
Our M odel
[ 3]
[ 19]
[ 8]
[ 13]
[ 11]
[ 2]
% of S im ilar it ies
89
82
80
80
60
56
56
% of M at c hed A t t r ibut es
66
62
51
51
53
16
16
% of Reduc t ion in Num ber of A t t r ibut es
34
32
26
27
27
13
13
% of Reduc t ion in Null Values
80
79
76
76
76
67
67
A ppr oac hes
Figure 6. Performance Comparison
5.
CONCLUSION
[4]
This paper presents a model for matching biomedical databases’ schemas which consists of three main levels, namely matching the databases’ schemas based on the (i) application domain, (ii) name of schemas, and (iii) elements that include the name of attributes, data type, role of attributes, and instance data. The model has achieved the following (i) higher percentage of reduction in the number of attributes (34%) and (ii) smaller amount of null values (higher percentage of reduction in null values, 80%) compared to the other approaches. This is due to the fact that the model utilizes most of the available information that is related to schemas in addition to blending the n-gram and synonym methods in matching the databases’ schemas. Furthermore, our approach achieved higher percentage of similarities and percentage of matched attributes compared to the previous approaches, which produces better global schemas during integration. In addition, the model is capable to identify related application domain before these databases are integrated without user intervention.
6.
[5] [6]
[7] [8]
[9]
ACKNOWLEDGEMENT
Our thanks to the Universiti Putra Malaysia (UPM) for supporting this work under grant number 05/01/07/0162RU.
7. [1] [2] [3]
[10]
REFERENCES Bernstein, P. A., S. Melnik, and M. Petropoulos, C., Quix: Industrial-strength Schema Matching. ACM SIGMOD Record, 33(4), 2004, pp. 38-43. Bilke, A. and Naumann, F., Schema Matching using Duplicates, Proceedings of the Twenty-first International Conference on Data Engineering, 2005, pp. 69-80. Dhamankar, R., Lee, Y., Doan, A., Halevy, A., and Domingos, P., iMAP: Discovering Complex Semantic Matches between Database Schemas, Proceedings of the 2004 ACM SIGMOD International Conference on Management of Data, 2004, pp. 383-394.
[11]
[12] [13]
249
Doan, A., Domingos, P., and Halevy, A., Learning to Match the Schemas of Data Sources: A Multistrategy Approach, Machine Learning, 2003, pp. 279-301. Doan, A. and Halevy, A., Semantic-Integration Research in the Database Community, AI Magazine, Spring 2005, pp. 83-94. Fabien Duchateau, Zohra Bellahsene, Mark Roantree, and Mathieu Roche, An Indexing Structure for Automatic Schema Matching, ICDE Workshops, 2007, pp. 485-491. Jeff Rose and Antonio Carzaniga, Plasma: a Graph based Distributed Computing Model, Workshop at SIGCOMM, 2008, pp. 1-39. Li, W. and Clifton, C., Semint: A Tool for Identifying Attribute Correspondence in Heterogeneous Databases using Neural Networks, Data and Knowledge Engineering, 2000, 33(1), pp. 49-84. Lu, J., J. Wang, and S. Wang, An Experiment on the Matching and Reuse of XML Schemas, Proceedings of the International Conference on Web Engineering (ICWE), LNCS 3579, 2005, pp. 273-284. Madhavan, J., Bernstein, P., Doan, A., and Halevy, A., Corpus-based Schema Matching, Proceedings of the Twenty-first International Conference on Data Engineering, 2005, pp. 75-68. Madhavan, J., Bernstein, P., and Rahm, E., Generic Schema Matching with Cupid, Proceedings of the 27th International Conference on Very Large Data Bases, 2001, pp. 49-58. Markowitz, V. M. and O. Ritter, Characterizing Heterogeneous Molecular Biology Database Systems, Journal of Computational Biology 2, 1995, pp. 547-556. Melnik, S., Garcia-Molina, H., and Rahm, E., Similarity Flooding: A Versatile Graph Matching Algorithm, Proceedings of the Eighteenth International Conference on Data Engineering, 2002, pp. 117.
[14]
[15] [16]
[17]
[18]
[19]
[20]
Milo T, and Zohar S. Using Schema Matching to Simplify Heterogeneous Data Translation. Proceedings of the 24th International Conference on Very Large Data Bases, 1998, pp. 122–133. Mitra P., Wiederhold G., and Jannink J., Semiautomatic Integration of Knowledge Sources, Proceedings of Fusion ’99, 1999, pp. 291-331. Narayanan PS, O'connor MJ, and Das AK, Ontologydriven Mapping of Temporal Data in Biomedical Databases, Proceedings of the AMIA Annual Symposium, 2006, pp. 1045. Palopoli L., Sacca D., Terracina G., and Ursino D., A Unified Graph-based Framework for Deriving Nominal Interscheme Properties, Type Conflicts and Object Cluster Similarities, Proceedings of the 4th. IFCIS International Conference on Cooperative Information Systems (CoopIS), 1999, pp. 34–45. Palopoli L., Sacca D., and Ursino D., Semi-automatic, Semantic Discovery of Properties from Database Schemas, Proceedings of the International Database Engineering and Applications Symposium (IDEAS), 1998, pp. 244–253. Qian Ying, Yue Liwen, and Liu Zhenglin, Discovering Complex Matches between Database Schemas, Control Conference, 2008, pp. 663-667.
[21]
[22] [23]
[24]
[25]
250
Rahm, E. and Bernstein, P., A Survey of Approaches to Automatic Schema Matching, The VLDB Journal, 2001, pp. 335-350. Ram, S. and Park, J., Semantic Conflict Resolution Ontology (SCROL): An Ontology for Detecting and Resolving Data and Schema-Level Semantic Conflicts, IEEE Transactions on Knowledge and Data Engineering, 16(2), 2004, pp. 189-202. Sujansky, W., Heterogeneous Database Integration in Biomedicine, Journal of Biomedical Informatics, 2001, pp. 285-298. Xu, L. and Embley, D., Discovering Direct and Indirect Matches for Schema Elements, Proceedings of the Eight International Conference on Database Systems for Advanced Applications, 2003, pp. 39-46. Yi-Ping Phoebe Chen, Supawan Prompramote, and Frédéric Maire: MDSM: Microarray Database Schema Matching using the Hungarian Method, Information Science, 176(19), 2006, pp. 2771-2790. http://msdn.microsoft.com/enus/library/aa258273(SQL.80).aspx#