Complex real-time system design needs to address dependability re- ...... S., Seo, C., Park, S., Zeigler, B.: Design and implementation of distributed DEVS.
A Modelling and Simulation Based Process for Dependable Systems Design Miriam Zia, Sadaf Mustafiz, Hans Vangheluwe and J¨org Kienzle School of Computer Science, McGill University Montreal, Quebec, Canada {miriam.zia, sadaf, hv, joerg} @cs.mcgill.ca
Abstract. Complex real-time system design needs to address dependability requirements, such as safety, reliability, and security. We introduce a modelling and simulation based approach which allows for the analysis and prediction of dependability constraints. Dependability can be improved by making use of fault tolerance techniques. The de-facto example in the real-time system literature of a pump control system in a mining environment is used to demonstrate our modelbased approach. In particular, the system is modelled using the Discrete EVent system Specification (DEVS) formalism, and then extended to incorporate fault tolerance mechanisms. The modularity of the DEVS formalism facilitates this extension. The simulation demonstrates that the employed fault tolerance techniques are effective. That is, the system performs satisfactorily despite the presence of faults. This approach also makes it possible to make an informed choice between different fault tolerance techniques. Performance metrics are used to measure the reliability and safety of the system, and to evaluate the dependability achieved by the design. In our model-based development process, modelling, simulation and eventual deployment of the system are seamlessly integrated.
1 Introduction Model-based approaches are used to represent the structure and behaviour of systems, which are becoming increasingly complex and involve a large number of components and domain-specific requirements [1, 2]. Dependable systems, in particular, must satisfy a set of functional requirements, and in addition, must adhere to constraints which ensure correct behaviour of the system. Safety, security and reliability are a few such dependability requirements. The necessity to satisfy these constraints has spawned new fields of research. The most prominent area is that of fault tolerant systems, and the introduction of fault tolerance design in the software development process is an emerging topic. Research has been carried out in formal modelling and analysis of fault tolerance properties [3, 4], using either natural language description of models, probabilistic models, figures of fault-trees or Markov models. Also, some tools have been designed, which use model-based techniques for analysis and prediction of dependability. There are presented here briefly: DEPEND. DEPEND [5] is a design environment for system level dependability analysis of fault-tolerant systems. It considers both hardware and software faults and
Fig. 1. Modelling and Simulation Based Design
provides support for automatic fault injection to enable evaluation of system performance and reliability. The simulation tool uses stochastic modelling but also allows behavioural modelling. The models built are based on the object-oriented paradigm. The control program is written in C++ using the library objects provided by DEPEND. This is followed by compiling the control program, linking the DEPEND objects, and then executing in a simulated parallel run-time environment. Fault injection and repairs are carried out according to the user’s specification. Finally, the tool generates statistics of the simulation. SAVE. System Availability Estimator (SAVE) [6] is a package used to build and analyze models to enable prediction of dependability constraints. A SAVE model is constructed as a collection of components, each of which can be subject to failure and repair. The high-level model is then automatically transformed to a Markov chain model. HARP. Hybrid Automated Reliability Predictor (HARP) [7] is a tool used for analysis of fault-tolerant architectures. It is a Markov model-based approach that allows for prediction of reliability and availability of systems. It provides support for coverage modelling and automatic conversion of fault trees to Markov models. Other tools available for dependability evaluation include Figaro [8] and HIMAP [9]. In addition to these, some processes have been proposed to assist developers in producing dependable software. A few such approaches are discussed below, but the interested reader is encouraged to consult a more detailed review given in [10].
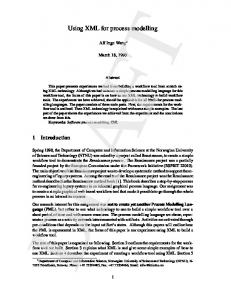
HRT-HOOD. Hard Real-Time HOOD (HRT-HOOD) [11] was developed as an extension of the HOOD object framework, to address issues of timeliness in embedded real-time systems during the early stages of the development process. The method provides explicit support for common hard real-time abstractions by introducing cyclic and sporadic type objects that take into account the timing properties. These objects are annotated with information about the period of execution, minimum arrival time, offset times, deadlines, budget times, worst-case execution time, and importance. The coding language is expected to have support available to program recovery handling. HRT-HOOD allows addition of extra objects required for replication in the physical architecture design phase. The method does not provide faulttolerance support but it can be extended to consider dependability requirements at an early stage. OOHARTS. Object-Oriented Hard Real Time System (OOHARTS) [12] is a process for developing dependable hard real-time systems. It is based on UML and the hard real-time constructs of HRT-HOOD. Various extensions to UML are proposed, e.g. stereotypes such as hcyclici, haperiodici, hprotectedi, hpassivei, and henvironmenti to describe different real-time objects. A special form of UML state diagram called Object Behaviour Chart is used to define object behaviour. It provides means for representing timing constraints like deadline and period. The UML concurrency attribute, which can be sequential, guarded, or concurrent, is extended to include hmutexi (mutual exclusion), hweri (write execution request), and hreri (read execution request). It introduces an additional phase in the HRT-HOOD software development life cycle, hard-real time analysis, which provides a framework for defining the structure and behaviour of hard real-time systems using UML and the new extensions defined [12]. TARDIS. The Timely and Reliable Distributed Information Systems (TARDIS) project [13] is targeted towards avionics, process control, military, and safety critical applications. The framework addresses non-functional requirements (dependability, timeliness, and adaptability), and implementation constraints from the early stages of software development. In the architectural design phase, issues of choices are addressed, for example, between replication and dynamic reconfiguration for improving reliability. The framework is generic, and does not impose any software design methods or languages on the developer. The initial proposal, however, was not completed. The project continued with focus on development of real-time systems. The architectural design of non-functional requirements related to real-time issues using the specification language Z and RTL (Real-Time Logic) is discussed in [14]. Detailed design using TARDIS is considered in [13] and [14]. According to [14], the TARDIS framework can also be applied to the design of systems where non-functional requirements like reliability, security, safety, fault tolerance, and system reconfiguration need to be satisfied. Although these frameworks aid in the production of dependable systems, to our knowledge, current approaches do not offer a modelling and simulation based process such as the one proposed in [15], of which this paper is an extension. In a model-based design process (Fig. 1), the system under study is modelled in the most suitable formalism in each step: A domain-specific problem is represented in
an appropriate way, and described in the domain formalism. Once the domain-specific model is available, an analysis model may be constructed in a formalism amenable to formal analysis and verification (i.e. covering all possible behaviours). As full analysis may not be feasible (due to the size of the state-space), a simulation approach to analysis may be used. A simulation model is constructed in a formalism which offers powerful simulation capabilities. Subsequently, simulation of the model is performed. The output of this simulation is processed by a checker, which checks it against a set of rules (derived from the requirements). An error found during this checking indicates an error in the design. Note that as even a large number of simulation runs may not cover all possible behaviours of the system, no positive statements about correctness of the model may be made. But confidence may be increased in the next phase where performance analysis is done to tune the model structure and parameters to satisfy performance requirements. Finally, an execution model is synthesized from the model (if necessary), thus providing a continuous, traceable path from analysis model to deployed system. With appropriate model compilers, the simulation expertise required of the designer is limited to knowledge of formalisms used (such as DEVS, Discrete EVent System specification). We are interested in developing the modelling and simulation based process illustrated in Fig. 2 for designing a dependable system. All steps in the evolution, from initial requirements and constraints to final system, are explicitly modelled. Models at various stages of the process are each expressed in the most appropriate formalism. Transformations themselves are also modelled explicitly, so no knowledge is left implicit. The process allows us to predict the behaviour of a specific system, and compare it to the behaviour of a fault-tolerant implementation of the same system. This is done through a sequence of manual activities. First, from functional requirements, a model is derived which represents the structure of a chosen system. A fault injection mechanism is also modelled as a means to generate faulty behaviour of the system. Simulation results indicate how the system performs in the presence of faults, and whether it conforms to the specified requirements. Secondly, from dependability constraints, a fault-tolerant model is created which includes techniques designed to improve on the initial system. A fault-tolerant simulation model is derived and simulated to gather performance data. This data reflects the dependability constraints that must be satisfied by the system. In this paper, system models are constructed in the DEVS formalism, and simulation models are developed using PythonDEVS [16]. Finally, once performance metrics indicate that dependability constraints are satisfied, the fault injection mechanism is separated from the fault-tolerant model, and the final application can then be synthesized using Real-time PythonDEVS [17]. The paper is structured as follows. Section 2 presents essential background concepts relating to the DEVS formalism and to fault tolerance. Section 3 describes the real-time Pump Control System (PCS) chosen to demonstrate our process. We introduce its functional requirements and dependability constraints and briefly discuss why modelling and simulation is an appropriate approach, and why DEVS is a suitable modelling formalism. Section 4 introduces the model of the PCS, and the means by which fault injection is introduced in the system. A PCS failure situation is described in Section 5, and a fault-tolerant model is presented that counteracts this failure. Furthermore,
Fig. 2. The Model-based Process
safety and reliability are defined as the dependability constraints that are threatened by failure of the PCS. Section 6 gives implementation-specific details and the experimental simulation framework is outlined. Mathematical equations are presented to quantify the safety and reliability of the PCS, and results of the simulations are analyzed to compare the performance of the PCS in the two models. The simulation model is validated by means of a probabilistic model. Finally, Section 7 draws some general conclusions about our model-based process.
2 Background This section introduces the the Discrete EVent system Specification (DEVS) formalism used in the case study. It also gives a brief overview of fault tolerance and the technique we apply in our work. 2.1 The DEVS Formalism The DEVS formalism was introduced in the late seventies by Bernard Zeigler to develop a rigorous basis for the compositional modelling and simulation of discrete event systems [18, 19]. The DEVS formalism has been successfully applied to the design and implementation of a plethora of different complex systems such as peer-to-peer
networks [20], transportation systems [21], and complex natural systems [22]. In this section we briefly present the DEVS formalism. A DEVS model is either atomic or coupled. An atomic model describes the behaviour of a reactive system. A coupled model is the composition of several submodels which can be atomic or coupled. Submodels have ports, which are connected by channels. Ports have a type: they are either input or output ports. Ports and channels allow a model to receive and send signals (events) from and to other models. A channel must go from an output port of some model to an input port of a different model, from an input port in a coupled model to an input port of one of its submodels, or from an output port of a submodel to an output port of its parent model. An atomic model has, in addition to ports, a set of states, one of which is the initial state, and two types of transitions between states: internal and external. Associated with each state is a time-advance and an output. Atomic DEVS 1 An atomic DEVS is a tuple (S, X,Y, δint , δext , λ, τ) where S is a set of states, X is a set of input events, Y is a set of output events, δint : S → S is the internal transition function, δext : Q× X → S is the external transition function, λ : S → Y is the output function and τ : S → R+ 0 is the time-advance function. In this definition, Q = {(s, e) ∈ S × R+ | 0 ≤ e ≤ τ(s)} is called the total-state space, for each (s, e) ∈ Q, e is called the elapsed-time.2 Informally, the operational semantics of an atomic model are as follows: the atomic model starts in its initial state, and it will remain in any given state for as long as its corresponding time-advance specifies or until input is received on some port. If no input is received, when the time of the state expires, the model sends output as specified by λ (before changing the state), and subsequently jumps to the new state as specified by δint . On the other hand, if input is received before the time for the next internal transition expires, then it is δext which is applied. The external transition depends on the current state, the time elapsed since the last transition and the inputs from the input ports. The following definition formalises the concept of coupled DEVS models3 Coupled DEVS A coupled DEVS named D is a tuple (X,Y, N, M, I, Z, select) where X is a set of input events, Y is a set of output events, N is a set of component names such that D 6∈ N, M = {Mn | n ∈ N, Mn is a DEVS model (atomic or coupled) with input set Xn and output set Yn } is a set of DEVS submodels, I = {In | n ∈ N, In ⊆ N ∪ {D}} is a set of influencer sets for each component named n, Z = {Zi,n | ∀n ∈ N, i ∈ In .Zi,n : Yi → Xn or ZD,n : X → Xn or Zi,D : Yi → Y } is a set of transfer functions from each component i to some component n, and select : 2N → N is the select function. Connectivity of submodels is expressed by the influencer set of each component. Note that for a given model n, this set includes not only the external models that provide 1 2 3
For simplicity, we do not present a formalisation of the concept of “ports”.
R+0 denotes the positive reals with zero included.
For simplicity, this “formalisation” does not deal with ports, and it leaves out the proof of well-definedness for coupled models.
inputs to n, but also its own internal submodels that produce its output (if n is a coupled model.) Transfer functions represent output-to-input translations between components, and can be thought of as channels that make the appropriate type translations. The select function takes care of conflicts as explained below. The semantics for a coupled model is, informally, the parallel composition of all the submodels. This is, each submodel in a coupled model is assumed to be an independent process, concurrent to the rest. There is no explicit method of synchronization between processes. Blocking does not occur except if it is explicitly modelled by the output function of a sender, and the external transition function of a receiver. There is however a serialization of events whenever there are two submodels that have a transition scheduled to be performed at the same time. Logically, the transitions are assumed to be done in that time instant, but its implementation on a sequential computer is serialized. The coupled model has a select tie-breaking function which chooses one of the models to undergo the transition first. 2.2 Fault Tolerance Complex computer systems are increasingly built for highly critical tasks, from military and aerospace domains to industrial and commercial areas. They are critical in the sense that their failures may have severe consequences ranging from loss of business opportunities, physical damage, to more catastrophic loss, such as human lives. Systems with such responsibilities should be highly dependable. A number of varied means of achieving this goal have been established and should be considered jointly during hardware as well as software development: fault prevention, fault removal, fault forecasting and fault tolerance [23]. In particular, we will discuss fault tolerance in more detail in this section. The idea of incorporating means for fault tolerance in order to achieve system dependability has developed considerably since the original work by von Neumann in the mid-1950s [24], and many techniques have been established. To discuss fault tolerance more meaningfully, a definition of correct system behaviour is needed: the specification. As long as the system satisfies the specification, it is considered to be behaving correctly. A failure can then be defined as an observable deviation from the system specification. An error is that part of the system state that leads to a failure. The error itself is caused by some defect in the system; those defects that cause observable errors are called faults [25]. Fault tolerance aims at preventing failures in the presence of hardware or software faults within the system. Therefore, as soon as an error has been detected, it must be corrected to ensure that a system continues to deliver its services and to avoid a potential failure later on in the execution. These corrective measures need to be taken to keep the error from propagating to other parts of the system, thus preventing further damage. Once the error is under control, error recovery is applied and a correct error-free sys tem state is restored. There are two basic recovery techniques [26]: backward and forward error recovery. Backward error recovery involves periodically checkpointing the application state and then, in case of a failure, restoring the state to a previous correct state. This can be very time consuming. Therefore, real-time systems often favour fault tolerance techniques based on forward error recovery. Forward error recov ery attempts to construct a
coherent, error-free system state by applying corrective actions to the current, erroneous state. In stateless, cyclic systems, where one iteration of execution does not depend on the previous run, a popular way of masking faults efficiently is to use redundancy. N-version programming [27, 28], for instance, is a technique that uses software redundancy to tolerate algorithm design faults. Multiple components (called versions), sometimes implemented in different programming languages following different design methodologies, perform the same, highly critical functionality in parallel. The results of all versions are gathered, and passed to a decision mechanism (sometimes also called voter), that determines which of the results can be considered correct. A similar technique used to increase hardware reliability is Triple Modular Redundancy (TMR). TMR uses three identical copies of a unit instead of one, and an intelligent, application-specific voting scheme which is applied to their output. This technique, described in more detail later, is used in this paper to improve reliability and safety of our case study system by tolerating faults of hardware sensors.
3 Modelling and Simulation Based Design: An Example 3.1 The Pump Control System Case Study The system used to demonstrate our approach is a Pump Control System (PCS). The PCS has often been used in the real-time systems literature. For example, Burns and Lister used the PCS as a case study to discuss the TARDIS project [29]. We adopt the Pump Control System problem from [29], and with some abstractions, define it as our case study for modelling and simulation based design of a dependable system. The basic task of the system is to pump to the surface the water that accumulates at the bottom of a mine shaft. The pump must be switched on when the water-sensor detects that the water has reached a high-level depth, and must be switched off when it detects that the level has been sufficiently reduced (low-level). In addition, the pump functionality depends on some atmospheric readings. A methane-sensor measures the level of methane in the environment: high levels may cause fire in the shaft if the pump is in operation. A carbon monoxide-sensor and an air-flow sensor also monitor the environment for critical readings (high for carbon monoxide and low for air-flow) which cause immediate evacuation of the shaft. Critical readings produced by all atmospheric sensors are sent to a human operator, but only critical methane readings cause the pump to switch off. To summarize, the pump is switched ON if the water-level is high and methane-level is not critical, and is switched OFF if the water-level is low and pump is on; or if the pump is on and the methane-level is critical. The proposed architectural system structure for the PCS is illustrated in Fig. 3. As all complex and critical applications, the PCS involves some important constraints, namely those of dependability, timing and security. This case study focuses on the dependability requirements defined for the PCS in [29] which demand that the system is reliable and safe. Reliability of the pump system is measured by the number of shifts that are lost if the pump does not operate when it should. The pump is supposed to operate when
the water levels become critical: that is the beginning of a shift, and the shift ends either when the methane level becomes critical or the water level becomes noncritical. If the pump does not operate in such circumstances, then it is said to miss a work-shift. In order to be considered reliable, our PCS may lose at most 1 shift in 1000. Safety of the system is related to the probability that an explosion occurs as a result of the pump operating despite critical methane levels. In order to be considered safe, the probability of a possible explosion in our PCS should be less than 10−3 during the simulated lifetime of the system.
Environment Subsystem
Pump Subsystem
Environment Sensors
Water Sensor
Methane Request Human Operator
ON
Alarms Environment Monitor
Methane Reply
Pump
Pump Controller
Methane Alarm
OFF
Fig. 3. The Pump Control System Logical Structure.
3.2 Why Use DEVS for The PCS? The successful development of large-scale complex real-time systems commonly relies on system-theoretic modelling approaches, such as DEVS, or object-oriented approaches such as UML Real-Time. UML-RT is an extension to UML which, in addition to offering constructs to model relationships among components, incorporates the Real-Time Object-Oriented Modelling constructs and is used to model the structural and behavioural aspects of systems. The behaviour of the system is specified in Statecharts by the sequence of signal communication [30]. Contrary to DEVS, in Statecharts we cannot formally specify explicit timing in the specification of models. Statecharts are also based on multi-component specification and broadcast communication, and the lack of a complete formal definition of UML-RT Statechart semantics hinders the formal specification of structural information. Furthermore, although UML-RT offers important capabilities for modelling real-time systems, it does not provide semantics suitable for simulated time: it prohibits carrying out simulation studies. On the contrary, DEVS separates models from how they may be executed; therefore simulators can be independently developed and verified, thus increasing reusability, formal analysis, and model validation. In addition, DEVS allows the specification of both the structural and behavioural aspects of a system. The PCS is a reactive discrete-event system: the system’s state changes in reaction to external events, such as critical environmental readings. In addition, the PCS is composed of many different interacting subsystems. DEVS, being highly modular and
supporting hierarchical coupling of models, allows for the separation of concerns and a clean model of such a complex system. Since the aim of our approach is to improve the design of a real-time system, we can simulate DEVS models to observe the faulty behaviour in the original PCS model and to predict the system’s behaviour under different fault tolerance techniques. From the simulations one can gather statistical data on whether or not dependability requirements are met within the PCS, and evaluate alternative system designs. The above mentioned reasons make DEVS an appropriate modelling formalism for the Pump Control System. Note that other types of systems may require other modelling formalisms.
4 Modelling the PCS The models presented in Sections 4 and 5 are created using AToM3 ’s [31] visual modelling and simulation environment for DEVS. AToM3 , A Tool for Multi-formalism and Meta-Modelling, is a tool for multi-paradigm modelling developed at McGill University’s Modelling, Simulation and Design Lab in the School of Computer Science. The main features are: Meta-modelling: refers to the description or modelling of different kinds of formalisms (such as DEVS) used to model systems. The meta-model description of a formalism is itself a model in the Entity Relationship formalism. From this meta-model, AToM3 generates a visual tool in which models described in the specified formalism can be created and edited [32]; Model-transformation: refers to the (automatic) process of converting, translating or modifying a model in a given formalism, into another model that might or might not be in the same formalism. In AToM3 , these transformations are performed by graph rewriting and are expressed as graph-grammar models [33]. 4.1 Building the DEVS Model of the PCS Each subsystem illustrated in Fig. 3 (pump, environment, communication) is modelled as an atomic DEVS whose structure and behaviour encodes the functional requirements of the PCS as depicted in Fig. 4. Below is the general model description of the “perfect” Pump Control System. This system is 100% safe, and 100% reliable, and is “calibrated” and “validated” in the absence of faults. Simulations based on this model give “perfect” performance results, and provide a useful way to check that the performance metrics for safety and reliability have been encoded properly and accurately reflect the system behaviour. Testing and checking of the performance metrics must be done against “known” data, which in this case is that we have a “correct” system. Methane Sensor, Carbon Monoxide Sensor, Airflow Sensor States: Sensor may either be ‘READING’ the level of gas or flow in the environment or ‘IDLE’ between readings. The internal behaviour of the Methane Sensor is illustrated in Fig. 5. Output: Upon transitioning from ‘READING’ to ‘IDLE’, the sensor outputs the level of gas or flow in the environment at that time.
MethaneSensor
mrOUT
EnvironmentMonitor
CarbonMonoxideSensor
Communication alrmOUT
mrIN
alrm_sent_pc
alrm_recv
PumpController
Pump
meth_alrm q_recv
cmOUT
pump_op q_recv
cmIN
q_send
opIN
q_send q_sack
AirFlowSensor
afIN
q_sack
q_rack
alarm_sent_hc
q_rack
wIN
afOUT HumanController
Water alarmIN
wOUT
Fig. 4. The Pump Control System Modelled in the DEVS Formalism using AToM3 .
Environment monitor States: The monitor may either be processing sensor readings (‘PROCESSING’), responding to a query (‘QUERYING’) or doing nothing (‘IDLE’). Output: Upon receiving a query from the Pump Controller through the Communication channel, the monitor responds by sending an acknowledgement which contains a message stating the criticality of the methane level. Upon receiving critical readings from the environment sensors, it outputs alarms. All messages to and from the pump controller or to the human controller are sent through the Communication DEVS. Communication States: The communication channel may either be sending alarms (‘SEND-ALARM’), sending a query to the environment monitor (‘SEND-QUERY’) or sending a query acknowledgement to the pump controller (‘SEND-ACK’). When it completes either of these tasks, its state is ‘IDLE’. The internal behaviour of the Communication DEVS is illustrated in Fig. 6. Output: Upon receiving a query from the Pump Controller, it forwards this query to the environment monitor, and once it receives the reply from the environment monitor, it propagates it to the pump controller. When it receives critical alarms, it delivers them to the human and pump controllers. Pump Controller States: It may either be processing a water sensor reading and sending an operation to the pump (‘PROCESSING-WATER’), processing a methane alarm (‘PROCESSING-
ALARM’), processing a query acknowledgement (‘PROCESSING-ACK’), or doing nothing (‘IDLE’). Output: Upon receiving a low-water reading, the pump controller sends an “off” message to the pump to switch it off. If the controller receives a high-water reading, it turns the pump to ready mode and sends a query to the environment monitor: the controller only turns the pump on if the methane level is not critical. If an acknowledgement is received stating that the methane level is high, then the controller turns the pump off, otherwise, it turns it on. Similarly, when the controller receives a methane alarm, it turns the pump off. Water Sensor States: It randomly switches between the ‘HIGH’ and ‘LOW’ states. Output: Upon switching, the sensor outputs the state to which it is transitioning. Human Controller This is a passive DEVS: it does not react to any input messages and remains constantly ‘IDLE’. If required, aspects of the behaviour of the human controller (such as attention span or pump control activities) can also be modelled.
MethaneSensor mrOUT IDLE READING
EnvironmentMonitor CarbonMonoxideSensor
mrIN
Fig. 5. The internal behaviour of the MethaneSensor DEVS.
4.2 Modelling of Fault Injection in the PCS As dependability constraints need to be met in addition to functional requirements, a quantitative analysis method for assessing the dependability of the system must also be modelled. For this purpose, many methods have been defined, such as reliability block diagrams, analysis of non-deterministic state graph models, and fault simulation [23]. The latter is a universal approach combining techniques which assume a model of the system, a set of external input/output sequences applied to it, and the possibility to inject faults into it. Most of these techniques can be classified as fault injection techniques, which consist in artificially adding faults to a system in order to analyze the behaviour. These faults make the system evolve towards different states which are recorded in order to assess the dependability constraints.
Communication
SEND-QUERY
communication_delay
alarn_sent_pc
IDLE alrm_recv
q_send
received query @q_recv
communication_delay
received ack @q_rack
SEND-ALARM
received alarm @alrm_recv
q_recv
communication_delay
SEND-ACK
q_rack
q_sack
alrm_sent_hc HumanController
Fig. 6. The internal behaviour of the Communication DEVS.
If we want to use a simulation-based technique to assess the reliability and safety of our system, we must, in addition to modelling the PCS, build a fault injection model. A fault injector could be described as an atomic entity on its own in the coupled DEVS model. However, modelling faults within a separate subsystem more accurately represents real-world faulty behaviour. Our approach consists in provoking a sensor breakdown on a periodic basis to simulate a possible fault that could make the Pump Control subsystem fail. For example, a fault in the methane sensor would generate faulty (noisy) methane readings of the environment, which would be propagated to the environment monitor, and through the communication subsystem to the pump controller. This wrong methane reading could possibly force the pump to shut off when it is not supposed to, or it might fail to cause a critical alarm to be raised. The simulation results should reflect how safety and reliabilty vary in the absence and presence of faults. We concentrate here on the consequence of the methane sensor failure on the safety and reliability requirements of the PCS (Section 5.1). To model faulty behaviour of a methane sensor s, we assign to it a probability p of failure. We assume Byzantine failures, i.e. upon failing, sensors produce an erroneous result rather than no result at all. The output value of a faulty sensor is a random value chosen uniformly from the possible output range. In practice, a sensor has a very low failure probability, however in this case study, the simulated probability p is chosen to be significantly higher to induce more erroneous states and observable failure of the system. Such a “worst case”, conservative choice is warranted as decisions made based on simulation results will be overly pessimistic and hence safe. For the methane sensor, we assume p = 0.1. At each methane-reading time, the sensor will either output the actual methane level in the environment, or will generate a false reading and output it with probability p.
The following is a pseudo-code model of the faulty bahaviour of a methane sensor, encoded in the output function of the MethaneSensor DEVS. totalMethaneReadings = 0 totalReliabilityFailures = 0 totalSafetyFailures = 0 overall_safety_index = 0 overall_reliability_index = 0 method outputFnc: totalMethaneReadings = totalMethaneReadings + 1 if(sensor_state is IDLE): actualMethaneReading = randint(0, 10) falseMethaneReading = randint (0,10) decision = uniform(0,99) if(decision < methaneFailureProbability): if(falseMethaneReading is CRTL4 and actualMethaneReading not CRTL): # Methane reading was falsely critical. totalReliabilityFailures = totalReliabilityFailures + 1 if(falseMethaneReading not CRTL and actualMethaneReading is CRTL): # Methane reading was falsely not critical. totalSafetyFailures = totalSafetyFailures + 1 else: overall_safety_index = overall_safety_index + 1 overall_reliability_index = overall_reliability_index + 1 output(falseMethaneReading) else: # Methane sensor sent the actual reading. overall_reliability_index = overall_reliability_index + 1 overall_safety_index = overall_safety_index + 1 output(actualMethaneReading)
5 Modelling the Fault-Tolerant System 5.1 Failure Scenario in the PCS Burns and Lister [29] describe four failure situations at the environment, communication and pump subsystems level for the PCS that affect the dependability. To illustrate our approach, we consider the situation in which the environment subsystem provides an incorrect methane reading (when asked by the pump subsystem). The case study focuses on the role of the environment subsystem on safety and reliability, thus upperbounding the measure of dependability of the system by the dependability of the environment subsystem. We assume that no mechanical failures occur in the communication and pump subsystems and that they do not introduce erroneous state. 4
CRTL stands for CRITICAL.
The environment subsystem fails in a noisy manner, i.e. it generates incorrect/noisy output. Since we only investigate hardware faults, we assume failures originate in the methane sensor: the subsystem provides incorrect methane readings if it receives such incorrect values from the sensor itself. Therefore, we can generalize the failure scenario to that of the methane sensor providing an incorrect methane reading. Safety of the System. The safety requirement is compromised if the sensor outputs a falsely low methane reading which causes the pump to operate despite critical concentrations in the environment. This introduces a threat of explosion in the mine shaft. However, if the sensor outputs a false reading whose criticality is in accordance with the accurate reading, i.e. it is critical when the accurate reading is critical, and not critical when the accurate reading is not critical, then the system is still considered to be safe. Reliability of the System. The reliability requirement is threatened if the sensor outputs a falsely high methane reading which causes the pump to shut down despite non-critical concentrations in the environment. This causes a loss of shift for the pump. Safety and reliability can be improved by replication of the methane sensors and applying the TMR technique [29]. This method can also be used for the carbon monoxide and airflow sensors. 5.2 Modelling Fault Tolerance for the PCS We change the PCS model, in AToM3 , to integrate fault tolerance based on TMR. A coupled DEVS containing three sets of methane sensors and a voter replace the methane sensor modelled in Fig. 4. In this case, even if one methane sensor fails, the correct reading can still be determined using the output of the other sensors, and a response from the voter is passed on to the environment monitor. This approach can also be applied to the carbon monoxide and airflow sensors. A partial view of the fault-tolerant environment subsystem is shown in Fig. 7. In the initial experiments described in [15], we used two different types of voters, a maximum voter and a majority voter. The maximum voter is a PCS-specific voter in which the highest value received from the replicated sensors is considered as accurate. The interest in the highest value resides in the fact that the system must be safe: if the pump is switched on while methane levels are critical, safety is threatened. Thus, the maximum voter is an appropriate choice for this problem. The majority voter is a well-studied voter that given n results, selects the value of the majority. In our case, if majority cannot be decided, the voter falls back to the maximum value. This paper extends [15] by also experimenting with an average voter. This voter is also very popular in literature, and given n results, calculates the average reading. The fault injection in the sensors is modelled similarly to the PCS model (Section 4.2); This allows us to compare the behaviour of the two systems and observe how the performance changes. At each methane-reading time, the sensor will either output the actual methane level in the environment, or will generate a false reading and output it with probability p. This leads to a roadblock in the design. Previously, the fault injection was introduced into the methane sensor itself since it was also responsible for
generating the methane reading. Thus, if three methane sensors are grouped together, each one will be generating its own reading value, and these three values might not coincide in value. For this reason, we introduce an ActualRGenerator DEVS into the model, which takes the responsibility of generating the actual methane reading away from the methane sensors. Note that this does not change the behaviour of the methane sensors: the sensor still performs readings, and could fail with probability p by generating some random value. However, if the sensor does not fail, it outputs the actual methane reading generated by the ActualRGenerator DEVS. This DEVS also produces the actual readings for the airflow and carbon monoxide sensors, and may be viewed simply as a random number generator.
MethaneCDEVS
ms2
ms3
: MethaneSensor
Communication
: MethaneSensor mr_OUT
mr_IN
ms1 : MethaneSensor
voter : MethaneVoter
Fig. 7. Fault-tolerant Methane Sensor Subsystem of the Pump Control System: 3 methane sensors send their environmental readings to a voter. The voter decides which reading to propagate to the communication subsystem.
6 Simulation and Results 6.1 Performance Metrics Modelling In the previous sections we showed how the PCS and the fault-tolerant PCS are modelled using DEVS. In order to perform dependability analysis, we model the safety and reliability as dependability performance metrics to be evaluated while the simulation runs. Each simulation keeps track of the total number of methane readings performed (TotalMethane-Readings). A reading mi is associated with a safety conformance index si and a reliability conformance index ri . These indices are equal to 0 if the reading causes a safety-threatening (for si ) or reliability-threatening (for ri ) fault, and 1 otherwise. Safety of the system can then be determined by ∑ni=1 si /TotalMethaneReadings,
and reliability by ∑ni=1 ri /TotalMethaneReadings (where n is equal to TotalMethaneReadings).
6.2 Implementation and Experimentation Once the system and the constraints are modelled, they are implemented using the PythonDEVS package [16]. This package provides a class architecture that allows hierarchical DEVS models to be easily defined and a simulation engine. Using this framework, each atomic and coupled DEVS described in the model of the PCS, the faulttolerant PCS using maximum voting, and the fault-tolerant PCS using majority voting, can be encoded into a Python class. Python is an interpreted object-oriented programming language, which offers high-level data types and a simple syntax. Its main advantage for the PCS case study is that it is an ideal language for quick and simple application development. Actually, the DEVS modelling environment in AToM3 synthezises PythonDEVS code. Each Python class representation of a DEVS has four functions defined in it: an internal transition function, an external transition function, an output function and a time-advance function. Next, simulation experiments are setup to gather statistical data which is representative of the system’s behaviour under the specified constraints. The following summarizes the experimental framework: – Time advances: A methane reading is generated every 2s, carbon monoxide every 6s, airflow every 5s, and water level is checked every 10s. – Reading Interval: All environmental readings are integers in the interval [0, 10]. We chose integers to avoid the errors common in voters when comparing floating point numbers. – Critical Readings: The critical concentrations are defined in the reading interval to be 7 for methane, 5 for carbon monoxide and 3 for airflow. – Simulation Time: Two sets of experiments are conducted. In the first set, each model is run for a duration of 2000 simulation time units (seconds). This process is repeated 5 times, starting from the same initial state, but using a different random number stream. In the second set, each model is run for a duration of 75000 simulation time units to satisfy the law of large numbers. As with the first set, this process is also repeated 5 times. For each of these runs, safety and reliability results are logged and analyzed. A third set of experiments is carried out, using the time advances, reading interval and critical readings defined above, but uses a modified model of the PCS and of the fault-tolerant systems. Firstly, the methane sensor failure probability is decreased tenfold (p = 0.01 instead of p = 0.1), and the simulations run for a longer duration (500000 simulation units) and are repeated 5 times. Secondly, in addition to the fault tolerant systems using maximum and majority voting, a fault tolerant system using an average voter is also encoded.
Fig. 8. Safety Results for the Second Set of Simulations.
6.3 Results of Second Set of Experiments Since the results of the first two sets of simulations are comparable, only results of the second set are analyzed here. These results are an indicator of which voter is best suited for the PCS with regard to system safety and reliability.
Fig. 9. Reliability Results for the Second Set of Simulations.
Safety. In the initial model, the average failure to satisfy the safety requirement is 2.32% (average safety of 97.68%) which is high for a system in which failures are catastrophic in nature. In the fault-tolerant model using the maximum voter, the
average safety rises to 99.99% (Fig. 8). It can be concluded that TMR with maximum voting reduces the occurrence of safety-threatening failures. However, there is a notable trade-off between safety and reliability here. This is not surprising as the choice of maximum voter was made to emphasize the safety requirement in such a critical system. Reliability. In the initial model, the average failure to satisfy the reliability requirement is 10.09% (average reliability of 89.91%), which is proportional to the probability that was associated with the methane sensor DEVS of 10% failure. In the implementation with the maximum voter, the reliability percentage falls even lower (Fig. 9). This is explained by the fact that the maximum voter always picks the highest value to output, be it accurate or false. For example, a case where the actual reading is 2, but the false reading received is 8, then 8 is voted to be the correct reading. This approach advocates safety of the system at the cost of reduced reliability of the sensors. In order to attain a fair balance between the safety and reliability requirements, the use of a majority voter is advised. The majority voter implementation results in an average reliability of 98.3%, but a slight decrease in the safety can be seen in Fig. 8. However, this is clearly a solid improvement on the original model and on the maximum voter, while still preserving safety.
6.4 Results of Third Set of Experiments The general result of the third set of experiments strengthens the conclusion made in the previous section: the fault tolerant system using a majority voter performs better overall than the system implementing the maximum voter. A quick look at Fig. 10 shows that the average safety of the initial PCS is 99.76%, improved by the maximum voter to an average safety of 100%, at the expense of reliability of the system as seen in Fig. 11. The PCS system using the majority voter scheme performs more adequately in terms of safety and reliability, improving on the original system on both occasions. On the other hand, some surprising conclusions can be drawn from the safety and reliability results obtained from experiments on the fault tolerant system using average voter. Indeed, the average voter lowers the overall performance of the system: the average safety decreases from 99.76% to 99.6%, and reliability from 98.98% to 97.76%. This is explained by the fact that calculating the average of integer values may lead to a real value rather than an integer value result. This requires (abs(x − xcomp ) < ε) - style comparison for equality testing (in our model, ε = 0.25). For example, a case where the actual reading is 6, but the readings received by the voter are 6, 8, and 9, then 7.66 is voted to be the correct reading. This reading raises a critical methane alarm. A falsely critical reading will cause the pump to shutdown if it were in operation, or will cause it to miss a shift if a critical water level requires its operation. On the other hand, in a case where the actual reading is, for example, 8, and the readings received by the voter are 2, 4 and 9, then 5 is voted to be the correct reading. Clearly, this is safetythreatening as a non-critical methane reading may allow the pump to operate despite actual critical methane levels. It becomes clear that an average voter mechanism is not an appropriate choice for the PCS.
PCS Safety Results
Implementations of PCS
FT-AVG
99.60016
FT-MAJ
99.99928
FT-MAX
100
PCS
99.4
99.76472
99.5
99.6
99.7
99.8
99.9
100
100.1
Percentage Safety
Fig. 10. Safety Results for the Third Set of Simulations.
6.5 Validation of Results Over the years, a lot of work has been done on estimating software reliability based on probabilistic models. To compare our simulation- based approach to an analytic one, we performed a probabilistic assessment of the reliability of the fault-tolerant model based on majority voting. We used the same assumptions as in the simulation: – if no majority can be determined, then the maximum result is selected as the correct one; – methane sensors produce an integer reading r ∈ [0, 10]; – sensors either work correctly, or fail with a probability p by outputting a random reading uniformly distributed between 0 and 10. As discussed previously, reliability is threatened when a falsely critical reading is sent to the environment monitor although the actual reading is non-critical. There are three cases that lead to a wrong decision by the voter. Each case can be considered separately. The total probability of the voter failing to decide on the correct output is then equal to the probability that the correct reading is non-critical (which is 7/11) multiplied by the sum of the probabilities corresponding to the cases listed below:
PCS Reliability Results
Implementations of PCS
FT-AVG
FT-MAJ
FT-MAX
PCS
96.5
97
97.5
98
98.5
99
99.5
100
100.5
Percentage Reliability
Fig. 11. Reliability Results for the Third Set of Simulations.
– one sensor outputs a correct reading, two sensors output equal, critical and false reading: 3 ∗ (1 − p) ∗ (p ∗ 4/11) ∗ (p ∗ 1/11); – all three sensors output wrong readings, but at least two are equal, critical and false reading: p3 ∗ ((4/11)(1/11) + 2(7/11)(4/11)(1/11)); – all three sensors output wrong distinct readings, and at least one is critical: p3 ∗ (1 − 7/11 ∗ 6/11 ∗ 5/11) ∗ (10/11 ∗ 9/11). Since we assume that p = 0.1 for the methane sensor, this leads to a majority voter failure probability of 0.0061, or a reliability of 99.39%. The results of our simulation indicated a reliability of 98.3%. Although similar, this clearly demonstrates that simulation results do not always coincide closely with the analytical results. If the simulation ran for a significantly longer period of time, however, the simulated value should converge to the analytical one. The probabilistic assessment leads to exact and precise results, but in cases where the problem is non-linear, the equations may become very complex and impossible to solve. For instance, sensors could fail in a non-uniform way, or additional acceptance tests could be used that look at results and exclude those that signal an unrealistic variation of the methane level reading compared to the previous one. Modeling these cases analytically becomes soon very tricky or even impossible.
The approach presented in this paper, however, is especially effective for complex systems for which deriving mathematical models is not feasible. One might argue that this approach requires extensive work in designing and encoding the models, and in analyzing the simulation results. However, models are easily derived from the requirements and logical structure of the system. Furthermore, the choice of modelling formalism and programming language make for a modular implementation, and if tools are available which automatically generate the applications, the process can be speedy. Lastly, simulation results are simple to analyze as they are derived from such simple equations as those described in Section 6.1. Mathematical models do not have these advantages. However, probabilistic models can be useful as a validation method for modelling and simulation based approaches as well as provide solutions to rare-event cases.
7 Conclusion In most complex systems today, it is crucial to guarantee that the dependability requirements are successfully achieved. Methods should be provided which can accurately assess what level of dependability has been attained by a system. In this paper, we have presented a modelling and simulation-based development process targeted towards dependable systems, and have demonstrated it through an application to the safety-critical Pump Control System. A continuity was maintained throughout the development process. We started from requirements, mapped these to a DEVS model, extended the model to consider the dependability constraints, defined performance metrics to encode these contraints, implemented the model using AToM3 and the PythonDEVS framework, and performed simulations whose results reflected the safety and reliability of the system. DEVS is deemed the most appropriate formalism for modelling both the system under study and the fault tolerance techniques. This is because discrete-event models are clearly at the right abstraction level, and because of the compositionality of the DEVS formalism. Fault tolerance, more specifically TMR, was used as a means to achieve dependability. In this approach three types of voters were used and the simulation results were inspected to decide which voter best satisfied the dependability requirement. The results indicated that this outlined method improved the dependability levels of the example system. We have shown how models can be useful for designing dependable systems: a model can be extended to address possible failures and to incorporate fault tolerance techniques that overcome them. The simulation results emulate the expected behaviour of the system. They allow us to predict behaviour, estimate system dependability, and enable an informed decision on which fault tolerance technique to apply. If such a step is taken during the analysis and design phase of any project, development cost is reduced as an optimal system is built right the first time, while fault tolerance is addressed earlier on in the development cycle, and simulation results emulate the expected behaviour of the dependable system. We plan to further investigate a generic process for the analysis and design of dependable systems. In addition, we will use the fault-tolerant models to synthesize appropriate software ports of the final application. In future work, we will further research
how different requirements on the one hand, and different fault distributions on the other, can lead to drastically different design choices.
References 1. Gray, J., Rossi, M., Tolvanen, J.P., eds.: Domain-Specific Modeling with Visual Languages. Volume 15 of Journal of Visual Languages & Computing. Elsevier Science Publishers (2004) 2. Vangheluwe, H., de Lara, J.: Domain-specific modelling for analysis and design of traffic networks. In Ingalls, R., Rossetti, M., Smith, J., Peters, B., eds.: Winter Simulation Conference, IEEE Computer Society (2004) 3. Pfeifer, H., von Henke, F.W.: Formal modelling and analysis of fault tolerance properties in the time-triggered architecture. In: 5th Symposium on Formal Methods for Automation and Safety in Railway and Automotive Systems. (2004) 4. Boue, J., Arlat, J., Crouzet, Y., Petillon, P.: Verification of fault tolerance by means of fault injection into VHDL simulation models. Technical report, LAAS-CNRS (1996) 5. Goswami, K.K., Iyer, R.K., Young, L.T.: DEPEND: A simulation-based environment for system level dependability analysis. IEEE Trans. Computers 46 (1997) 60–74 6. Blum, A.M., Goyal, A., Heidelberger, P., Lavenberg, S.S., Nakayama, M.K., Shahabuddin, P.: Modeling and analysis of system dependability using the system availability estimator. In: FTCS. (1994) 137–141 7. Bavuso, S., Dugan, J.B., Trivedi, K.S., Rothmann, B., Smith, E.: Analysis of typical faulttolerant architectures using HARP. IEEE Transactions on Reliability (1987) 8. Bouissou, M.: The figaro dependability evaluation workbench in use: Case studies for faulttolerant computer systems. In: FTCS. (1993) 680–685 9. Sridharan, M., Ramasubramanian, S., Somani, A.K.: HIMAP: Architecture, features, and hierarchical model specification techniques. In: Computer Performance Evaluation (Tools). (1998) 348–351 10. Mustafiz, S., Kienzle, J.: A survey of software development approaches addressing dependability. In: FIDJI. (2004) 78–90 11. Burns, A., Wellings, A.: HRT-HOOD: a structured design method for hard real-time Ada systems. Elsevier Science BV (1995) 12. Kabous, L., Nebel, W.: Modeling hard real time systems with uml the ooharts approach. In: UML. (1999) 339–355 13. Burns, A., Lister, A.M.: A framework for building dependable systems. Computer Journal 34 (1991) 173–181 14. Fidge, C., Lister, A.: A disciplined approach to real-time systems design. Information and Software Technology 34 (1992) 603–610 15. Zia, M., Mustafiz, S., Vangheluwe, H., Kienzle, J.: A modelling and simulation based approach to dependable system design. In Briand, L., Williams, C., eds.: Model Driven Engineering Languages and Systems: 8th International Conference. Volume 3713., MoDELS 2005, Spring-Verlag (2005) 217–231 16. Bolduc, J.S., Vangheluwe, H.L.: The modelling and simulation package PythonDEVS for classical hierarchical DEVS. MSDL technical report MSDL-TR-2001-01, McGill University (2001) 17. Borland, S.: Transforming statechart models to devs. Master’s thesis, School of Computer Science (2003) 18. Zeigler, B.P.: Multifacetted Modelling and Discrete Event Simulation. Academic Press (1984)
19. Zeigler, B.P., Praehofer, H., Kim, T.G.: Theory of Modeling and Simulation, Second Edition. Integrating Discrete Event and Continuous Complex Dynamic Systems. Academic Press (2000) 20. Cheon, S., Seo, C., Park, S., Zeigler, B.: Design and implementation of distributed DEVS simulation in a peer to peer network system. In: 2004 Advanced Simulation Technologies Conference, Design, Analysis, and Simulation of Distributed Systems Symposium 2004 (2004) 21. Chi, S., Lee, J.: DEVS-based modeling and simulation for intelligent transportation systems. In Sarjoughian, H.S., Cellier, F.E., eds.: Discrete event modeling and simulation: A tapestry of systems and AI-based theories and methodologies. Springer-Verlag (2001) 215–227 22. Filippi, J., Chiari, F., Bisgambiglia, P.: Using jDEVS for the modeling and simulation of natural complex systems. In: SCS AIS 2002 Conference on Simulation in Industry. Volume 1. (2002) 23. Geffroy, J.C., Motet, G.: Design of Dependable Computing Systems. Kluwer Academic Publishers (2002) 24. von Neumann, J.: Probabilistic logics and the synthesis of reliable organisms from unreliable components. In Shannon, C.E., McCarthy, J., eds.: Annals of Math Studies. Princeton University Press (1956) 43–98 25. Laprie, J.C.: Dependable computing and fault tolerance : Concepts and terminology. In Meyer, J.F., Morgan, D.E., eds.: 15th FTCS. (1985) 26. Lee, P.A., Anderson, T.: Fault tolerance - principles and practice. In: Dependable Computing and Fault-Tolerant Systems. 2nd edn. Springer Verlag (1990) 27. Elmendorf, W.R.: Fault-tolerant programming. In: Proc. 2nd Int. Symp. on Fault Tolerant Computing (FTCS-2), Newton, MA, USA, IEEE Computer Society Press (1972) 79–83 28. Chen, L., Avizienis, A.: N-version programming: A fault-tolerance approach to reliability of software operation. 8th Int. Symp. on Fault-Tolerant Computing (FTCS-8) (1978) 3–9 29. Burns, A., Lister, A.: An architectural framework for timely and reliable distributed information systems (TARDIS): Description and case study. Technical report, University of York (1990) 30. Huang, D., Sarjoughian, H.: Software and simulation modeling for real-time softwareintensive system. In: Proceedings of the 8th IEEE International Symposium on DS-RT. (2004) 31. de Lara, J., Vangheluwe, H.: Atom3: A tool for multi-formalism and meta-modelling. In: European Joint Conference on Theory And Practice of Software (ETAPS), Fundamental Approaches to Software Engineering (FASE), Springer-Verlag (2002) 174 – 188 32. Provost, M.: Introduction to meta-modelling in atom3 . Technical report, McGill University (2002) 33. Provost, M.: How to create graph-grammars in atom 3 . Technical report, McGill University (2002)