the Department of Statistics and Operations Research. ..... the residuals and compute the sufficient statistic of the data given the observed values and the current ...
A modification of the EM algorithm with applications to spatio-temporal modeling
by Stanislav Kolenikov
A dissertation submitted to the faculty of the University of North Carolina at Chapel Hill in partial fulfillment of the requirements for the degree of Doctor of Philosophy in the Department of Statistics and Operations Research. Chapel Hill 2005 Approved by:
Prof. Richard L. Smith, Advisor Prof. Kenneth A. Bollen, Reader Prof. Vidyadhar G. Kulkarni, Reader Prof. Bahjat Qaqish, Reader Prof. Zhengyuan Zhu, Reader
ii
iii
c 2005
Stanislav Kolenikov ALL RIGHTS RESERVED
iv
v
ABSTRACT STANISLAV KOLENIKOV: A modification of the EM algorithm with applications to spatio-temporal modeling. (Under the direction of Prof. Richard L. Smith.)
This dissertation outlines the use of the maximum likelihood procedures for estimation of the parameters of spatial and spatio-temporal processes when some observations are missing, and reviews the realizations of ML and EM procedures in the presence of missing data when the data are correlated. A version of the EM algorithm is suggested that has a promise of being computationally more efficient due to reduction of the number of matrix inversions, although at a price of the loss of the estimator’s consistency and asymptotic efficiency. Corrections that restore unbiasedness of the estimating equations implied by the EM algorithm are proposed. Asymptotic properties (consistency and normality) of the resulting estimators are established. Applications of the new procedure are considered: an analytically tractable case of AR(1) process, and an application to real data on PM2.5 measurements.
vi
vii
ACKNOWLEDGEMENTS I am indebted to my advisor Richard L. Smith for the support he provided in this research. I am also grateful to Dave Holland who kindly provided the data for the analysis in Chapter 4, and to the committee members (Prof. Kenneth Bollen, Prof. Zhengyuan Zhu, Prof. Bahjat Qaqish, Prof. Vidyadhar Kulkarni) for helpful discussions that led the substantial improvements in the thesis. Paul Dudenhoffer provided useful editorial tips and suggestions. The work was partially supported by the EPA Coop Agreement CR-827737-01-0. I am thankful to my family: my wife, Oksana Loginova, Ph.D., and my children, Timosha and Zlata, for their support and tolerance over all those years of graduate studies.
viii
ix
CONTENTS LIST OF TABLES LIST OF FIGURES 1 Introduction 2 Literature review 2.1
xiii xv xvi 4
Geostatistical models . . . . . . . . . . . . . . . . . . . . . . . . . . . .
5
2.1.1
Setup . . . . . . . . . . . . . . . . . . . . . . . . . . . . . . . .
5
2.1.2
Spatial prediction: kriging . . . . . . . . . . . . . . . . . . . . .
6
2.1.3
Variograms and semivariograms . . . . . . . . . . . . . . . . . .
8
2.1.4
Spatio-temporal models . . . . . . . . . . . . . . . . . . . . . .
10
2.2
Missing data challenges . . . . . . . . . . . . . . . . . . . . . . . . . . .
13
2.3
The EM algorithm . . . . . . . . . . . . . . . . . . . . . . . . . . . . .
15
2.4
Repeated measurement and dissociated models . . . . . . . . . . . . . .
17
3 Approximate EM algorithm for AR(1) process
20
3.1
AR(1) process . . . . . . . . . . . . . . . . . . . . . . . . . . . . . . . .
22
3.2
AR(1) with missing data: ML approach . . . . . . . . . . . . . . . . . .
25
3.3
AR(1) with missing data: the EM algorithm . . . . . . . . . . . . . . .
32
3.4
AR(1) with missing data: the approximate EM algorithm . . . . . . . .
34
3.5
AR(1) with many gaps . . . . . . . . . . . . . . . . . . . . . . . . . . .
38
3.6
AR(1) with many gaps: approximate EM . . . . . . . . . . . . . . . . .
41
3.7
Conclusion . . . . . . . . . . . . . . . . . . . . . . . . . . . . . . . . . .
45
4 Application to the spatio-temporal modelling
47
4.1
Particulate matter . . . . . . . . . . . . . . . . . . . . . . . . . . . . .
47
4.2
The data . . . . . . . . . . . . . . . . . . . . . . . . . . . . . . . . . . .
48
4.3
The spatio-temporal model . . . . . . . . . . . . . . . . . . . . . . . . .
49
x
4.4
Estimation . . . . . . . . . . . . . . . . . . . . . . . . . . . . . . . . . .
52
4.5
Results . . . . . . . . . . . . . . . . . . . . . . . . . . . . . . . . . . . .
54
4.6
Conclusions . . . . . . . . . . . . . . . . . . . . . . . . . . . . . . . . .
56
5 Dissociated processes
58
5.1
Incidence matrices . . . . . . . . . . . . . . . . . . . . . . . . . . . . .
60
5.2
Estimating equations: maximum likelihood . . . . . . . . . . . . . . . .
64
5.2.1
The differential of the log likelihood . . . . . . . . . . . . . . . .
64
5.2.2
d Σ for geostatistical models . . . . . . . . . . . . . . . . . . . .
66
5.2.3
Estimating equations . . . . . . . . . . . . . . . . . . . . . . . .
68
Estimating equations: approximate EM algorithm . . . . . . . . . . . .
69
5.3.1
The differential of the approximate likelihood . . . . . . . . . .
69
5.3.2
Regression parameter estimates for the approximate EM . . . .
70
5.3.3
Estimating equations for spatial covariance parameters . . . . .
71
5.3.4
Bias in the estimating equations . . . . . . . . . . . . . . . . . .
72
5.3.5
Correction for κ . . . . . . . . . . . . . . . . . . . . . . . . . . .
73
5.3.6
Correction for the spatial correlation parameters . . . . . . . . .
73
5.3.7
Correction for α . . . . . . . . . . . . . . . . . . . . . . . . . . .
74
5.3.8
Summary of corrections . . . . . . . . . . . . . . . . . . . . . .
74
5.4
Derivatives of the estimating equations . . . . . . . . . . . . . . . . . .
76
5.5
The variances of estimating equations . . . . . . . . . . . . . . . . . . .
84
5.5.1
89
5.3
An empirical estimate . . . . . . . . . . . . . . . . . . . . . . . 5.6 Consistency of θ˜ . . . . . . . . . . . . . . . . . . . . . . . . . . . . . . . 5.7 Asymptotic normality of θ˜ . . . . . . . . . . . . . . . . . . . . . . . . .
91
5.8
Numerical illustration . . . . . . . . . . . . . . . . . . . . . . . . . . . .
92
5.9
Discussion . . . . . . . . . . . . . . . . . . . . . . . . . . . . . . . . . .
96
6 Future work
90
99
6.1
Separable processes . . . . . . . . . . . . . . . . . . . . . . . . . . . . .
99
6.2
Unbiased estimating equations . . . . . . . . . . . . . . . . . . . . . . . 101
A Useful matrix calculus results
104
B Kronecker products
107
C Quadratic forms with missing data
108
xi
D Consistency and asymptotic D.1 Notation . . . . . . . . . . D.2 Consistency conditions . . D.3 Asymptotic normality . . D.4 A proof of consistency . . BIBLIOGRAPHY
normality of M -estimates . . . . . . . . . . . . . . . . . . . . . . . . . . . . . . . . . . . . . . . . . . . . . . . . . . . . . . . . . . . . . . . . . . . .
. . . .
. . . .
. . . .
. . . .
. . . .
. . . .
. . . .
. . . .
116 117 118 121 123 127
xii
xiii
LIST OF TABLES 2.1
Parametric forms for variograms . . . . . . . . . . . . . . . . . . . . . .
10
4.1
Comparison of the approximate EM and ML estimates. . . . . . . . . .
55
5.1 5.2
The simulation results. . . . . . . . . . . . . . . . . . . . . . . . . . . Correlations of the parameter estimates. . . . . . . . . . . . . . . . . .
93 96
C.1 Sampling probabilities for Lemma C.4. . . . . . . . . . . . . . . . . . . 112
xiv
xv
LIST OF FIGURES 2.1 2.2
A stylized variogram function. . . . . . . . . . . . . . . . . . . . . . . . Examples of isotropic variogram functions . . . . . . . . . . . . . . . .
8 11
3.1
plim ρˆim:aEM from the approximate EM algorithm. . . . . . . . . . . . .
43
4.1 4.2 4.3
Monitor locations in the data set. . . . . . . . . . . . . . . . . . . . . . Empirical variograms of the residuals . . . . . . . . . . . . . . . . . . . Plots of the predicted surface for PM2.5 . . . . . . . . . . . . . . . . . .
50 51 57
5.1 5.2 5.3
Locations of the simulated sites. . . . . . . . . . . . . . . . . . . . . . Variogram of the simulated process. . . . . . . . . . . . . . . . . . . . . Simulated distributions of the estimates. . . . . . . . . . . . . . . . . .
94 94 95
xvi
Chapter 1 Introduction This dissertation outlines the methods of dealing with the missing data in the context of spatially correlated environmental monitoring network data. In their recent paper, Smith, Kolenikov & Cox (2003) analyzed a spatio-temporal data set that featured repeated measurement of spatially correlated data. For each week t = 1, . . . , T , there were up to K measurements available at certain fixed locations of the monitors. The log likelihood of such model (assuming normality of the response variable) can be written down as ln L(θ, β; y, X) ∼ −
T � �o 1 nX ln |Σt (θ)| + tr (yt − Xt βt )(yt − Xt βt )T Σt (θ)−1 2 t=1
(1.1)
where X is the design matrix, the vector β represents the trends in time, space, and other covariates such as land use, and θ is the set of parameters for the geostatistical model of spatial covariance. The subindex t denotes a possible dependence of the dimensionality of the vectors and matrices on time t, as long as some data are missing. The independence over time is justified by the analysis of the residual correlation that shows no significant dependencies. The likelihood (1.1) can be maximized explicitly with a nonlinear optimization routine, but it would possibly involve inverting T matrices of rather big size (in Smith et al. (2003), K = 74, but more realistic applications may have K ∼ 103 − 105 ) and computing their determinants1 . An appealing method to reduce those computational costs seems to be the EM algorithm (Dempster, Laird & Rubin 1977, McLachlan & 1
Those two operations may be performed jointly thus reducing computational burden if appropriate matrix inversion methods relying on either spectral decomposition or Cholesky decomposition of a matrix (Demmel 1997), are used.
2
Krishnan 1997). This is an iterative procedure of Bayesian origin that increases the likelihood with each iteration by taking the conditional expectation of the missing data given the observed data and the current estimate of the parameters, and then maximizing the likelihood by the standard complete data methods. Various modification of the algorithm to simplify computations have been proposed. See Section 2.3 for more details. The modification that is especially useful in our context involves splitting the maximization step of the EM algorithm into maximization over the trend parameter β subspace and the covariance parameter θ subspace (a version of the EM known as expectation-conditional maximization, ECM). Also, instead of maximizing the likelihood at each M step, the algorithm may aim at just increasing it in a single step (generalized EM algorithm, GEM). So the algorithm steps used in Smith et al. (2003) are as follows: 1. Initialize the trend parameters β by OLS over the available cases; 2. Initialize the covariance parameters θ by some reasonable guesses; (h)
3. (E-step, h-th iteration) Compute yit = yit if available, xTit β (h) otherwise; (h)
4. (E-step, h-th iteration) Compute the regression residuals et ; 5. (E-step, h-th iteration) Compute the conditional expectation of the sufficient statistic i Xh (h) (h) �T et et |θ(h) ; (1.2) E t
or an approximation to it. Thus at the completion of the E-step, we have something a “current prediction” of the second term in (1.1): the cross-products in (1.1) are replaced by their (approximate) conditional expectations given by (1.2). 6. (M-step, h-th iteration, part 1) Maximize, by a nonlinear maximization routine, the log likelihood (1.1) with respect to the covariance parameters θ; 7. (M-step, h-th iteration, part 2) Run weighted least squares regression of y (h) with the weighting matrix Σ(θ(h) ) to maximize the likelihood over the trend / regression parameter subspace. (If the weighting matrix were the true covariance matrix Σ = Cov[y], then this step will become a GLS regression.) 8. Declare convergence according to a suitable criteria, or reiterate to step 3.
3
A computational difficulty remains in the above procedure at steps 4–5 to estimate the residuals and compute the sufficient statistic of the data given the observed values and the current parameter estimates. The exact implementation of the EM algorithm would require universal kriging (see Section 2.1.2) for each time point at the locations of the missing data at step 5 to predict the missing regression residuals, their variances and their covariances that are required for the likelihood. However, this provides no improvement in the computational speed over the classical MLE procedure based on straightforward maximization of (1.1) as this step would require the same matrix inversions separately for each t. What this dissertation proposes is an alternative method based on the approximate expectations of the residuals at the E-step. An opportunity to save on computations may be to use eit ejt in (i, j)-th position of the t-th term in (1.2) whenever both residuals were available, and use σij (θ(h) ) otherwise. In other words, the conditional expectations are replaced by unconditional, or marginal, expected values. A question must then be asked, by how much the above approximation to the conditional expectation is biased, can this bias be eliminated, what is the efficiency of the implied estimating equations, and what kind of other problems the procedure may lead to. This question is probably more pertinent for the covariance parameter estimates as long as the trend parameters estimates will be unbiased and consistent for any weighting matrix in the weighted least squares estimator, and asymptotically independent of the variance parameters. The remainder of the thesis is organized as follows. Chapter 2 gives a basic introduction to the two prime themes of the proposal, the spatial and spatio-temporal models, and the missing data models. In particular, section 2.1 reviews the main models used in geostatistical research, while the sections 2.2 and 2.3 describe the basic approaches to the missing data analysis. Chapter 3 analyzes the properties of the proposed modification to the EM algorithm when the correlation structure is simple enough to lend itself to an analytical solution. Namely, we use AR(1) process to analyze the behavior of the estimates. Further, the application of the algorithm to the real data set (an abridged version of Smith et al. (2003)) is given in Chapter 4. The general treatment of the dissociated processes is given in Chapter 5. Finally, the possible directions for future research are suggested in Chapter 6. Certain technical results necessary for Chapter 5 are given in the Appendices.
4
Chapter 2 Literature review
This research attempts to find computationally efficient estimating equations for the spatio-temporal models, or repeated spatially correlated measurements. We shall firstly review the ways to model spatial correlations for a single time instance in Section 2.1, then proceed to the incorporation of the temporal component in Section 2.1.4. As long as the real data sets have missing observations, the methods that work nicely on the full data sets start running into problems when some portions of the data are missing, as discussed in Section 2.2. One of the most natural ways to take the missing data into account is to use the EM algorithm that was designed specifically for those purposes. A general introduction to the EM algorithm will be given in Section 2.3, with a focus on the repeated measurement and spatio-temporal models.
2.1
Geostatistical models
The models of covariance that assume some parametric relation between observations with given spatial coordinates are known as geostatistical models. A concise introduction to the topic is given in Smith (2003), and extended references are Cressie (1993) and Stein (1999).
2.1.1
Setup
Suppose we have a sample Z(s1 ), . . . , Z(sn ) of measurements taken at locations s1 , . . . , sn from a spatial process Z(s), s ∈ D (2.1)
6
for some domain D ⊂ IRd . In the discussion of models and applications, we have to deal primarily with d = 2, although there is nothing special to two dimensions, and analysis in higher dimensions is also possible. To be able to estimate the mean and the variance of a linear functional of the process, such as the value in an unsampled location, or an areal mean, we have to assume that the underlying process has well defined means and variances, too: µ(s) = E Z(s),
V Z(s) < ∞ s ∈ D
(2.2)
The process is said to be (strictly) stationary if ∀h ∈ IRd and ∀k, s1 , . . . , sk ∈ D such that s1 + h, . . . , sk + h ∈ D, the distributions of the original and shifted data are the same: D Z(s1 , . . . , sk ) = Z(s1 + h, . . . , sk + h) (2.3) The process is said to be second-order stationary if µ(s) = µ ∀s ∈ D, and � � ∀s1 , s2 ∈ D , Cov Z(s1 ), Z(s2 ) = C(s1 − s2 )
(2.4)
for some function C(·) : IRd → IR. The process said to be Gaussian if any finite sample from it has a multivariate normal distribution. For Gaussian processes, the two definitions of stationarity are equivalent.
2.1.2
Spatial prediction: kriging
Suppose one wants to obtain a point estimate and the standard error of that estimate at a new location s0 not available in the data set. Suppose we can model the spatial trend as Z(si ) = X(si )β + η(si ), η ∼ N (0, Σ), i = 1, . . . , n (2.5) so that the mean, or the fixed effect, or the trend of the process is µ = Xβ, η is the realization of a spatially correlated noise in given locations, and Σ = Σ(θ) is the known spatial covariance matrix of the observed elements of the spatial process parameterized by a low dimension vector θ. (In the examples below, θ has two to four components.) The new observation is supposed to also follow the model Z(s0 ) = x0 β + η0
(2.6)
7
where η0 comes from the same field, and its covariance with the observed data can be found as (2.7) E η0 η = τ It can be shown (Cressie 1993, Smith 2003) that the best linear unbiased predictor (BLUP) for Z(s0 ) can be found as ˆ zˆ0 = xT0 βˆ + τ T Σ−1 (Z − X T β), βˆ = βˆGLS = (X T Σ−1 X)−1 X T Σ−1 Z
(2.8) (2.9)
ˆ is the prediction from the linear regression part, and the The first term of (2.8), xT0 β, other term is capturing the spatial correlation of residuals η. 01 The mean squared prediction error (assuming Σ(θ) is known) is given by MSPE[ˆ z0 ] = V[ˆ z0 − z0 ] = σ02 + +(x0 − X T Σ−1 τ )T (X T Σ−1 X)−1 (x0 − X T Σ−1 τ ) − τ T Σ−1 τ
(2.10)
where σ02 = V[η0 ]. The first two terms represent the standard formulae for the prediction variance in a linear regression, and the terms involving τ show the reduction of the variance due to the information used from the spatially correlated measurements. Those formulae are known as the universal kriging. A simpler version of the ordinary kriging is obtained when no regressors are present, so that the trend part of the model is simply Xβ = µ1I (2.11) where 1I = (1, . . . , 1)T . The name of the method comes from the early works by Krige, a mining engineer, one of the founders of geostatistical models. If the parameters θ of the spatial covariance process are to be estimated, the equation (2.10) is estimating only a part of the total variance that Cressie (1993) calls probabilistic prediction error, and that is related to the variability only in the new observation. The other part is the statistical prediction error, and it is related to the sampling variability of the estimates. The appropriate corrections are difficult to come by in the analytical frequentist framework, and Bayesian models have a greater promise in this respect. A BLUP of an areal average can also be obtained in a similar way as a linear combination of the observed data along with the standard error. See Smith (2003).
8
2.1.3
Variograms and semivariograms
The dependence in a spatial field is usually characterized by a variogram. Assuming for transparency µ(s) = 0 (which we shall do later anyway as we shall be modelling the residual covariance in a regression model), denote � � V Z(s1 ) − Z(s2 ) = 2γ(s1 − s2 )
(2.12)
The function γ(·) is referred to as semivariogram, and 2γ(·), as variogram. If the process admits such representation, it is called intrinsically stationary, which is a weaker concept than stationarity. A 2D Brownian shield is not stationary, but intrinsically stationary with γ(h) ∝ khk. A process is called isotropic if the variogram only depends on the Euclidean distance between the two points: γ(h) = γ0 (khk),
γ : IRd 7→ IR, γ0 : IR 7→ IR
(2.13)
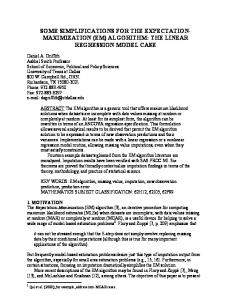
The typical shape of the variogram function of a stationary isotropic process has three main features shown on Fig. 2.1. The sill is the asymptotic value of γ(h) as khk → ∞, if such a value exists. The nugget models the jump of γ(·) in the vicinity of zero, and is most often attributed to the white noise measurement error, and the value of the nugget is the variance of this error. The range is the distance at which the
sill
nugget range Figure 1: Typical variogram
Figure 2.1: A stylized variogram function.
9
spatial correlation drops to zero, and the variogram reaches its maximum value (the sill). For some models, the sill is never achieved, but still one can talk about the range as the characteristic distance at which most of the action in the variogram occurs. A special concern in variogram modelling is making sure the implied covariance function is non-negative definite:
V
�X
∀k, ∀s1 , . . . , sk ∈ D, ∀a1 , . . . , ak ∈ IR, � XX � � ai Z(si ) = ai aj Cov Z(si ), Z(sj ) ≥ 0
i
i
(2.14)
j
and the corresponding variograms are non-positive definite: ∀k, ∀s1 , . . . , sk ∈ D, ∀a1 , . . . , ak ∈ IR,
X
ai = 0 ⇒
i
XX i
ai aj γ(si − sj ) ≤ 0 (2.15)
j
If this property is not satisfied, the variances of the spatial predictions (2.10) may become negative. There are a number of analytical forms for variograms of stationary isotropic processes that guarantee sign definiteness. The most popular examples are given in Table 2.1.3 adopted from Smith (2003). The power law can be used to model a non-stationary, but intrinsically stationary, field, with a special case of λ = 1 corresponding to the linear form of the variogram (such as in Brownian motion). The spherical model is only applicable for d ≤ 3. It fails positive definiteness in higher dimensions. The exponential power variogram has special cases p = 1, exponential form; and p = 2, Gaussian form. The Gaussian form is so called because of the similarity of the correlation function to a normal density, and does not imply that the process itself is Gaussian. The wave form is not monotonic and may be useful if the observations further apart in the space may have larger correlations than those closer in space. A rather special class of specifications is Mat´ern class derived from the bivariate spectral density of the process: f (ω) =
1 (1 +
kωk2 /θ12 )−θ2 −1
(2.16)
It is expressed in terms of covariances rather than a variogram: � √ �θ2 � √ � 2 θ2 t 2 θ2 t C0 (t) = θ2 −1 Γ(θ2 ) Kθ2 2 θ1 θ1 1
(2.17)
10
γ0 (t) =
Notes
Spherical
c0 + c1 tλ h c0 + c1 32 Rt −
(d < 4)
c0 + c1 , t > R
Power law
Exponential-
c1 > 0, non-stationary, 0 < λ ≤ 2 1 2
� t 3 R
i
,t 0; c0 + c1 is sill; R > 0 is range 0 < p ≤ 2 is shape parameter p = 1 — exponential, p = 2 — Gaussian
power 2
c0 + c1 1+tt2 /R2
Rational
c1 > 0, c0 + c1 is sill
quadratic Wave
c1 > 0
R > 0 is range c0 + c1 (1 −
R t
sin
t R)
c1 > 0
Table 2.1: Parametric forms for variograms. For all specifications, γ0 (0) = 0, so c0 > 0 is nugget. where θ1 is the scale parameter, 0 < θ2 < ∞ is the shape parameter (the case θ → ∞ corresponds to the Gaussian variogram function), and Kν (z) is the modified Bessel function of the third kind of order ν (Abramovitz & Stegun 1964). It is a solution to the differential equation z2
dw d2 w + 2z − [z 2 + ν(ν − 1)]w = 0 2 dz dz
(2.18)
The examples of all those functions are given in Fig. 2.2 (reproduced, with permission, from Smith (2003)). The parameters of the variogram models can be estimated by (versions of) the least squares method fitting the parametric model to the empirical variogram, by the maximum likelihood, or by restricted maximum likelihood. In this paper, we shall concentrate on the likelihood-based methods as long as they allow explicit treatment of the missing data.
2.1.4
Spatio-temporal models
There are several approaches to incorporate the time dependence in spatio-temporal models. The first big strand of literature starts off with the geostatistical models and allow the dependence on time. In the simplest form (which is what we concentrate further on in the proposal), such a model is a set of uncorrelated over time repeated measurements
11
(a)
(b)
(c)
1.0
1.0
1.0
0.8
0.8
0.8
0.6
0.6
0.6
0.4
0.4
0.4
0.2
0.2
0.2
0.0
0.0 0.0
0.5
1.0
1.5
2.0
0.0 0.0
0.5
(d)
1.0
1.5
2.0
0.0
(e) 1.0
1.0
0.8
0.8
0.8
0.6
0.6
0.6
0.4
0.4
0.4
0.2
0.2
0.2
0.0
0.0 0.5
1.0
1.5
2.0
0.5
(g) 1.0 0.8
0.6
0.6
0.4
0.4
0.2
0.2
0.0
0.0 0.0
0.5
1.0
1.0
1.5
2.0
0.0
0.5
(h)
0.8
1.5
2.0
1.5
2.0
1.5
2.0
1.5
2.0
1.5
2.0
1.5
2.0
0.0 0.0
1.0
1.0
(f)
1.0
0.0
0.5
1.0
(i) 1.5 1.0 0.5 0.0
0.0
0.5
(j)
1.0
1.5
2.0
0.0
0.5
(k)
1.0
(l)
2.0
1.0
1.0
1.5
0.8
0.8
0.6
0.6
0.4
0.4
0.5
0.2
0.2
0.0
0.0
1.0
0.0
0.5
1.0
1.5
2.0
0.0 0.0
0.5
(m)
1.0
1.5
2.0
0.0
(n) 1.0
1.0
0.8
0.8
0.8
0.6
0.6
0.6
0.4
0.4
0.4
0.2
0.2
0.2
0.0
0.0 0.5
1.0
1.5
2.0
1.0
(o)
1.0
0.0
0.5
0.0 0.0
0.5
1.0
1.5
2.0
0.0
0.5
1.0
������� � �� ¢x���5d��7(�� \�'/{$( ��� ������$ ���"� $&�'J��k��5 /0= ��$(�' �W 9��