Hindawi BioMed Research International Volume 2017, Article ID 2856716, 10 pages https://doi.org/10.1155/2017/2856716
Research Article A Modified 2D Multiresolution Hybrid Algorithm for Ultrasound Strain Imaging Jibing Wu,1,2 Yang Jiao,1 Zhile Han,1 Jie Xu,1 and Yaoyao Cui1 1
Suzhou Institute of Biomedical Engineering and Technology, Chinese Academy of Sciences, Suzhou, Jiangsu 215163, China University of Chinese Academy of Sciences, Beijing 100049, China
2
Correspondence should be addressed to Yaoyao Cui;
[email protected] Received 25 July 2017; Revised 29 October 2017; Accepted 15 November 2017; Published 20 December 2017 Academic Editor: Yongjin Zhou Copyright © 2017 Jibing Wu et al. This is an open access article distributed under the Creative Commons Attribution License, which permits unrestricted use, distribution, and reproduction in any medium, provided the original work is properly cited. Ultrasound elastography is an imaging modality to evaluate elastic properties of soft tissue. Recently, 1D quasi-static elastography method has been commercialized by some companies. However, its performance is still limited on high strain level. In order to improve the precision of estimation during high compression, some algorithms have been proposed to expand the 1D window to a 2D window for avoiding the side-slipping. But they are usually more computationally expensive. In this paper, we proposed a modified 2D multiresolution hybrid method for displacement estimation, which can offer an efficient strain imaging with stable and accurate results. A FEM phantom with a stiffer circular inclusion is simulated for testing the algorithm. The elastographic contrastto-noise rate (CNRe) is calculated for quantitatively comparing the performance of the proposed algorithm with conventional 1D elastography using phase zero estimation and the 1D elastography using downsampled (d-s) baseband signals. Results show that the proposed method is robust and performs similarly as other algorithms in low strain but is superior when high level strain is applied. Particularly, the CNRe of our algorithm is 15 times higher than original method under 4% strain level. Furthermore, the execution time of our algorithm is five times faster than other algorithms.
1. Introduction Mechanical properties of soft tissue have been used as an important indicator of several diseases, such as breast [1, 2], liver, and prostate cancer [3, 4]. Generally, the carcinoma tissue is stiffer than the surrounding normal tissues. Palpation, as the standard procedure during physical examination, is used to touch and feel tissue below the surface of the body, while its accuracy is limited by the depth of measurement [5]. Ultrasound elastography is a relative new imaging modality for the clinical evaluation of elastic properties of soft tissue using ultrasound. It was first referred to as elastography by Ophir et al. in 1991 [6]. It became a very hot research focus of medical ultrasound in the last two decades [7, 8]. Major medical imaging device companies have launched their ultrasound products with elastography or shear wave imaging modalities [7–10]. Clinical trials have been conducted for various clinical applications with promising results. Ultrasound elastography has been developing into an effective method in cancer diagnosis due to its capability and
simple implementation [11]. The basic steps of the technique are as follows: (1) the biological tissue is compressed by contact or noncontact way; (2) backscattered radio frequency (RF) signals before and after tissue compression are collected, respectively, by ultrasonic transducer; (3) the tissue displacement estimation algorithm is applied to estimate the displacement field from the RF signals; and (4) the strain field is reconstructed from the displacement field by strain estimation algorithm. Accurate estimation of tissue displacement is a very important step in ultrasound elastography. Different methods were proposed in the last two decades. Majority of these methods use correlation technique in time domain or the phase domain for displacement estimation [6, 12–14]. In time domain, several matching operators like correlation coefficients, the sum of squared differences (SSD), and the sum of absolute differences (SAD) are employed to finding the optimal matching in the pre- and postcompression RF signals [15, 16]. Since the computational cost of the matching operators in time domain is large, phase-based methods like phase zero
2 estimation, which have higher computational efficiency than time-domain methods, have been implemented in clinical ultrasound system for real-time strain imaging [13, 17]. Both 1D and 2D elastography methods can obtain displacements field, but the 1D estimation algorithms only consider axial displacements in tissue. They have difficulty in obtaining precise results in complex tissue environment, especially under high compression conditions. In general, the RF data sequence will be shifted laterally because of the lateral displacement in tissue. In order to reduce the errors due to lateral motion in 1D elastography, 2D elastography algorithms like hybrid displacement estimation method and a modified block matching method have been proposed [18, 19]. These methods consider both axial and lateral displacement; they expand the 1D window to a 2D window to avoid the side-slipping of the 1D window, which can greatly improve the precision of estimation result in high compression situation, but 2D elastography is usually more computational expensive than 1D elastography. In this paper, we proposed a modified 2D multiresolution hybrid method for displacement estimation, which can offer an efficient strain imaging with stable and accurate results. To test the algorithm, a heterogeneous computational phantom is simulated using finite element model (FEM), with a rectangle background containing a stiffer circular inclusion. The synthetic RF data are generated from Filed II software [20]. We compare the result with three different algorithms and show a great improvement of our method in ultrasound elastography.
2. Methods In order to make a tradeoff between speed and accuracy, we proposed a method using modified 2D multiresolution hybrid elastography. Preprocessing procedure is first applied to the raw RF data to obtain envelopes and baseline signals at different resolutions. Chen et al. proposed a hybrid displacement estimation method, which applied 3-level estimation based on cross-correlation and weighted phase separation (WPS) [18]. We suggest processing coarse estimation also on 3-level cross-correlation on sampled RF data by different sampling rate. And then a fine estimation is carried out on the whole frame RF date by phase zero-crossing method [15], which uses the results of the coarse estimation as the input to improve the resolution and accuracy. 2.1. Preprocessing. The analytic signals of predeformation and postdeformation radio frequency (RF) signals are obtained by applying Hilbert transformation to the raw RF data. The baseband signals can be calculated by demodulating the analytic signals with a carrier wave exp(𝑗𝑤0 𝑡), where 𝑤0 denotes the modulation frequency. The modulation frequency 𝑤0 should be chosen close to the transducer’s center frequency. The baseband signals are downsampled at different downsample rates. The downsample rates should satisfy the Nyquist sampling condition. The downsampled baseband signals are then converted into amplitude and phase data using FFT. The amplitude data at different scales are used in corresponding coarse to fine estimation, but the phase data are only used for fine estimation.
BioMed Research International
The whole frame Calculate windows Search windows
Figure 1: Over of the level 1 search, the calculate windows and search windows are equally distributed.
2.2. Coarse Estimation 2.2.1. Level 1 Search. Nine evenly distributed windows have been selected in the coarsest scale of the predeformation frame (see Figure 1). Displacements are calculated in these 9 windows by finding the highest correlation coefficient between predeformation and postdeformation frames in a search window [19, 21]. The correlation coefficient can be expressed as 𝑅 (𝑑𝑥 , 𝑑𝑦 ) =
∑(𝑥,𝑦)∈𝑇 [𝐴 (𝑥, 𝑦) − 𝐴] [𝐵 (𝑥 + 𝑑𝑥 , 𝑦 + 𝑑𝑦 ) − 𝐵] 2
√ ∑(𝑥,𝑦)∈𝑇 [𝐴 (𝑥, 𝑦) − 𝐴] ∑(𝑥,𝑦)∈𝑇 [𝐵 (𝑥 + 𝑑𝑥 , 𝑦 + 𝑑𝑦 ) − 𝐵]
2
,
(1)
where 𝑑𝑥 is the lateral displacement, 𝑑𝑦 is the axial displacement, 𝐴 and 𝐵 denote the envelope data from predeformation and postdeformation frame, 𝐴 and 𝐵 are the averages of 𝐴 and 𝐵, and 𝑇 is the window size. Since computational cost at this level is relatively cheap, the size of search windows can be set large enough, and in order to reduce the errors in this level, we do not use multiresolution search method mentioned by Chen in this level. In addition, the size of the search windows in the lower rows is selected bigger than in the upper row since displacement will be accumulated with respect to depth. The output of level 1 search is nine axial-lateral displacement estimations within the nine search windows. 2.2.2. Level 2 Search. Level 2 search is performed at a finer scale than level 1 search. Seven by 11 evenly distributed calculate windows are selected on the predeformation frame. The size of the calculate windows is 1/3 of the size at level 1
BioMed Research International
3
Search window
Neighbours
Search window
Target window
Max
Target window
Max
Reference point
Pre-reference point
Reference point (a)
Neighbours
(b)
Figure 2: Level 2 search strategy. (a) Set the initial center point of search window to be a reference point and then find the max in its neighbours according to the correlation coefficient. (b) Propagate the reference and its neighbours and then continue to calculate the correlation coefficient.
and the size of the search windows is bigger than that at level 1, which is selected according to the deformation degree. The initial axial and lateral displacement estimates of level 2 are inherited from the output of level 1 and bilinear interpolated to the finer scale. The search windows located at the point according to the output and the center of calculate windows. The so-called “following tracking” strategy (see Figure 2) is used to decide the search direction at each window [22]. First, set the initial center point of search window to be a reference point, and then set the reference point’s immediate neighbours to be the search points; after that we need to calculate the correlation coefficient of calculate windows and search windows at each search point. The point which has the highest correlation coefficient will be the next reference point; the search points then propagate to the current reference point’s neighbours, and so on. When the reference point occurs at a fixed position or out the range of search window, the calculation in this window is completed, and the axial and lateral displacement estimation is according to the position of the final reference point. Chen et al. used a multiresolution search method in this level; we removed it and increased the numbers of the reference point’s neighbours to obtain a more accurate result. We suggested that the increment of computational complexity in this level is meaningful. However, this time the searches are not independent; there is another delivering strategy that is used to deliver displacement estimations from one window to the next window which on the same column. The next window’s initial reference point is no longer the center point of search
window, but the position according to the output of the current window. The advantage of the searching strategy above is that we can find the point which matches the highest correlation coefficient quickly with lower computational complexity. Moreover, the strategy has a good error-correction mechanism to ensure displacement continuity in both axial and lateral direction. 2.2.3. Level 3 Search. The calculate windows and search windows are the smallest in coarse search and this process should finish the whole frame search. The size of calculate windows should be 1/2 of the size at level 2, and level 3 search stops when the calculate windows cover the whole frame. Similar as in level 2, we also need to interpolate the displacement results in level 2 to level 3 with finer scale. And we use the same search strategy to obtain the axial and lateral displacement in level 3 [22]. Since we do not need further refinement of the lateral displacement, and in order to avoid shifting the signals laterally too much, we extract the significant part of the lateral displacement and only shift the RF signal within that region. The lateral displacement should be smoothed and be considered as the final lateral displacement. There are many kinds of the smooth method; we suggest using the Savitzky-Golay filtering method. 2.3. Fine Estimation 2.3.1. Displacement Estimation. The initial axial and lateral displacement estimation over the whole RF data can be
4
BioMed Research International
bilinear interpolated from the coarse estimation from level 3 search. A modified phase zero algorithm is proposed for the fine displacement estimation [13]. Let us denote 𝑥1 and 𝑥2 to be the 1D windowed RF signals before and after compression of the tissue. In elastography, the postdeformation RF data is considered to be a compressed and time-shifted vision of the predeformation signals, and the signal compression can be neglected. Thus, 𝑥2 can be expressed as 𝑥2 (𝑡) = 𝑥1 (𝑡 + 𝜏) .
(2)
In general, the correlation between two signals can be calculated from the cross-correlation function as follows: ⟨𝑎, 𝑏⟩ ⟨𝑡⟩ = ∫
∞
−∞
𝑎∗ (𝑡 ) 𝑏 (𝑡 + 𝑡) 𝑑𝑡 .
(3)
Consequently, the signal’s autocorrelation function can be a time-shifted modification of the cross-correlation function ⟨𝑥1 , 𝑥2 ⟩ ⟨𝑡⟩ = ∫
∞
−∞
=∫
∞
−∞
∫
∞
−∞
𝑥1 ∗ (𝑡 ) 𝑥2 (𝑡 + 𝑡) 𝑑𝑡
𝑥1 ∗ (𝑡 ) 𝑥1 (𝑡 + 𝑡 + 𝜏) 𝑑𝑡 ,
𝑥1 ∗ (𝑡 ) 𝑥1 (𝑡 + 𝑡 + 𝜏) 𝑑𝑡
=∫
∞
−∞
(4)
𝑥1 ∗ (𝑡 ) 𝑥1 (𝑡 + 𝑡 + 𝜏) 𝑑𝑡
= ⟨𝑥1 , 𝑥1 ⟩ ⟨𝑡 + 𝜏⟩ , ⟨𝑥1 , 𝑥2 ⟩ ⟨𝑡⟩ = ⟨𝑥1 , 𝑥1 ⟩ ⟨𝑡 + 𝜏⟩ . Since the maximum of the autocorrelation equals the maximum of the cross-correlation, the conventional crosscorrelation determines this maximum to estimate the time shift. When we return the baseband signals to analytic signals, the phase 𝜑(𝑡) of the correlation function of the analytic signals 𝑥1+ (𝑡) and 𝑥2+ (𝑡) has an identical root
Then replace it by a sum of oversampled signals
⋅
𝑥1+ (𝑡) = exp (𝑗𝜛0 𝑡) 𝑥1 (𝑡) , 𝑥2+ (𝑡) = exp (𝑗𝜛0 𝑡) 𝑥2 (𝑡) .
Using the Newton iteration, we can figure out the root of 𝜑(𝑡) to find the time shift estimation 𝜏0,0 = 0, 𝜏𝑘,0 = 𝜏𝑘−1,𝑁 𝜏𝑘,𝑙 = 𝜏𝑘,𝑙−1 −
𝜑 (𝑡𝑛 ) 𝜑 (𝑡𝑛 ) ≈ 𝜏𝑘,𝑙−1 − 𝜛0 𝜑 (𝑡𝑛 )
arg (⟨𝑥1+ , 𝑥2+ ⟩ (𝜏𝑘,𝑙−1 )) = 𝜏𝑘,𝑙−1 − . 𝜛0
(6)
∑
(7) 𝑥1 ∗ (𝑡) 𝑥2 (𝑡 − 𝜏𝑘,𝑙−1 )) ,
where 𝜏𝑘,𝑙 denotes the displacement estimation in the 𝑘th window after iterating for l times and T denotes the calculation window size. In original phase zero-crossing estimation, the displacement estimation of the previous window will be used as the initial value for the next window [13]. The error of one window will propagate to the remaining windows along the RF line. This can cause large accumulated errors in the whole frame. On the other hand, this algorithm is based on the assumption that the lateral displacement in the tissue is negligible. However, tissue will be deformed in both the axial and the lateral directions when freehand compression is applied [21]. Lateral displacement should be considered when estimating the whole displacement field. We propose a modified algorithm to solve the problems described above. We get the coarse estimation including axial and lateral displacement in the previous coarse calculation, so the iteration between the neighbouring windows can be simplified comparing with 1D elastography method. And the lateral deviation will be applied to the computational process. The calculation is independent of each window, so it makes it easier to take this algorithm to be executed based upon CUDA (Compute Unified Device Architecture) 𝜏0,0 = 0, , 𝜏𝑘,0 = 𝜏𝑘,coarse
𝜏𝑘,𝑙 = 𝜏𝑘,𝑙−1 −
⋅ (5)
𝜏𝑘,𝑙−1 +𝑇/2 𝜏𝑘,𝑙−1 −𝑇/2
𝜑 (−𝜏) = 0, 𝜑 (𝑡) = arg (⟨𝑥1+ , 𝑥2+ ⟩ (𝑡)) ,
1 arg (exp (𝑗𝜛0 𝜏𝑘,𝑙−1 ) 𝑤0
𝜏𝑘,𝑙 = 𝜏𝑘,𝑙−1 −
𝜏𝑘,𝑙−1 +𝑇/2
∑
𝜏𝑘,𝑙−1 −𝑇/2
1 arg (exp (𝑗𝜛0 𝜏𝑘,𝑙−1 ) 𝑤0
(8)
𝑥1 ∗ (𝑡) 𝑥2,shift (𝑡 − 𝜏𝑘,𝑙−1 )) .
The initial value of each window is replaced by the coarse axial on current window. And take the lateral displacement 𝜏𝑘,coarse shift on 𝑥2 (𝑡) to be 𝑥2,shift (𝑡). 2.3.2. Strain Estimation. Strain is defined as the gradient of the displacement. Here we only calculate the axial strain and the least-squares strain estimator (LSQSE) is used, which employs a piecewise linear curve fitting [23]. After the axial displacement field is obtained, the strain map may be modeled as 𝑢 (𝑖) = 𝑎𝑧 (𝑖) + 𝑏,
(9)
where 𝑢 denotes the axial displacement and 𝑧 is the tissue depth. The constants 𝑎 and 𝑏 are the coefficients to be
BioMed Research International
5
20 18 16 14 12 10 8 6 4 2 0
0.02 ×10⁻² 2.2
Strain simulation 20
2 16
1.8 1.6
12
1.4 1.2
8
1 4 −4 −2 0
2
4
6
8 10 12 14 16 18 20 22 24 26
estimated, and 𝑎 represents the local strain. Transform the 𝑧 to matrix form 1
] 1] ] 𝑎 1] ] ∙ [ ]. ] 𝑏 1] ] 1]
(10)
The least square solution is given by 𝑎̂ −1 [ ] = 𝐴𝑇 [𝐴𝐴𝑇 ] 𝑢̂, ̂𝑏
0.6
0
Figure 3: Heterogeneous finite element model simulates the stiffer circular inclusion.
𝑧 (1) [ [ 𝑧 (2) [ 𝑎 [ 𝑢 = 𝐴[ ] = [ ⋅⋅⋅ [ 𝑏 [ ⋅⋅⋅ [ [𝑧 (𝑁)
0.8
(11)
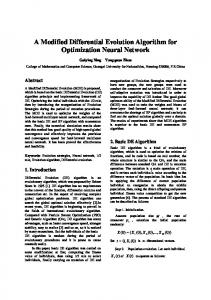
where 𝑎̂ and ̂𝑏 denote the estimation of 𝑎 and 𝑏, respectively. 2.4. Simulation. A FEM (finite element model) phantom is simulated using Commercial FEM software COMSOL Multiphysics 5.0 (COMSOL USA). FIELD II software is used for ultrasound simulations. The size of rectangle background of the 2D model is 20 mm × 20 mm, with a stiffer circular inclusion in the center. The radius of the inclusion is 3 mm. Triangular mesh was generated and refined automatically by COMSOL (see Figure 3). Smooth displacement and strain field can be obtained for further RF signal simulation. The inclusion and its background have same density of 1000 kg/m3 and Poisson’s ratio of 0.495. Young’s modulus of the inclusion is 100 kPa, which is multiple times stiffer than the background. In this study, we set strain contrast between lesion and background to be 5, so that there will be a clear boundary and CNRe can be easily used for performance comparison. The phantom is compressed by uniaxial compression with axial displacement set to 0.3 mm–0.8 mm (i.e., the axial strain is 1.5%–4.0%). The bottom of the phantom is fixed. A 192-element linear array transducer (64 active elements) with a center frequency of 7.5 Mhz is simulated. The transducer has a pitch of 0.255 mm and an element height of 5 mm. The element width is equal to the wavelength. The number of scan-lines is 128 and the distance between adjacent lines is equal to the pitch. The transmitting focus is at 30 mm
−4
0
4
8
12
16
20
24
Figure 4: Strain map simulated by COMSOL as the ground truth.
and dynamic focusing with focal zones step by 1 mm is used for receiving focus. The image zone has a width of 20 mm and a depth of 20 mm. The speed of sound is assumed to be 1540 m/s and the sampling frequency of the RF signals is 120 Mhz. The original scatters are randomly distributed in the image zone with random scattering amplitude. The predeformation RF signals are simulated with FIELD II using the parameters described above [20, 24]. The new scatters positions after compression are calculated according to COMSOL simulation. The postdeformation RF signals are then simulated with FIELD II using the new scatterer distribution.
3. Results and Discussion Ultrasound RF data was generated using computer simulation. With the synthetic RF data, the displacement and strain distribution were calculated using the modified 2D multiresolution hybrid elastography. Comparison was made between the proposed method, the original 1D elastography and the 1D elastography using downsampled (d-s) baseband signals. Since the modified method has a downsampled step, we make a downsampled version of 1D elastography to compare with the proposed method. To achieve that, we use the same processes as the 1D elastography method to get envelop signals, and the envelop signals will be then downsampled and further 1D elastography calculations will be performed on the downsampled envelop signals. Figure 4 shows the theoretical strain maps using finite element analysis in COMSOL as the ground truth. Figure 5 presents the estimated strains obtained by three algorithms for the computational phantom under different applied strain. The direct viewing of the result shows that 1D elastography is slightly better under low strain level; the reason is that the 1D method build on the whole RF data and the iterative calculation is more complete and precise under low strain level. The performance of the algorithm we proposed is similar to 1D algorithm when low strain is applied but much better under higher strain level. As we can see in the first two columns, some error appeared in the center of the
6
BioMed Research International
10 15
5 10 15 20
20
Value of strain
5 10 15 Lateral distance (f)
15
0.005
Axial distance
5 10 15
5 10 15 Lateral distance (c) Value of strain
5 10 15 20
5 10 15 Lateral distance (d)
15
0.045 0.04 0.035 0.03 0.025 0.02 0.015 0.01 0.005 0 −0.005
10 15
Value of strain
5 10 15 Lateral distance (i)
−0.05
15
−0.1 −0.15 5 10 15 Lateral distance (e)
20
Axial distance
Axial distance
10
20
15
10 15
5 10 15 Lateral distance (j)
20
0.22 0.2 0.18 0.16 0.14 0.12 0.1 0.08 0.06 0.04 0.02
10 15
5 10 15 Lateral distance (m) Value of strain
20
0.25 5
0.2
10
0.15 0.1
15
0.05 20
5 10 15 Lateral distance (n)
20
Value of strain
5
20
5 10 15 Lateral distance (l)
5
Value of strain
0
0.16 0.14 0.12 0.1 0.08 0.06 0.04 0.02
10
20
20
0.05 5
20
Value of strain
20
5
20
20
0.04 0.035 0.03 0.025 0.02 0.015 0.01 0.005 0 −0.005
10
5 10 15 Lateral distance (h) Value of strain
5 10 15 Lateral distance (k)
5
20
20
5
20
20
0.04 0.035 0.03 0.025 0.02 0.015 0.01 0.005 0
5 10 15 Lateral distance (g) Value of strain
Axial distance
0.035 0.03 0.025 0.02 0.015 0.01 0.005 0
Axial distance
Axial distance
Value of strain
20
20
20
Axial distance
10
Axial distance
0.01
15
5
Axial distance
0.015
10
Axial distance
Axial distance
0.02
5 10 15 Lateral distance (b)
15
Value of strain 0.03 0.025 0.02 0.015 0.01 0.005 0
0.025
20
10
Value of strain
5
0.12 0.11 0.1 0.09 0.08 0.07 0.06 0.05 0.04 0.03
5
20
20
20
0.06 0.05 0.04 0.03 0.02 0.01 0 −0.01
Axial distance
5 10 15 Lateral distance (a)
0.024 0.022 0.02 0.018 0.016 0.014 0.012 0.01 0.008 0.006 0.004
Axial distance
5
20
Value of strain
Value of strain 0.02 0.018 0.016 0.014 0.012 0.01 0.008 0.006 0.004
Axial distance
Axial distance
Value of strain
0.35 0.3
5
0.25 0.2
10
0.15 15 20
0.1 0.05 5 10 15 Lateral distance (o)
20
Figure 5: Strain maps of three different algorithms. Different strain levels as 1.5%, 2.0%, 3.0%, 3.5%, and 4.0% are applied at each row. The first column ((a)–(e)), the second column ((f)–(j)), and the third column ((k)–(o)) show, respectively, the strain map obtained by original 1D elastography and original 1D elastography with downsampled and modified 2D multiresolution hybrid elastography.
BioMed Research International
7 5
Value of strain
4.5
0.02
Axial distance
0.016 0.014 10
0.012 0.01 0.008
15
4
Ratio (background/inclusion)
0.018
5
3.5 3 2.5 2 1.5 1
0.006 20
0.5
0.004 5
10 Lateral distance
15
0
20
0
(12)
where 𝑠1 and 𝜎𝑠21 denote the mean and the variance of strain estimation in the inclusion and 𝑠2 and 𝜎𝑠22 are the mean and the variance of strain estimation in the background (see Figure 6). The larger the CNRe value, the better the clarity of the results. We have made a record of the average estimated strain rate for both inclusion and background for comparison purpose. The ratio of 𝑠1 and 𝑠2 previously mentioned is shown directly in Figure 7. We can see that the three different algorithms have shown similar average strain ratio between lesion and background in different strain level. We make a complete test with three algorithms under different strain level range 0.2% to 4%. Same as 1D algorithms, the CNRe of our algorithms is too low to distinguish between the lesion and background when strain level is lower than 0.8%, which means the noise on strain estimation will blur the boundary between lesion and background. And the CNRe of the modified 2D multiresolution hybrid elastography algorithm is much higher than the other two algorithms at high strain level (see Figure 8). We can see that the original 1D elastography has a slight better result in low strain level; the reason is that the 1D method build on the whole RF data and the iterative calculation is more complete and precise under low strain level. The performance of the algorithm we proposed is similar to 1D algorithm when low strain is applied but better under higher strain level.
3
3.5
4
7 6 5 log(CNRe)
2 (𝑠1 − 𝑠2 ) , 𝜎𝑠21 + 𝜎𝑠22
1.5 2 2.5 Strain level (%)
Figure 7: The ratio of average estimated strain rates of the inclusion and the background.
2
CNRe =
1
1D 1D (d-s) 2D
Figure 6: The extra area of inclusion and background for the calculation of CNRe and the average estimated strain rate.
result when strain level increased, and there are two error lines in 1D elastography (Figure 5(e)) because of the lacking consideration of lateral displacement and iterative calculation between two windows. To quantify the performance of different algorithms, CNRe is calculated at each strain level and we use the binary strain image to measure the accuracy of each algorithm [25]. The definition of the CNRe is provided in the following:
0.5
4 3 2 1 0
0
0.5
1
1.5 2 2.5 Strain level (%)
3
3.5
4
1D 1D (d-s) 2D
Figure 8: The CNRe results of three different algorithms.
The strain binary images (see Figure 9) are obtained by thresholding the strain map. We set the threshold at the same level and plot the binary images, respectively. It is an immediate way to see the accuracy of each strain image. We set the average estimated strain rate for whole phantom as the threshold of the binary images. Additionally, the inclusion area ratios are calculated and compared with the ground truth of FEA result. Then we calculate the inclusion area ratio as the numbers of black pixels and all pixels in the image. The standard denotes the inclusion area ratio in FEA model and results of calculated strain ratio from three methods
8
BioMed Research International
5 10 15 Lateral distance (b) Value of strain
20
5 10 15 20
5 10 15 Lateral distance (c) Value of strain
20
5 10 15 20
5 10 15 Lateral distance (d)
20
Axial distance
Value of strain 5 10 15 20
5 10 15 Lateral distance (e)
20
1 0.9 0.8 0.7 0.6 0.5 0.4 0.3 0.2 0.1 0
1 0.9 0.8 0.7 0.6 0.5 0.4 0.3 0.2 0.1 0
1 0.9 0.8 0.7 0.6 0.5 0.4 0.3 0.2 0.1 0
5 10 15 Lateral distance (f) Value of strain
20
5 10 15 20
5 10 15 Lateral distance (g) Value of strain
20
5 10 15 20
5 10 15 Lateral distance (h) Value of strain
20
5 10 15 20
5 10 15 Lateral distance (i)
20
Value of strain 5 10 15 20
5 10 15 Lateral distance (j)
20
1 0.9 0.8 0.7 0.6 0.5 0.4 0.3 0.2 0.1 0
1 0.9 0.8 0.7 0.6 0.5 0.4 0.3 0.2 0.1 0
1 0.9 0.8 0.7 0.6 0.5 0.4 0.3 0.2 0.1 0
1 0.9 0.8 0.7 0.6 0.5 0.4 0.3 0.2 0.1 0
Axial distance
Axial distance
20
5 10 15 20
Axial distance
15
15
5 10 15 Lateral distance (k) Value of strain
20
5 10 15 Lateral distance (l) Value of strain
20
5 10 15 Lateral distance (m) Value of strain
20
5 10 15 Lateral distance (n)
20
5 10 15 20
Axial distance
10
1 0.9 0.8 0.7 0.6 0.5 0.4 0.3 0.2 0.1 0
10
Value of strain
5 10 15 20
Axial distance
Axial distance
20
5
20
Axial distance
5 10 15 Lateral distance (a) Value of strain
5
1 0.9 0.8 0.7 0.6 0.5 0.4 0.3 0.2 0.1 0
5 10 15 20
Value of strain Axial distance
Axial distance
20
Axial distance
15
Axial distance
10
Value of strain
Axial distance
5
1 0.9 0.8 0.7 0.6 0.5 0.4 0.3 0.2 0.1 0
Axial distance
Axial distance
Value of strain
5 10 15 20
5 10 15 Lateral distance (o)
20
1 0.9 0.8 0.7 0.6 0.5 0.4 0.3 0.2 0.1 0
1 0.9 0.8 0.7 0.6 0.5 0.4 0.3 0.2 0.1 0
1 0.9 0.8 0.7 0.6 0.5 0.4 0.3 0.2 0.1 0
1 0.9 0.8 0.7 0.6 0.5 0.4 0.3 0.2 0.1 0
1 0.9 0.8 0.7 0.6 0.5 0.4 0.3 0.2 0.1 0
Figure 9: Strain binary images of three different algorithms. Different strain levels as 1.5%, 2.0%, 3.0%, 3.5%, and 4.0% are applied at each column. The first column ((a)–(e)), the second column ((f)–(j)), and the third column ((k)–(o)) show, respectively, the strain binary map obtained by the corresponding strain map using 1D elastography, downsampled 1D elastography, and the proposed 2D elastography method.
BioMed Research International
9 robust and accurate when high level strain is applied. The result of execution time has shown that the new framework has a higher efficiency that it may well be more suitable for real-time application in clinical practice. The limitation of our algorithm is that, to a great extent, the accuracy of the final result is determined by the output of coarse estimation. The strain image calculated by our algorithm is slightly worse than original 1D elastography under low strain level. In this study, we use simulated data to compare the performance of the proposed method with other methods in different strain level, since ground truth of strain map can be easily obtained. In our next study, we will test our method using phantom and in vivo data.
0.09 0.08 0.07
Area ratio
0.06 0.05 0.04 0.03 0.02 0.01 0
0
0.5
1D 1D (d-s)
1
1.5 2 2.5 Strain level (%)
3
3.5
4
The authors declare that there are no conflicts of interest regarding the publication of this paper.
2D Standard
Figure 10: The inclusion area ratios results of three different algorithms, where the standard denotes the inclusion area ratio in FEA model.
Table 1: Execution times of three different algorithms. Method Times (s)
1D 10.2
1D with downsampled 2.3
Conflicts of Interest
Modified 2D 1.8
are shown in Figure 10. The inclusion area ratio of the new method is closer to the standard than other methods. In the algorithm we proposed, the lateral resolution depends on the amount of the windows in level 3 search. The lateral resolution increased with the increasing of the amount until the resolution is equal to the sampling frequency of the RF data. The axial resolution is determined by the physical size of transducer such as the kerf of the array element. The purpose of the consideration of lateral displacement in our algorithm is not to improve the later resolution but to compensate for the interference of lateral offset and get higher accuracy in axial strain image. All the algorithms were executed with an Intel(R) Core(TM) i7-4790K CPU @2.40 GHz 8.00 GB RAM, and MATLAB 2014b was used for implementing and testing them on Windows operation system. The execution times of the different methods are shown in Table 1. The modified 2D multiresolution hybrid elastography algorithm has a shorter time than the other algorithms.
4. Conclusion A modified 2D multiresolution hybrid method has been proposed in this paper. Using finite element model phantom under different strain levels, we have shown that the new algorithm can achieve better CNRe comparing with different methods including original 1D elastography method and original 1D elastography method with downsampled (d-s). These results demonstrate that the method we suggested is
Acknowledgments This work is supported by the National Key Technology Research and Development Program of the Ministry of Science and Technology of China (Grant no. 2017YFC0107202), the Funds for Technology of Suzhou, China (Grants nos. SYG201505 and SZS201510), the Funds for Jiangsu Provincial Key Research and Development Plan (Grant no. BE2017601), and International Cooperation Program of Jiangsu Province (Grants nos. BZ2016023 and BK20161235).
References [1] B. S. Garra, E. I. Cespedes, J. Ophir et al., “Elastography of breast lesions: initial clinical results,” Radiology, vol. 202, no. 1, pp. 79– 86, 1997. [2] A. Itoh, “Review of the techniques and diagnostic criteria of breast ultrasound elastography,” Medix Hitachi Supplement, vol. 8, 2007. [3] M. Friedrich-Rust, M. F. Ong, E. Herrmann et al., “Real-time elastography for noninvasive assessment of liver fibrosis in chronic viral hepatitis,” American Journal of Roentgenology, vol. 188, no. 3, pp. 758–764, 2007. [4] K. K¨onig, U. Scheipers, A. Pesavento, A. Lorenz, H. Ermert, and T. Senge, “Initial experiences with real-time elastography guided biopsies of the prostate,” The Journal of Urology, vol. 174, no. 1, pp. 115–117, 2005. [5] J.-L. Gennisson, T. Deffieux, M. Fink, and M. Tanter, “Ultrasound elastography: Principles and techniques,” Diagnostic and Interventional Imaging, vol. 94, no. 5, pp. 487–495, 2013. [6] J. Ophir, I. C´espedes, H. Ponnekanti, Y. Yazdi, and X. Li, “Elastography: a quantitative method for imaging the elasticity of biological tissues,” Ultrasonic Imaging, vol. 13, no. 2, pp. 111– 134, 1991. [7] J. Ophir, S. Srinivasan, R. Righetti, and A. Thittai, “Elastography: A decade of progress (2000-2010),” Current Medical Imaging Reviews, vol. 7, no. 4, pp. 292–312, 2011. [8] K. J. Parker, M. M. Doyley, and D. J. Rubens, “Imaging the elastic properties of tissue: the 20 year perspective.,” Physics in Medicine and Biology, vol. 56, no. 1, p. -R29, 2011.
10 [9] J. Ophir, S. K. Alam, B. S. Garra et al., “Elastography: Imaging the elastic properties of soft tissues with ultrasound,” Journal of Medical Ultrasonics, vol. 29, no. WINTER, pp. 155–171, 2002. [10] A. P. Sarvazyan, O. V. Rudenko, S. D. Swanson, J. B. Fowlkes, and S. Y. Emelianov, “Shear wave elasticity imaging: a new ultrasonic technology of medical diagnostics,” Ultrasound in Medicine & Biology, vol. 24, no. 9, pp. 1419–1435, 1998. [11] M. M. Doyley, “Model-based elastography: a survey of approaches to the inverse elasticity problem,” Physics in Medicine and Biology, vol. 57, no. 3, pp. R35–R73, 2012. [12] R. Zahiri-Azar and S. E. Salcudean, “Motion estimation in ultrasound images using time domain cross correlation with prior estimates,” IEEE Transactions on Biomedical Engineering, vol. 53, no. 10, pp. 1990–2000, 2006. [13] A. Pesavento, “A time-efficient and accurate strain estimation concept for ultrasonic elastography using iterative phase zero estimation,” IEEE Transactions on Ultrasonics, Ferroelectrics and Frequency Control, vol. 46, no. 5, pp. 1057–1067, 1999. [14] M. O’Donnell, A. Skovorada, and B. Shapo, “Measurement of arterial wall motion using Fourier based speckle tracking algorithms,” in Proceedings of the IEEE 1991 Ultrasonics Symposium, pp. 1101–1104, Orlando, Fla, USA. [15] F. Viola and W. F. Walker, “A comparison of the performance of time-delay estimators in medical ultrasound,” IEEE Transactions on Ultrasonics, Ferroelectrics and Frequency Control, vol. 50, no. 4, pp. 392–401, 2003. [16] S. Langeland, J. D’Hooge, H. Torp, B. Bijnens, and P. Suetens, “Comparison of time-domain displacement estimators for twodimensional RF tracking,” Ultrasound in Medicine & Biology, vol. 29, no. 8, pp. 1177–1186, 2003. [17] J. E. Lindop, G. M. Treece, A. H. Gee, and R. W. Prager, “Phasebased ultrasonic deformation estimation,” IEEE Transactions on Ultrasonics, Ferroelectrics and Frequency Control, vol. 55, no. 1, pp. 94–111, 2008. [18] L. Chen, R. J. Housden, G. M. Treece, A. H. Gee, and R. W. Prager, “A hybrid displacement estimation method for ultrasonic elasticity imaging,” IEEE Transactions on Ultrasonics, Ferroelectrics and Frequency Control, vol. 57, no. 4, pp. 866–882, 2010. [19] Y. Zhu and T. J. Hall, “A modified block matching method for real-time freehand strain imaging,” Ultrasonic Imaging, vol. 24, no. 3, pp. 161–176, 2002. [20] A. Jensen J and Field., “A program for simulating ultrasound systems,” in Proceedings of the 10th Nordicbaltic Conference on Biomedical Imaging, vol. 4, Supplement 1, pp. 351–353, 1996. [21] H. Shi and T. Varghese, “Two-dimensional multi-level strain estimation for discontinuous tissue,” Physics in Medicine and Biology, vol. 52, no. 2, article no. 006, pp. 389–401, 2007. [22] L. Chen, G. M. Treece, J. E. Lindop, A. H. Gee, and R. W. Prager, “A quality-guided displacement tracking algorithm for ultrasonic elasticity imaging,” Medical Image Analysis, vol. 13, no. 2, pp. 286–296, 2009. [23] F. Kallel and J. Ophir, “A least-squares strain estimator for elastography,” Ultrasonic Imaging, vol. 19, no. 3, pp. 195–208, 1997. [24] J. A. Jensen and P. Munk, “Computer phantoms for simulating ultrasound B-Mode and CFM Images,” in Acoustical Imaging, vol. 23, pp. 75–80, 1997. [25] T. Varghese and J. Ophir, “An analysis of elastographic contrastto-noise ratio,” Ultrasound in Medicine & Biology, vol. 24, no. 6, pp. 915–924, 1998.
BioMed Research International
MEDIATORS of
INFLAMMATION
The Scientific World Journal Hindawi Publishing Corporation http://www.hindawi.com
Volume 2014
Gastroenterology Research and Practice Hindawi Publishing Corporation http://www.hindawi.com
Volume 2014
Journal of
Hindawi Publishing Corporation http://www.hindawi.com
Diabetes Research Volume 2014
Hindawi Publishing Corporation http://www.hindawi.com
Volume 2014
Hindawi Publishing Corporation http://www.hindawi.com
Volume 2014
International Journal of
Journal of
Endocrinology
Immunology Research Hindawi Publishing Corporation http://www.hindawi.com
Disease Markers
Hindawi Publishing Corporation http://www.hindawi.com
Volume 2014
Volume 2014
Submit your manuscripts at https://www.hindawi.com BioMed Research International
PPAR Research Hindawi Publishing Corporation http://www.hindawi.com
Hindawi Publishing Corporation http://www.hindawi.com
Volume 2014
Volume 2014
Journal of
Obesity
Journal of
Ophthalmology Hindawi Publishing Corporation http://www.hindawi.com
Volume 2014
Evidence-Based Complementary and Alternative Medicine
Stem Cells International Hindawi Publishing Corporation http://www.hindawi.com
Volume 2014
Hindawi Publishing Corporation http://www.hindawi.com
Volume 2014
Journal of
Oncology Hindawi Publishing Corporation http://www.hindawi.com
Volume 2014
Hindawi Publishing Corporation http://www.hindawi.com
Volume 2014
Parkinson’s Disease
Computational and Mathematical Methods in Medicine Hindawi Publishing Corporation http://www.hindawi.com
Volume 2014
AIDS
Behavioural Neurology Hindawi Publishing Corporation http://www.hindawi.com
Research and Treatment Volume 2014
Hindawi Publishing Corporation http://www.hindawi.com
Volume 2014
Hindawi Publishing Corporation http://www.hindawi.com
Volume 2014
Oxidative Medicine and Cellular Longevity Hindawi Publishing Corporation http://www.hindawi.com
Volume 2014